Downloaded 259 times


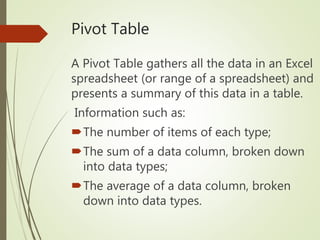
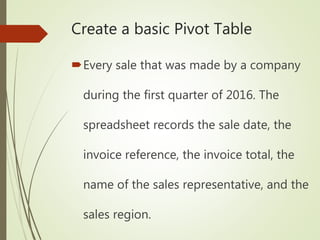
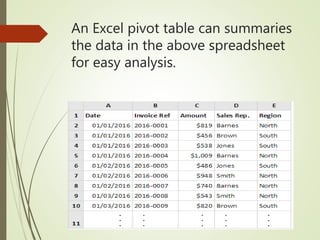
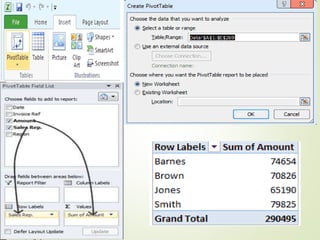
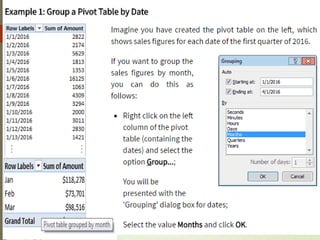


This document provides an overview of advanced Excel skills and features. It begins by introducing pivot tables, which allow users to summarize and analyze large datasets. It then discusses various job roles that require advanced Excel skills, such as finance, HR, and analytics. Finally, it outlines the types of companies that employ advanced Excel users and the skills needed, such as automating tasks and using complex formulas.


![SecurityBoat_Service_Pitch_Deck[24158].pdf](https://cdn.slidesharecdn.com/ss_thumbnails/securityboatservicepitchdeck24158-260121113056-452683e3-thumbnail.jpg?width=640&height=640&fit=bounds)


