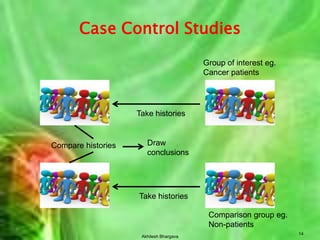
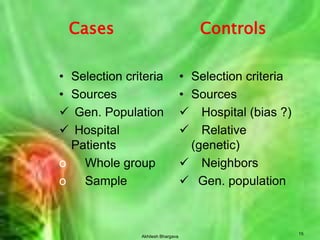
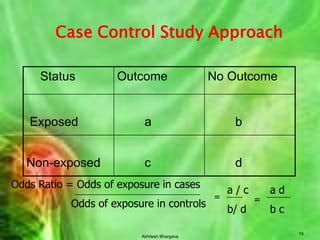
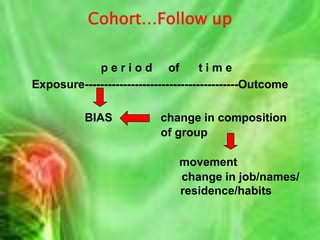
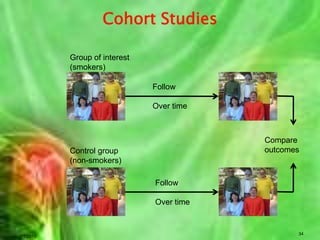
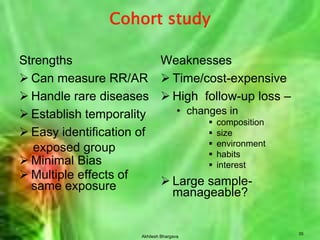
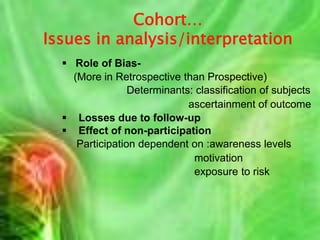
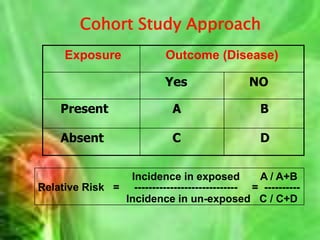
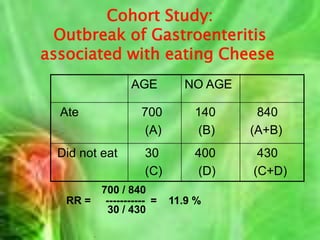
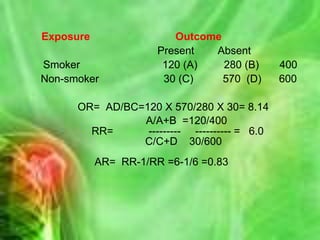
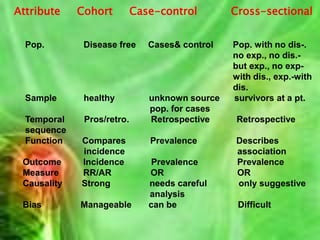
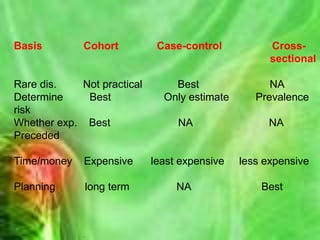
This document discusses different types of epidemiological studies including descriptive studies, analytical studies, and experimental studies. Descriptive studies are divided into population studies and individual studies. Analytical studies include case-control studies and cohort studies. Key aspects of case-control and cohort study designs such as selection of cases/controls, sources of information, issues in analysis/interpretation, and strengths/weaknesses are described.
The STUDY of the DISTRIBUTION and DETERMINANTS of HEALTH-RELATED STATES in specified POPULATIONS, and the application of this study to CONTROL of health problems."
Study designs, Epidemiological study design, Types of studiesDr Lipilekha Patnaik
Study design, Epidemiological study designA study design is a specific plan or protocol
for conducting the study, which allows the investigator to translate the conceptual hypothesis into an operational one.
Measurements of morbidity and mortality
At the end of the session, the students shall be able to
List the basic measurements in epidemiology
Select an appropriate tools of measurement
Measure morbidity & mortality
Perform standardization of rates
Observingthedistributionofdiseaseorhealth related events in human population.
• Identify the characteristics with which the disease is associated.
• Basically 3 questions are asked who, when and where.
• Who means the person affected, where means the place and when is the time distribution.
An epidemiological experiment in which subjects in a population are randomly allocated into groups, usually called study and control groups to receive and not receive an experimental preventive or therapetuic procedure, maneuver, or intervention .
Excelsior College PBH 321 Page 1 CASE-CONTROL STU.docxgitagrimston
Excelsior College PBH 321
Page 1
CASE-CONTROL STUD IES
A case-control study is an observational design that involves studying a population in which cases of disease
are identified and enrolled, and a sample of the population that produced the cases is identified and enrolled
(controls). Exposures are determined for individuals in both groups.
Let’s say that we want to test the hypothesis that pesticide exposure increases the risk of breast cancer.
Consider a hypothetical prospective cohort study of 89,949 women aged 34-59; 1,439 breast cancer cases
were identified over 8 years of follow-up. Blood was drawn on all 89,949 at beginning of follow-up and
samples were frozen. The exposure was defined as the level of pesticides (e.g. DDE) in blood, characterized as
high or low. We compare women with high or low exposures to see if they got breast cancer or not by the end
of follow-up.
Breast Cancer
Yes No Total
DDE
exposure High 360 13,276 13,636
Relative Risk = RR = (360/13,636) / (1,079/76,313) = 1.9
Low 1,079 75,234 76,313
Women with high pesticide levels in the blood have 1.9
times the risk of developing breast cancer after 8 years
than women with low levels
Total 1,439 88,510 89,949
Conducting this study presents a practical problem: quantifying pesticide levels in the blood is very expensive -
-it's not feasible to analyze all 89,949 blood samples (this would cost many thousands of dollars).
To be efficient, we could instead analyze blood on all breast cancer cases (N=1,439) but take only a sample of
the women who did not get breast cancer, say two times as many cases (N=2,878) (controls). This is a case-
control study! Specifically, because we sampled cases and controls from within a complete cohort, we refer to
this as a nested case-control study.
Breast Cancer
Cases Controls
DDE
exposure
High 360 432
Low 1,079 2,446
Total 1,439 2,878
Excelsior College PBH 321
Page 2
Timing and Set Up of a Case-Control Study
Cases
When identifying cases, the criteria for the case definition should lead to accurate classification of disease.
This means the investigator must have efficient and accurate sources to identify cases, such as existing disease
registries or hospitals.
In our standard 2 x 2 table, the number of cases gives you the numerators of the rates of disease in exposed
and unexposed groups being compared.
Disease
Yes
(cases)
No
(controls)
Total
Exposure Yes a ? ? Rate of disease in exposed: a/?
No c ? ?
Rate of disease in
unexposed: c/?
Total a+c ? ?
What is missing? The denominators! If this were a cohort study, you would have the total population (if you
were calculating cumulative incidence) or total person-years (if you were calculating incidence rates) for both
the exposed and non-exposed groups, which would provide the c ...
This is the handout version of a lecture I give to medical residents and fellows on the basics of clinical research designs and the inherent issues that go along with each one. I give this lecture as part of a multi-module lecture series on research design and statistical analysis.
Comparing research designs fw 2013 handout versionPat Barlow
This is an updated version of my Comparing Research Designs lecture, which now includes discussions on: (1) common considerations with research design such as bias, reliability, validity, and confounding; and (2) expanded discussion of RCT designs including factorial and cross-over designs.
JMeter webinar - integration with InfluxDB and GrafanaRTTS
Watch this recorded webinar about real-time monitoring of application performance. See how to integrate Apache JMeter, the open-source leader in performance testing, with InfluxDB, the open-source time-series database, and Grafana, the open-source analytics and visualization application.
In this webinar, we will review the benefits of leveraging InfluxDB and Grafana when executing load tests and demonstrate how these tools are used to visualize performance metrics.
Length: 30 minutes
Session Overview
-------------------------------------------
During this webinar, we will cover the following topics while demonstrating the integrations of JMeter, InfluxDB and Grafana:
- What out-of-the-box solutions are available for real-time monitoring JMeter tests?
- What are the benefits of integrating InfluxDB and Grafana into the load testing stack?
- Which features are provided by Grafana?
- Demonstration of InfluxDB and Grafana using a practice web application
To view the webinar recording, go to:
https://www.rttsweb.com/jmeter-integration-webinar
Key Trends Shaping the Future of Infrastructure.pdfCheryl Hung
Keynote at DIGIT West Expo, Glasgow on 29 May 2024.
Cheryl Hung, ochery.com
Sr Director, Infrastructure Ecosystem, Arm.
The key trends across hardware, cloud and open-source; exploring how these areas are likely to mature and develop over the short and long-term, and then considering how organisations can position themselves to adapt and thrive.
GraphRAG is All You need? LLM & Knowledge GraphGuy Korland
Guy Korland, CEO and Co-founder of FalkorDB, will review two articles on the integration of language models with knowledge graphs.
1. Unifying Large Language Models and Knowledge Graphs: A Roadmap.
https://arxiv.org/abs/2306.08302
2. Microsoft Research's GraphRAG paper and a review paper on various uses of knowledge graphs:
https://www.microsoft.com/en-us/research/blog/graphrag-unlocking-llm-discovery-on-narrative-private-data/
Connector Corner: Automate dynamic content and events by pushing a buttonDianaGray10
Here is something new! In our next Connector Corner webinar, we will demonstrate how you can use a single workflow to:
Create a campaign using Mailchimp with merge tags/fields
Send an interactive Slack channel message (using buttons)
Have the message received by managers and peers along with a test email for review
But there’s more:
In a second workflow supporting the same use case, you’ll see:
Your campaign sent to target colleagues for approval
If the “Approve” button is clicked, a Jira/Zendesk ticket is created for the marketing design team
But—if the “Reject” button is pushed, colleagues will be alerted via Slack message
Join us to learn more about this new, human-in-the-loop capability, brought to you by Integration Service connectors.
And...
Speakers:
Akshay Agnihotri, Product Manager
Charlie Greenberg, Host
Accelerate your Kubernetes clusters with Varnish CachingThijs Feryn
A presentation about the usage and availability of Varnish on Kubernetes. This talk explores the capabilities of Varnish caching and shows how to use the Varnish Helm chart to deploy it to Kubernetes.
This presentation was delivered at K8SUG Singapore. See https://feryn.eu/presentations/accelerate-your-kubernetes-clusters-with-varnish-caching-k8sug-singapore-28-2024 for more details.
Essentials of Automations: Optimizing FME Workflows with ParametersSafe Software
Are you looking to streamline your workflows and boost your projects’ efficiency? Do you find yourself searching for ways to add flexibility and control over your FME workflows? If so, you’re in the right place.
Join us for an insightful dive into the world of FME parameters, a critical element in optimizing workflow efficiency. This webinar marks the beginning of our three-part “Essentials of Automation” series. This first webinar is designed to equip you with the knowledge and skills to utilize parameters effectively: enhancing the flexibility, maintainability, and user control of your FME projects.
Here’s what you’ll gain:
- Essentials of FME Parameters: Understand the pivotal role of parameters, including Reader/Writer, Transformer, User, and FME Flow categories. Discover how they are the key to unlocking automation and optimization within your workflows.
- Practical Applications in FME Form: Delve into key user parameter types including choice, connections, and file URLs. Allow users to control how a workflow runs, making your workflows more reusable. Learn to import values and deliver the best user experience for your workflows while enhancing accuracy.
- Optimization Strategies in FME Flow: Explore the creation and strategic deployment of parameters in FME Flow, including the use of deployment and geometry parameters, to maximize workflow efficiency.
- Pro Tips for Success: Gain insights on parameterizing connections and leveraging new features like Conditional Visibility for clarity and simplicity.
We’ll wrap up with a glimpse into future webinars, followed by a Q&A session to address your specific questions surrounding this topic.
Don’t miss this opportunity to elevate your FME expertise and drive your projects to new heights of efficiency.
UiPath Test Automation using UiPath Test Suite series, part 4DianaGray10
Welcome to UiPath Test Automation using UiPath Test Suite series part 4. In this session, we will cover Test Manager overview along with SAP heatmap.
The UiPath Test Manager overview with SAP heatmap webinar offers a concise yet comprehensive exploration of the role of a Test Manager within SAP environments, coupled with the utilization of heatmaps for effective testing strategies.
Participants will gain insights into the responsibilities, challenges, and best practices associated with test management in SAP projects. Additionally, the webinar delves into the significance of heatmaps as a visual aid for identifying testing priorities, areas of risk, and resource allocation within SAP landscapes. Through this session, attendees can expect to enhance their understanding of test management principles while learning practical approaches to optimize testing processes in SAP environments using heatmap visualization techniques
What will you get from this session?
1. Insights into SAP testing best practices
2. Heatmap utilization for testing
3. Optimization of testing processes
4. Demo
Topics covered:
Execution from the test manager
Orchestrator execution result
Defect reporting
SAP heatmap example with demo
Speaker:
Deepak Rai, Automation Practice Lead, Boundaryless Group and UiPath MVP
Software Delivery At the Speed of AI: Inflectra Invests In AI-Powered QualityInflectra
In this insightful webinar, Inflectra explores how artificial intelligence (AI) is transforming software development and testing. Discover how AI-powered tools are revolutionizing every stage of the software development lifecycle (SDLC), from design and prototyping to testing, deployment, and monitoring.
Learn about:
• The Future of Testing: How AI is shifting testing towards verification, analysis, and higher-level skills, while reducing repetitive tasks.
• Test Automation: How AI-powered test case generation, optimization, and self-healing tests are making testing more efficient and effective.
• Visual Testing: Explore the emerging capabilities of AI in visual testing and how it's set to revolutionize UI verification.
• Inflectra's AI Solutions: See demonstrations of Inflectra's cutting-edge AI tools like the ChatGPT plugin and Azure Open AI platform, designed to streamline your testing process.
Whether you're a developer, tester, or QA professional, this webinar will give you valuable insights into how AI is shaping the future of software delivery.
State of ICS and IoT Cyber Threat Landscape Report 2024 previewPrayukth K V
The IoT and OT threat landscape report has been prepared by the Threat Research Team at Sectrio using data from Sectrio, cyber threat intelligence farming facilities spread across over 85 cities around the world. In addition, Sectrio also runs AI-based advanced threat and payload engagement facilities that serve as sinks to attract and engage sophisticated threat actors, and newer malware including new variants and latent threats that are at an earlier stage of development.
The latest edition of the OT/ICS and IoT security Threat Landscape Report 2024 also covers:
State of global ICS asset and network exposure
Sectoral targets and attacks as well as the cost of ransom
Global APT activity, AI usage, actor and tactic profiles, and implications
Rise in volumes of AI-powered cyberattacks
Major cyber events in 2024
Malware and malicious payload trends
Cyberattack types and targets
Vulnerability exploit attempts on CVEs
Attacks on counties – USA
Expansion of bot farms – how, where, and why
In-depth analysis of the cyber threat landscape across North America, South America, Europe, APAC, and the Middle East
Why are attacks on smart factories rising?
Cyber risk predictions
Axis of attacks – Europe
Systemic attacks in the Middle East
Download the full report from here:
https://sectrio.com/resources/ot-threat-landscape-reports/sectrio-releases-ot-ics-and-iot-security-threat-landscape-report-2024/
Encryption in Microsoft 365 - ExpertsLive Netherlands 2024Albert Hoitingh
In this session I delve into the encryption technology used in Microsoft 365 and Microsoft Purview. Including the concepts of Customer Key and Double Key Encryption.
Epistemic Interaction - tuning interfaces to provide information for AI supportAlan Dix
Paper presented at SYNERGY workshop at AVI 2024, Genoa, Italy. 3rd June 2024
https://alandix.com/academic/papers/synergy2024-epistemic/
As machine learning integrates deeper into human-computer interactions, the concept of epistemic interaction emerges, aiming to refine these interactions to enhance system adaptability. This approach encourages minor, intentional adjustments in user behaviour to enrich the data available for system learning. This paper introduces epistemic interaction within the context of human-system communication, illustrating how deliberate interaction design can improve system understanding and adaptation. Through concrete examples, we demonstrate the potential of epistemic interaction to significantly advance human-computer interaction by leveraging intuitive human communication strategies to inform system design and functionality, offering a novel pathway for enriching user-system engagements.
Dev Dives: Train smarter, not harder – active learning and UiPath LLMs for do...UiPathCommunity
💥 Speed, accuracy, and scaling – discover the superpowers of GenAI in action with UiPath Document Understanding and Communications Mining™:
See how to accelerate model training and optimize model performance with active learning
Learn about the latest enhancements to out-of-the-box document processing – with little to no training required
Get an exclusive demo of the new family of UiPath LLMs – GenAI models specialized for processing different types of documents and messages
This is a hands-on session specifically designed for automation developers and AI enthusiasts seeking to enhance their knowledge in leveraging the latest intelligent document processing capabilities offered by UiPath.
Speakers:
👨🏫 Andras Palfi, Senior Product Manager, UiPath
👩🏫 Lenka Dulovicova, Product Program Manager, UiPath
3. Akhilesh Bhargava 3 Types of Descriptive studies a. Population (Correlation) studies. b. Individual studies i. Case reports ii. Case series iii. Cross sectional studies (Prevalence studies)
4. Akhilesh Bhargava 4 Population (Correlation) studies. Use data from entire population to compare- Disease frequency between different population groups during same period Disease frequency insame population at different periods. useful in formulation of a hypothesis but not for testing a hypothesis.
5. Akhilesh Bhargava 5 Advantages and Limitations Exposure cannot be linked with disease as whole population is represented. Lack of ability to control the effects of potential confounding variables. Presence of a correlation does not necessarily mean a statistical association. Correlation data represent average exposure levels rather than actual individual levels Inexpensive in terms of Time & Money Routinely available information can be used
6. Akhilesh Bhargava 6 Individual studies Case reports (single patient) Case series (group of patients with similar diagnosis)
7. Akhilesh Bhargava 7 Individual studies:Advantages and Limitations Cases can be aggregated from different sources to generate hypotheses and describe syndromes Statistical association can not be established as there is no comparison group
8. Akhilesh Bhargava 8 Cross sectional studies Measure disease and exposure simultaneously in a defined population over a defined period provide instant information about frequency and characteristics of a disease Useful in- Assessing health status Identifying health care needs. Providing data on Prevalence of Disease, disability and utilization of services Provide data for Health care planning and administration
9. Akhilesh Bhargava 9 Advantages and Limitations Short term so less expensive Offer starting point in prospective studies Allow assessment of risk though less precise Start from a reference population from where sample is drawn, generalization can be made Not possible to ascertain whether exposure preceded or resulted from the disease. Since prevalence is assessed, results are affected by survival factors
10. Akhilesh Bhargava 10 Case-Control study A non-experimental Study, Subjects enrolled based on presence/absence of outcome, Cases/controls compared with regard to prior exposure to causal factors.
11. Akhilesh Bhargava 11 Designing: case-control Criteria- Comparability of cases & controls Issues – # Defining & selection of cases # Selection of controls # Information on disease exposure status
12. Akhilesh Bhargava 12 Case-control: strengths &limitations Study of diseases with long latent period Low cost Short time Applicable to rare diseases also Bias in selection/Reporting/Recording.
13. Akhilesh Bhargava 13 Case-control : selection of cases Requirements- A standard case definition Inclusion of likes, exclusion of dislikes A strict diagnostic criteria for homogeneity Only newly diagnosed cases be included- Older cases may distort the presentation Selection – Hospital based Pop. based
14. 14 Group of interest eg. Cancer patients Take histories Draw conclusions Compare histories Take histories Comparison group eg. Non-patients Case Control Studies Akhilesh Bhargava
22. Akhilesh Bhargava 17 Advantages/Disadvantage of control sources Source AdvantageDisadvantage Hospital - easy identification - do not represent - belong to same class exposure in general - cooperative population - min. non-response - admission bias Gen .Pop. - high comparability - costly, more time, - recall bias - loss during study
23. Akhilesh Bhargava 18 Selection of controls How many control groups ? Hospital – more than one Where one group has some deficiency (stress & peptic ulcer in executives) and stress present in hospitalized How many subjects in a control group? 1:1 if no. of cases & controls is large and cost of getting information is same Max. 4:1, more does not increase statistical strength but cost increases
24. Akhilesh Bhargava 19 Case Control Study Approach Odds Ratio = Odds of exposure in cases Odds of exposure in controls a / c b/ d a d b c = =
25. Akhilesh Bhargava 20 Odds Ratio = Relative RiskConditions & Interpretations OR –an unbiased and valid estimate of RR in Case control studies, as- only newly diagnosed are included selection is not based on exposure level An OR=1- no statistical association - exposure is not a risk factor OR >1 – a positive association between exposure and outcome OR<1 – Less risk, or even protective value of a Risk factor.
26. Akhilesh Bhargava 21 Bias and its play in Case Control study- Bias “any systematic error in the study that results in an incorrect estimate of the association between exposure and risk of disease”.
27. Akhilesh Bhargava 22 Types of Bias- 1. Selection Bias a. Prevalence-Incidence Bias b. Admission rate (Berkson’s) Bias c. Non-response/ Refusal Bias 2. Observational or Information Bias a. Diagnostic Bias b. Recall Bias
32. Cohortgroup with common experience Roman Army Groups Cohort study- “A non-experimental study, subjects enrolled based on exposure level to main independent variable, followed to determine development of the dependent variable” 24 . Akhilesh Bhargava
33.
34. Follow up over a period of timeTypes- Retrospective (after exposure but certainly before disease/ outcome) Prospective (exposure may/may not have but outcome certainly not)
35. ExposureCase control studyDisease ?---------------------------------- ?---------------------------------- Prospective Cohort Study Exposure Disease --------------- ------------------? ------------------- ------------------- ? Retrospective cohort Study Exposure Disease ----------------------------------------------- ? ---------------------------------------------- ?
36. Study design- considerations General- Hypothesis to be tested Resources Current state of knowledge Which of cohort study ? Time Money Latent pd. of disease Availability of information/Records Frequency of occurrence of disease Sample size Follow up period required
37. Issues in Cohort study design Selection – Exposed group Comparison group Sources of data – Exposure data Outcome data Approaches to follow-up
39. Cohort…Sources of information Information- complete & accurate Exposed- Gen. population Special exposure groups Comparison- Graded exposure groups Individuals from same work cohort without exposure to risk factor Rates of disease in gen. pop. Gen. Population
45. Cohort…Follow up p e r i o d of t i m e Exposure----------------------------------------Outcome BIAS change in composition of group movement change in job/names/ residence/habits
46. Cohort Studies 1/23/2010 34 Group of interest (smokers) Follow Over time Compare outcomes Control group (non-smokers) Follow Over time
64. Attribute Cohort Case-control Cross-sectional Pop. Disease free Cases& control Pop. with no dis-. no exp., no dis.- but exp., no exp- with dis., exp.-with dis. Sample healthy unknown source survivors at a pt. pop. for cases Temporal Pros/retro. Retrospective Retrospective sequence Function Compares Prevalence Describes incidence association Outcome Incidence Prevalence Prevalence Measure RR/AR OR OR Causality Strong needs careful only suggestive analysis Bias Manageable can be Difficult
65. Basis Cohort Case-control Cross- sectional Rare dis. Not practical Best NA Determine Best Only estimate Prevalence risk Whether exp. Best NA NA Preceded Time/money Expensive least expensive less expensive Planning long term NA Best .