This document summarizes a presentation on case-control studies. It defines epidemiology and different types of studies. It then discusses the key aspects of case-control studies including:
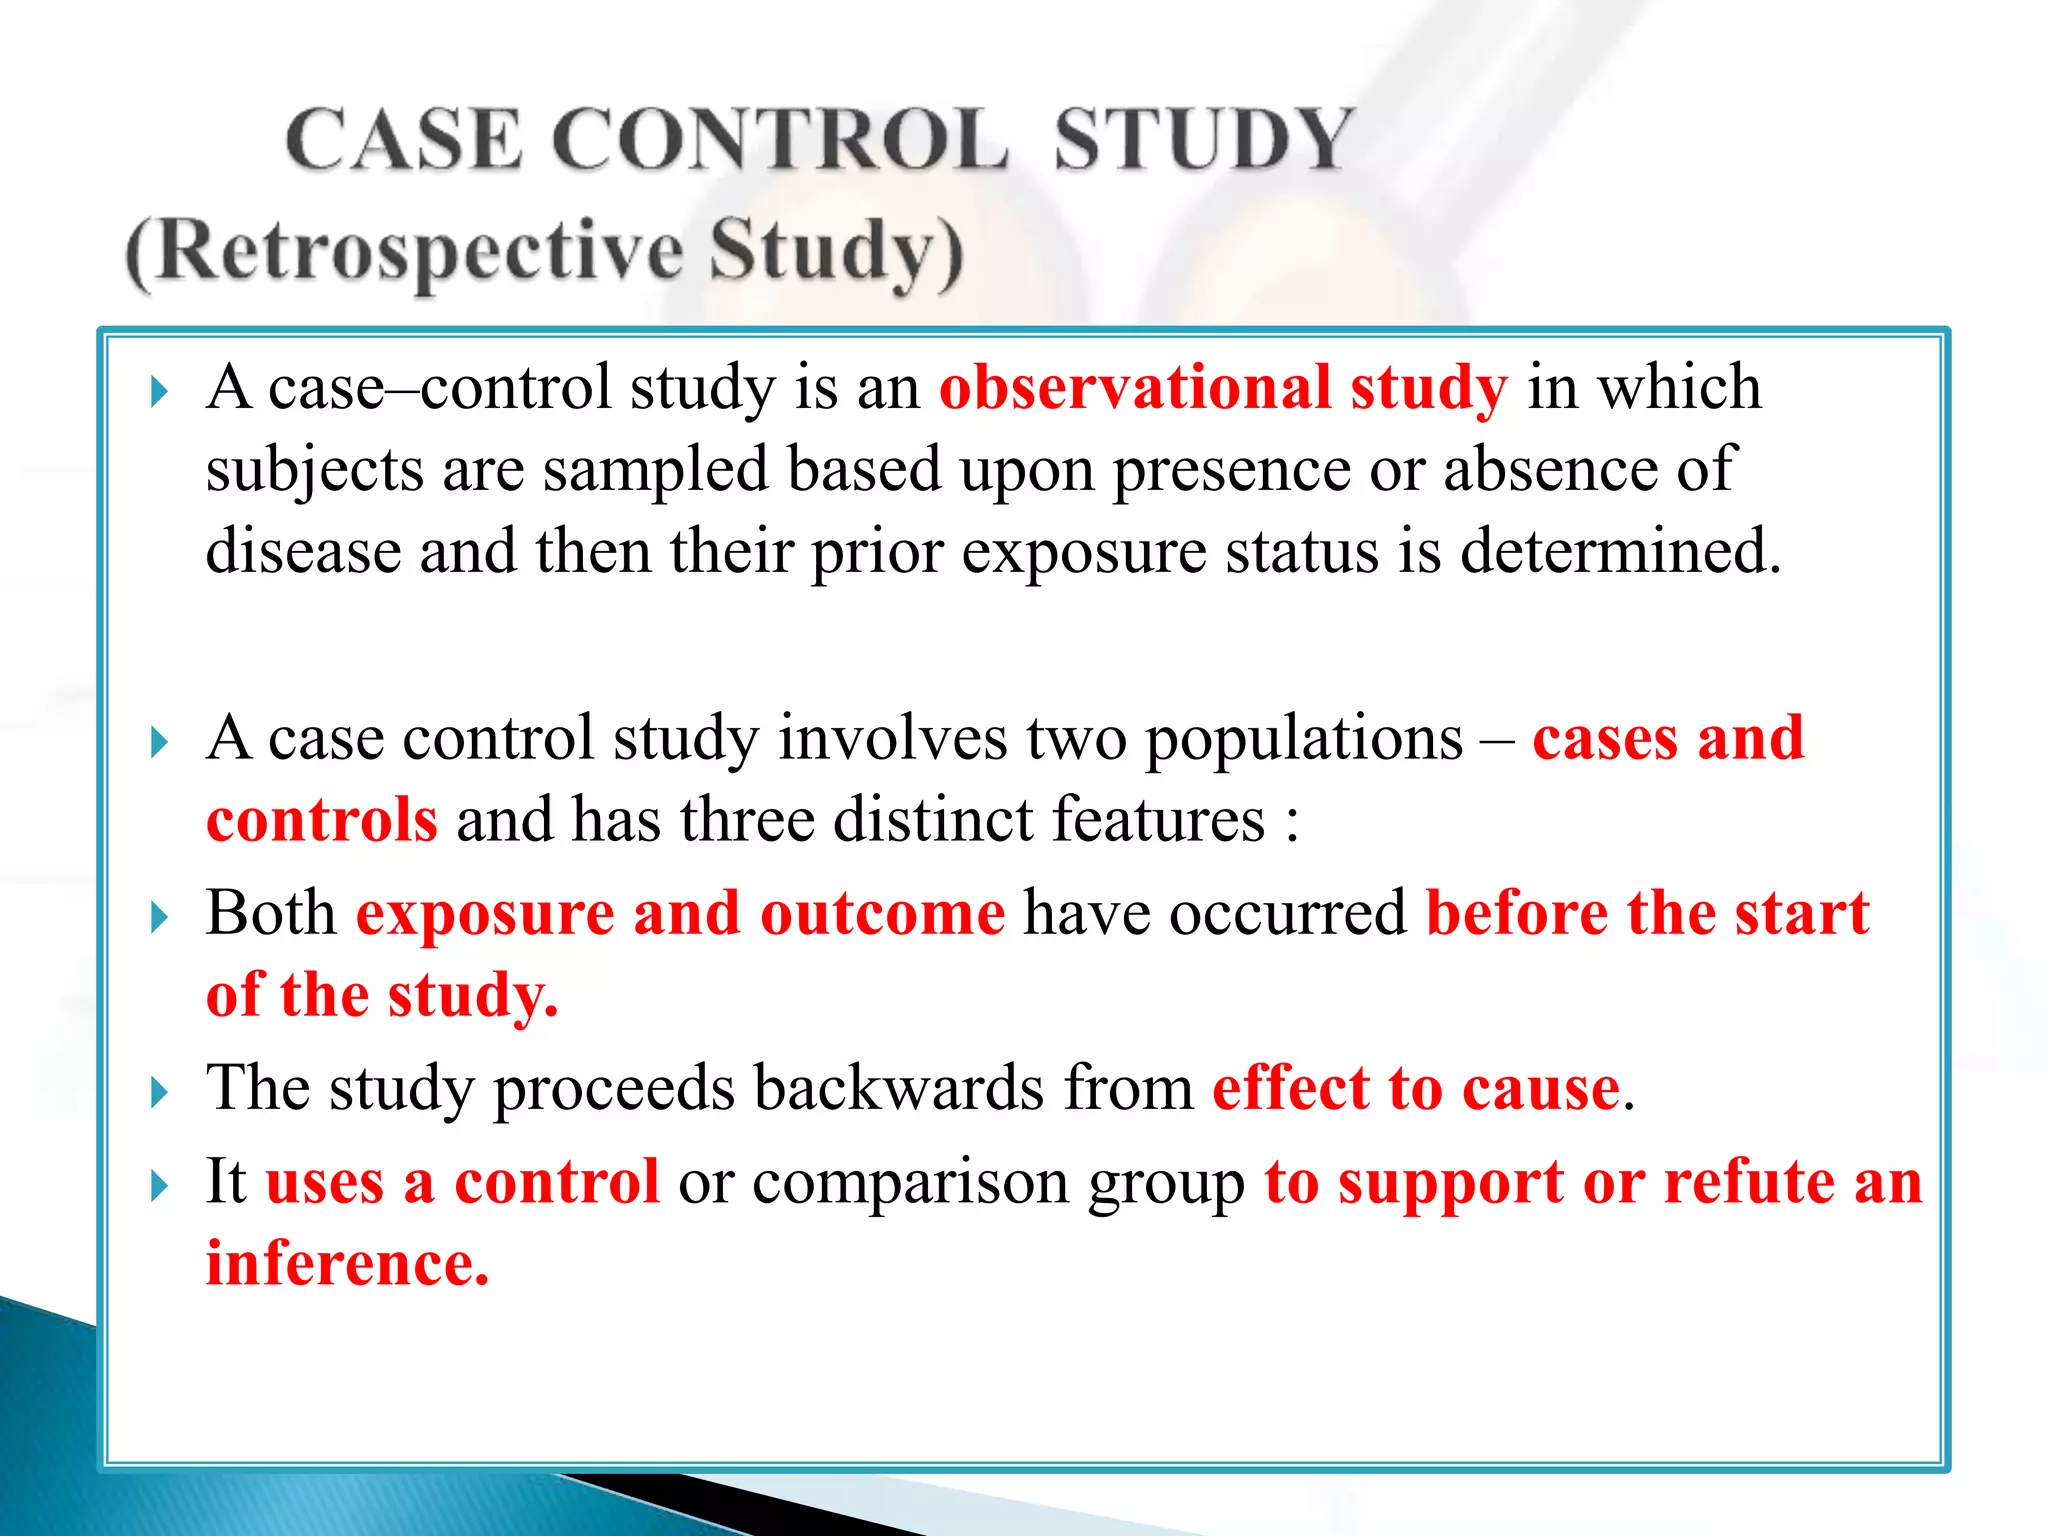
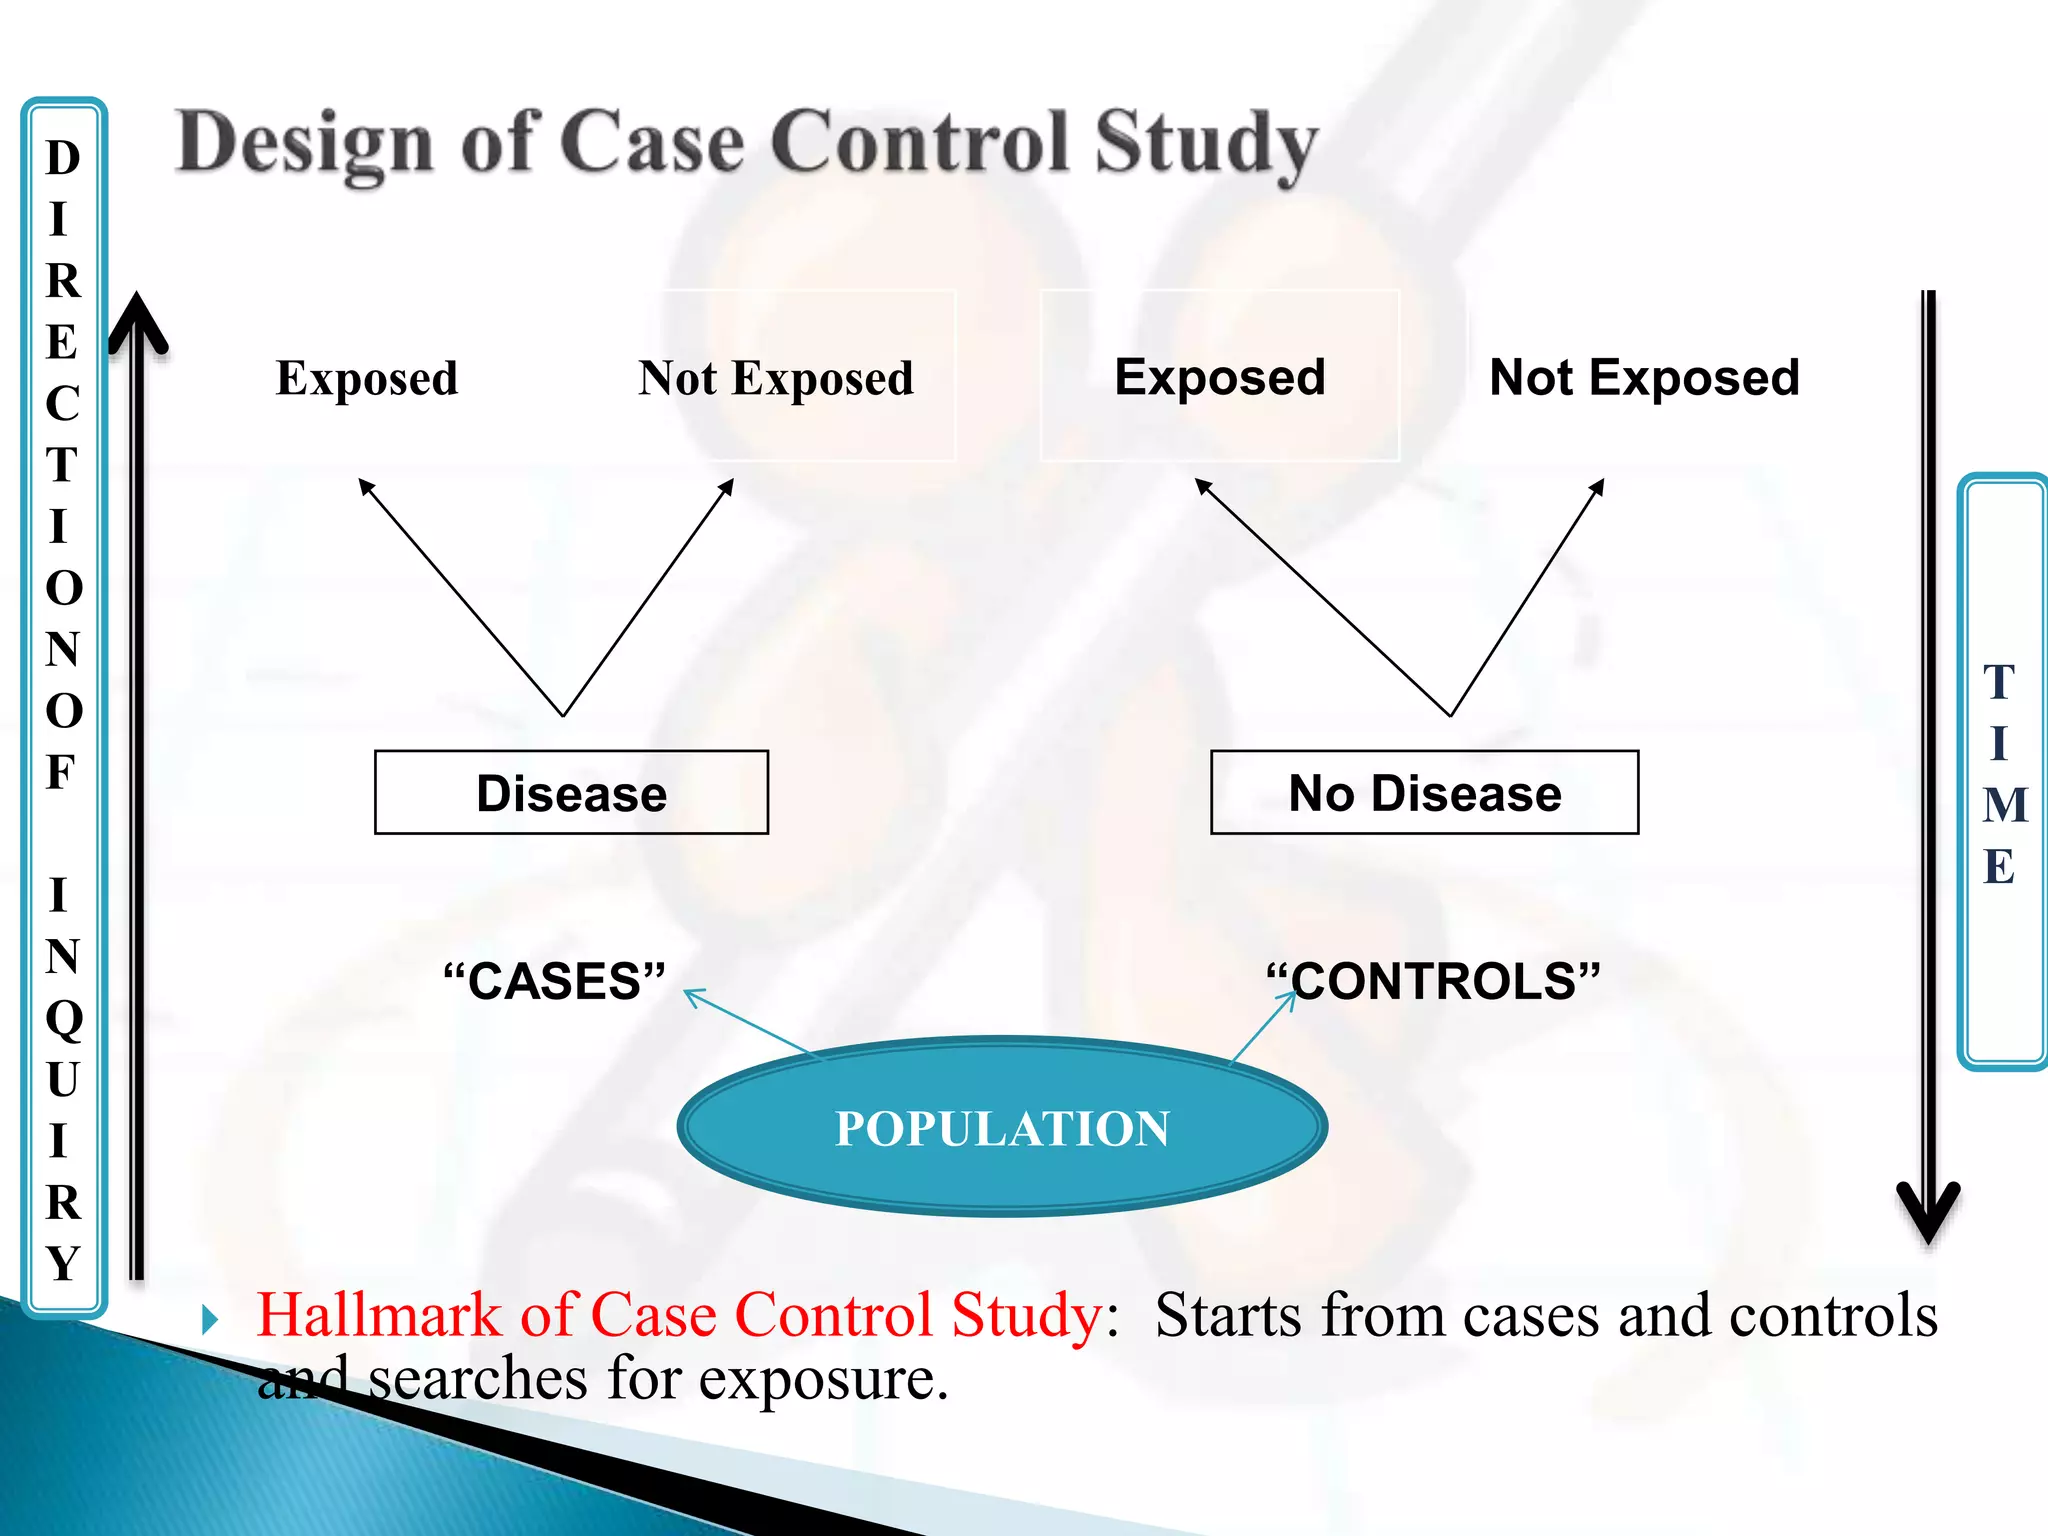
- They proceed backwards from the effect (disease) to the potential cause (exposure).
- Cases and controls are selected and their exposure status is determined. Exposure rates, relative risk, and odds ratios can then be estimated.
- Important steps include properly defining cases and controls, selecting controls, matching, measuring exposure, and analyzing for bias. Case-control studies are useful for investigating rare diseases and establishing causal relationships.
Call Girls Service Nandiambakkam | 7001305949 At Low Cost Cash Payment Booking
Epidemiology Case-Control Study
1. Presented by: Dr. Adrija Roy
Moderator: Dr. (Prof) R.N. Rout(Professor & H.O.D)
Dr. Ipsa Mohapatra(Assistant Professor)
Dr. Shalini Ray(3rd year P.G.)
2. Epidemiology
Types of Studies
Hierarchy of Study Design
Analytical Study
Case-Control Study
Study design
Basic Steps
Selection of cases and controls
Matching
Measurement of exposure
Analysis and outcomes
Bias in Case control Study
Important historical examples
Summary.
3. DEFINITION:
"The study of the distribution and
determinants of health- related states or events
in specified populations, and the application of
this study to control health problems.“
( John M.Last,1988)
4. Experimental Observational
RCT Field Trials Community
Trials
Analytical Descriptive
Ecological Cross-sectional Case-control Cohort
Difference in study
groups is
CREATED
EXPERIMENTALLY
and outcomes
observed
Difference in study
groups is
ONLY observed &
analyzed,
NOT created
experimentally
6. In analytical studies , the subject of interest is the
individual within the population.
The object is not to formulate but to test the hypothesis.
To evaluate an association between exposure and disease.
Analytical studies focuses on the magnitude of the
association between the exposure and the health problem
under the study.
7. A case–control study is an observational study in which
subjects are sampled based upon presence or absence of
disease and then their prior exposure status is determined.
A case control study involves two populations – cases and
controls and has three distinct features :
Both exposure and outcome have occurred before the start
of the study.
The study proceeds backwards from effect to cause.
It uses a control or comparison group to support or refute an
inference.
8. Unit of Study: Cases/Control(Individuals)
Study Question : What had happened
Direction of Inquiry: Exposure Outcome
Study Design:
9. Hallmark of Case Control Study: Starts from cases and controls
and searches for exposure.
Disease No Disease
“CASES” “CONTROLS”
Not ExposedExposed Exposed Not Exposed
POPULATION
T
I
M
E
D
I
R
E
C
T
I
O
N
O
F
I
N
Q
U
I
R
Y
10. FIRST: Select
CASES CONTROLS
(With Disease) (Without Disease)
THEN: Were exposed a b
Measure
Exposure Were not exposed c d
TOTALS a + c b + d
Proportions a b
Exposed a + c b + d
11. Selection of cases and controls.
Matching.
Measurement of exposure
Analysis and interpretation.
12.
13. Case : A person in the population or study group
identified as having the particular disease, health
disorder or condition under investigation. (Dictionary of
Epidemiology: 3rd ed; John M Last. 2000)
Control: Person or persons in a comparison group
that differs, in disease experience (or other health
related outcome) in not having the outcome being
studied. (Dictionary of Epidemiology: 3rd ed; John M Last. 2000)
14. Definition of case: it involve two specifications-
(i) Diagnostic criteria :
Enunciate clear cut diagnostic criteria for the disease
of interest.
must be specified before the study is undertaken.
Once established, it should not be altered or changed
till the study is over.
. (ii) Eligibility criteria :
It is always advisable to take the incident cases (new
cases) since the prevalent cases (old cases in advanced
stages)might have changed their exposure status due to
medical advice etc
15. Hospitals:
• Convenient
• Can be chosen from one hospital or a network of hospitals.
• Admitted during a specified period of time
• Entire case series or random sample is selected.
General population
• All cases of the study disease occurring within the same
geographical area during a specified period of time.
• Through survey, disease registry or hospital network.
• Entire case series or random sample.
• should be fairly representative of all cases in the community.
16. (i) Should the controls be similar to the cases in all
respects other than having the disease? i.e.
COMPARABLE
(ii) (ii) Should the controls be representative of all non-
diseased people in the population from which the
cases are selected? i.e. REPRESENTATIVE
17. Selection of CONTROLS:
◦ Comparability vs Representativeness
◦ The control group should be representative of the
general population in terms of probability of
exposure to the risk factor
◦ AND they should also have had the same
opportunity to be exposed as the cases have.
Not that both cases and controls are equally
exposed; but only that they have had the same
opportunity for exposure.
18. Selection of CONTROLS: Criteria
◦ Comparability is more important than
representativeness in the selection of controls
◦ The control should resemble the case in all
respects except for the presence of disease (and
any as yet undiscovered risk factors for disease)
19. Selection of CONTROLS: Sources
Source Advantage Disadvantage
Hospital based Easily identified.
Available for interview.
More willing to cooperate.
Tend to give complete and
accurate information
(recall bias).
Not typical of general population.
Possess more risk factors for disease.
Some diseases may share risk factors with
disease under study. (whom to
exclude???)
Berkesonian bias
Population based
(registry cases)
Most representative of the
general population.
Generally healthy.
Time, money, energy.
Opportunity of exposure may not be same
as that of cases. (location, occurance,)
Neighbourhood
controls/ Telephone
exchange random
dialing
Controls and cases similar in
residence.
Easier than sampling the
population.
Non cooperation.
Security issues.
Not representative of general population.
Best friend control/
Sibling control
Accessible, Cooperative.
Similar to cases in most
aspects.
Overmatching.
20. Selection of Controls : Number
o Large study: Cases: Control :: 1:1
o Small study: Cases: Control :: 1:2, 1:3, 1:4.
o Use of multiple controls
Multiple controls of different types:
controls- 1 hospital, 1 neighborhood e.g. case- Children
with brain tumor, control- children with other cancer,
normal children, risk factor- h/o radiation exposure.
21. Multiple controls of different types are valuable for exploring
alternate hypothesis & for taking into account possible
potential recall bias.
(From Gold EB, Gordis L, Tonascia J, Szklo M; Risk factors for brain tumors in
children. Am J Epidemiol 1979)
Children with
brain tumors
Children with
other cancers
Children without
cancer
Radiation
causes
cancers
Radiation
causes brain
cancers only
22. Process by which we select
controls in such a way that
they are similar to cases with
regards to certain pertinent
selected variables
(e g. age, sex, occupation,
social status etc. ) which are
known to influence the
outcome of the disease and if
not adequately matched for
comparability can distort or
confound the results.
23. Matching:
◦ Matching variables (e.g. age), and matching criteria (e.g. within
the same 5 year age group) must be set up in advance.
◦ Controls can be individually matched (most common) or
Frequency matched.
Individual matching (Matched pairs): search for
one (or more) controls who have the required
matching criteria, paired (triplet) matching is when
there is one (two) control (s) individually matched
to each cases.
Group matching (Frequency matching): select a
population of controls such that the overall
characteristics of the case, e.g. if 15% cases are
under age 20, 15% of the controls are also.
24. Matching:
◦ Avoid over-matching, match only on factors
KNOWN to be cause of the disease.
◦ Obtain POWER by matching MORE THAN ONE
CONTROL per case. In general, N of controls should
be ≤ 4, because there is no further gain of power
above that.
◦ Obtain Generalizability by matching more than one
type of control.
25. Matching: Problems –
◦ Overmatching: Matching on variables other than
those that are risk factors for the disease under study,
either in a planned manner or inadvertently.
Example: If we use neighborhood controls in a
study on nutrition and tuberculosis, we would be
inadvertently matching for socioeconomic status
and thus nutrition.
26. Information about the exposure should be obtained in
precisely the same manner for both cases and controls.
This may be obtained by the interviews, by
questionnaires, or by studying past records of cases
such as hospital records, employment records.
27. On analysis of case control study we find out
◦ Exposure rates: the frequency of exposure to suspected risk
factor in cases and in controls.
◦ Estimation of Risk:
◦ Relative Risk or Risk Ratio.
◦ Strength of association between risk factor and outcome:
(Odds ratio)
28. Exposure rates:
◦ A case control study provides a direct estimation of the exposure
rates (frequency of exposure) to the suspected factor in disease
and non-disease groups.
Doll R. and Hill AB. (1950) Brit. Med. J.
◦ Exposure rates
Cases = a/ (a + c) = 33/ 35 = 94.2%
Controls = b/ (b + d) = 55/82 = 67.0%
Cases
(lung cancer)
Controls
(without lung cancer)
Smokers 33 (a) 55 (b)
Non Smokers 2 (c) 27 (d)
TOTAL 35 (a + c) 82 (b+d)
29. Relative Risk or Risk Ratio (RR):
RR = Incidence among exposed
Incidence among non- exposed
= a/(a+b) ÷c/(c+d).
A typical Case Control Study does not
provide incidence rates from which RR
can be calculated directly.
There is no appropriate population or
denominator at risk.
In general RR can be exactly calculated
from a cohort study.
30. Odds Ratio.
◦ Odds: Odds of an event is defined as the ratio of the number of
ways an event can occur to the number of ways an event cannot
occur. (Epidemiology; Leon Gordis. 2004)
If the probability of event X occurring is P, then odds of it occurring
is = P/ 1-P.
◦ Odds ratio: Ratio of the odds that the cases were exposed to the
odds that the controls were exposed.
31. Odds ratio:
◦ Using the four-fold table –
Odds that case was exposed
◦ Odds ratio =
Odds that control was exposed
= (a/b)/ (c/d) = ad / bc
Diseased/ Cases Not diseased/
Controls
Exposed a b
Not exposed c d
32. Odds ratio ( = cross products ratio) can also be viewed
as the ratio of the product of the two cells that support the
hypothesis of an association (cells a & d – diseased people
who were exposed and non diseased people who were not
exposed), to the product of the two cells which negate the
hypothesis of an association (cells b & c – non diseased
people who were exposed and diseased people who were
not exposed).
33. Definition: Any systematic error in the design, conduct,
or analysis of a study that results in mistaken estimates
of the effect of the exposure on disease.
Types of bias in case control studies:
◦ Bias due to Confounding:
◦ Memory or Recall bias
◦ Selection bias
◦ Berkesonian bias
◦ Interviewer bias
34. Confounding: When a measure of the effect of an
exposure on risk is distorted because of the
association of exposure with other factors that
influence the outcome.
Not possible to separate the contribution that any
single causal factor has made
◦ Confounding Factor: is one which is associated with both
exposure & disease , and is distributed unequally in study &
control groups.
◦ E.g.: Alcohol & Esophageal Ca ; confounding factor- smoking
◦ Solution: Study design : Matching
Analysis: Stratification & Regression
35. Information Bias:
◦ Occurs due to -
1. Imperfect definitions of study variables
OR
2. Flawed data collection procedures.
◦ Leads to – Misclassification of disease and exposure.
◦ Types of Information bias –
Recall bias
Interviewer bias
36. Recall bias (usually in case-control studies): Cases who are
aware of their disease status may be more likely to recall
exposures than controls
e.g. congenital malformation with prenatal infections
Results in misclassification
Solution
• Achieving similarity in the procedures used to obtain
information from cases and controls
• Verify exposure with existing records
•Use of information recorded prior to the time of
diagnosis.
37. Some of the cases or controls who were actually exposed will be
erroneously classified as unexposed, and some who were actually not
exposed will be erroneously classified as exposed.—this generally results
in an underestimate of the true risk of the disease associated with the
exposure.
e.g. cervical cancer with sexual intercourse with uncircumcised men
Comparison of patients’ statements with examination findings concerning circumcision
status, Roswell Park Memorial Istitute, New York
Patients statement regarding circumcision
Examination
finding
Yes (no.) Yes(%) No (no.) No(%)
circumcised 37 66.1 47 34.6
not-
circumcised
19 33.9 89 65.4
Total 56 100.0 136 100.0
38. Interviewer bias: When interviewer is not blinded
(knows) case status of subjects there is potential
for interviewer bias.
◦ Leads to –
If interviewer knows case status – differential
misclassification likely.
If interviewer does not know case status – non
differential misclassification is still possible.
◦ Solution –
Blinding of interviewer as to case status
Equal interview time for all participants
39. Selection bias:
Arises when cases and control do not represent the
general population.
Prevention is the cure for this bias!!
Berkesonian bias:
Arises due to different rates of admission to hospitals for
patients with different diseases, i.E cases and controls.
40. Relatively easy to conduct.
Completed in less time and is inexpensive
Suitable for investigating rare diseases .
No risk to the subject as exposure and disease both
have occurred before the study.
Possible to study different causative factors.
(therefore their prevention and control strategy can be
planned)
No attrition problem as follow up is not required.
Minimal ethical problems.
41. Depends on records or memory, accuracy uncertain.
Validation of information difficult or impossible.
Difficult to get perfect control group.
Not possible to measure incidence or relative risk directly
Cannot distinguish between causes and associated factors.
Not appropriate for evaluation of a therapy or prophylaxis of
a disease.
42. OCP and Thromboembolic Disease
By Aug 1965, BRITISH COMMITTEE ON SAFETY OF
DRUGS received 249 reports of adverse reactions and 16 deaths
in women taking OCP’s .
Thus there was a need to conduct and epidemiological study.
A case control Study was conducted by Vassey and Doll in 1968.
Controls were matched for age, marital status, parity.
RR of users to non users were 6.3:1
Confirmation was established.
No. % who used OCP
Cases ( venous thrombosis
and pulmonary embolism)
84 50
Controls 168 14
43. Thalidomide Tragedy:
Thalidomide was first marketed as a safe, non-barbiturate
hypnotic in Britain in 1958.
In 1961 at a Gynaecological congress, it was discussed that a
large number of babies with congenital abnormalities were being
born (phocomelia) which was associated with thalidomide.
Case control study was carried out,
Confirmed that thalidomide was Teratogenic.
No. % who took
thalidomide
Cases( with congenital
defects)
46 41
Controls 300 0
44. Useful as a first step when searching for a cause of an
adverse health outcome.
Valuable when the disease being investigated is rare.
They have provided much of the current base of
knowledge in epidemiology.
45. Park’s Textbook of Preventive and Social Medicine –
23rd ed; Park JE. 2015.
Principles and Practice of Medical research-
2nd ed; J.V. Dixit. 2015
A Dictionary of Epidemiology – 3rd ed; Last JM. 2000.
Epidemiology – 5th ed; Gordis L.