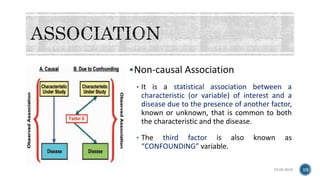
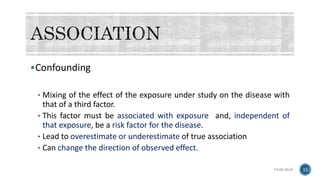
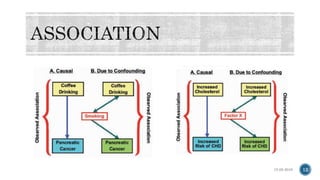
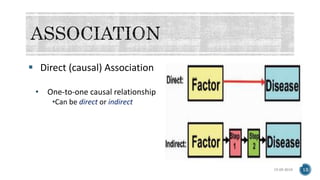
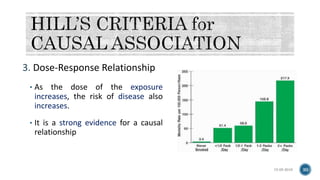
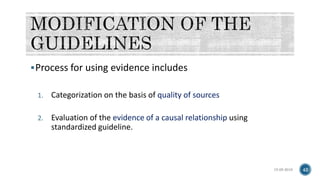
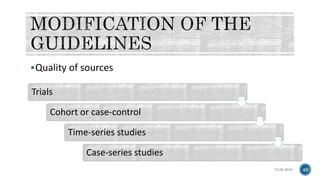
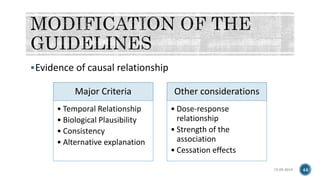
Dr. Aparna Sen Chaudhary
15-05-2018
1
 Association
 Association to Causation
 Cause and its strength
 Factors for disease causation
 Causal Relationship
 Evidence of causal relationship
 Modifications
 References
15-05-2018 2
Environmental
Exposure or Host
Characteristics
Disease or Other Health
Outcome
Disease or Other Health
Outcome
Environmental
Exposure or Host
Characteristics
Is an
Association
Observed
An
Association
is Observed
Is the Observed
Association
Causal?
15-05-2018 3
15-05-2018 4
Clinical Observations
Available Data
Case-control Studies
Cohort Studies
Randomized Trials
 Descriptive studies help in identification of disease problem in the
community, it endeavours an aetiological hypothesis.
 Analytical and experimental studies test the hypothesis derived.
 When the disease is multifactorial numerous factors become implicated
in the web of causation.
15-05-2018 5
 “ASSOCIATION” and “RELATIONSHIP” are often used interchangeably.
 Defined as –
 Statistical dependence between two variables, that is, the degree to which
the rate of disease in person with a specific exposure is either higher or
lower than the rate of disease among those without that exposure.
 It does not imply a causal relationship
15-05-2018 6
 “CORRELATION” indicates the degree of association between two
characteristics.
 Correlation coefficient range from -1.0 to +1.0.
 Cannot be used to invoke causation since temporal association cannot be
established.
 Does not measures risk
15-05-2018 7
 Association can be grouped under
a) Spurious (artefactual)association
b) Non-causal association
c) Causal association
15-05-2018 8
Spurious Association
• Association between a disease and suspected factor may not be real.
• Example -
oMore perinatal deaths in hospital delivery than home delivery.
oMore number of people dying from disease in places with more number
of doctors.
15-05-2018 9
Non-causal Association
• It is a statistical association between a
characteristic (or variable) of interest and a
disease due to the presence of another factor,
known or unknown, that is common to both
the characteristic and the disease.
• The third factor is also known as
“CONFOUNDING” variable.
15-05-2018 10
Confounding
• Mixing of the effect of the exposure under study on the disease with
that of a third factor.
• This factor must be associated with exposure and, independent of
that exposure, be a risk factor for the disease.
• Lead to overestimate or underestimate of true association
• Can change the direction of observed effect.
15-05-2018 11
15-05-2018 12
15-05-2018 13
 Direct (causal) Association
• One-to-one causal relationship
•Can be direct or indirect
 The following conditions have been met:
• Adequate Sample Size
• Free of Bias
• Adjusted for possible confounders
 There is an association between exposure of interest and the disease
outcome
 Is the association causal?
15-05-2018 14
15-05-2018 15
Statistical Association
Yes No
Likely Unlikely
Yes No
Cause
Bias in selection
or measurement
Chance
Confounding
Cause
 Cause of a specific disease event can be defined as
“an antecedent event, condition or characteristics that was necessary for the
occurrence of the disease at the moment it occurred, given that the other
conditions are fixed.”
15-05-2018 16
 The strength of a factor’s effect is usually measured by the change in
disease frequency produced.
 Can be measured in Absolute or Relative terms
 Strength depends on the Time-specific distribution of its causal
complements in the population.
 Over a period of time, the strength of the effect of a given factor may
change, because the prevalence of the causal complements may also
change. 15-05-2018 17
Sufficient Factors:
One which inevitably produces disease i.e., presence always result in
disease.
Ex- Rabies virus for rabies
Necessary Factors:
Without which disease does not occur, but by itself, not sufficient to
cause disease.
Ex- Mycobacterium TB for TB
15-05-2018 18
 A Causal Relationship can be defined as -
“ change in the Frequency or Quality of exposure or characteristics results in
a corresponding change in the Frequency of the disease or outcome of
interest.
15-05-2018 19
 Four types are possible:
I. Necessary and Sufficient One-to-one relationship
II. Necessary, but not Sufficient
III. Sufficient, but not Necessary
IV. Neither Sufficient nor Necessary
15-05-2018 20
Multifactorial relationship
Necessary & Sufficient
• Without that factor, the disease never develops (Necessary)
• In presence of that factor, the disease always develops (Sufficient)
• Rare situation
15-05-2018 21
Necessary, But Not Sufficient
• Each factor is necessary, but not, in itself
sufficient to cause disease.
• Often required in a specific sequence.
• Example - Carcinogenesis, Tuberculosis
15-05-2018 22
Sufficient, but not necessary
• Factors independently can produce the
disease.
• Examples- Radiation or Benzene exposure
can produce leukaemia.
• Although both factors are not needed,
other cofactors are probably needed.
15-05-2018 23
Neither Sufficient nor Necessary
• More complex model
• Most accurately represent the causal
relationship operating in CHRONIC
DISEASE.
15-05-2018 24
Henle-Koch’s Postulates (1884 and 1890)
Hill’s Criteria (1965)
15-05-2018 25
Henle-Koch’s Postulates (1884 and 1890)
• Organism is always found with the disease.
• Organism must be isolated from a diseased animal and grown in pure
culture.
• Cultured organism should cause disease when introduced into a
healthy animal.
• Organism must be re-isolated from the experimentally infected
animal.
15-05-2018 26
Guidelines for Assessing Causation (Hill’s Criteria, 1965)
1. Temporal Relationship
2. Strength of Association
3. Dose-Response Relationship
4. Replication of the findings
5. Biological Plausibility
6. Consideration of Alternate Explanations
7. Cessation of Exposure
8. Consistency with Other Knowledge
9. Specificity of the Association
15-05-2018 27
1. Temporal Relationship
• Most important criteria
• Exposure precedes disease development with
adequate elapsed time
oLatency period
oIncubation period
• Often easier to establish by Prospective cohort
study.
15-05-2018 28
2. Strength of the Association
• Measured by the relative risk (or odds ratio)
• Stronger the association, the more likely it is that the relation is
causal.
15-05-2018 29
3. Dose-Response Relationship
• As the dose of the exposure
increases, the risk of disease also
increases.
• It is a strong evidence for a causal
relationship
15-05-2018 30
4. Replication of Findings
• It is supportive if the same finding can be replicated in subgroups or
different populations and/or by using various study designs.
15-05-2018 31
5. Biological Plausibility
• Refers to knowledge of biological (or social) model or mechanism that
explains the cause-effect association.
• Epidemiologic studies often identify cause-effect relationships before
a biological mechanism is identified.
• Examples-
i. Teratogenic viruses and Rubella and congenital cataracts;
ii. Thalidomide and limb defects 15-05-2018 32
6. Consideration of Alternate Explanations.
• Take into account the extent to which the researchers has considered
alternative explanations for the outcome.
• Example - Confounding
15-05-2018 33
7. Cessation of Exposure
• The risk of disease to decline when
exposure to the factor is reduced or
eliminated.
• Ex- Reduction in Eosinophilia-myalgia
syndrome epidemic after withdrawal of L-
tryptophan in 1989.
• Cessation data if available provide helpful
supporting evidence for a causal
association.
15-05-2018 34
8. Consistency with Other Knowledge
• If a relationship is causal, the findings will
be consistent with the other data.
• Ex- Lung Cancer and Cigarette smoking in
men and women
• Absence of consistency would not
completely rule out the hypothesis.
15-05-2018 35
9. Specificity of the Association
• Association is specific when a certain exposure is associated with only
one disease.
• Weakest of all the guidelines
• When found, it provides additional support for a causal inference.
15-05-2018 36
1. TEMPORAL RELATIONSHIP
• H.pylori linked to chronic gastritis.
• In a study, 11% of the patients with duodenal
ulcers were positive for H.pylori.
2. STRENGTH OF ASSOCIATION
• H.pylori is found in at least 90% of patients with
duodenal ulcers.
15-05-2018 37
15-05-2018 38
3. DOSE-RESPONSE RELATIONSHIP
• Density of H.pylori per sq. mm of gastric mucosa
is higher in patients with duodenal ulcer.
4. REPLICATION OF THE FINDINGS
• Observations have been replicated.
15-05-2018 39
5. BIOLOGICAL PLAUSIBILITY
• H.pylori has binding sites on antral cells
• Induces mediators of inflammation
• Infected mucosa – susceptible to damaging
effects of acid.
15-05-2018 40
6. CONSIDERATION OF ALTERNATE
EXPLANATIONS
• Smoking can increase the risk of duodenal ulcer
in infected patients.
7. CESSATION OF EXPOSURE
• Eradication of H.pylori heals ulcers
• Long-term ulcer recurrence rates were zero after
triple-antimicrobial therapy.
15-05-2018 41
8. CONSISTENCY WITH OTHER KNOWLEDGE
• Prevalence is same in men and women
• Prevalence peaked in the latter part of the 19th
century.
9. SPECIFICITY OF THE ASSOCIATION
• Prevalence of H.pylori in patients with duodenal
ulcers is 90-100%.
Process for using evidence includes
1. Categorization on the basis of quality of sources
2. Evaluation of the evidence of a causal relationship using
standardized guideline.
15-05-2018 42
Quality of sources
15-05-2018 43
Trials
Cohort or case-control
Time-series studies
Case-series studies
Evidence of causal relationship
15-05-2018 44
Major Criteria
• Temporal Relationship
• Biological Plausibility
• Consistency
• Alternative explanation
Other considerations
• Dose-response
relationship
• Strength of the
association
• Cessation effects
 Gordis L. Epidemiology. 5th edition. Philadelphia. Elsevier. 2015.
 Park K. Park’s Textbook of Preventive and Social Medicine. 24th edition. Jabalpur, India.
Banarsidas Bhanot. 2017.
 Hennekens CH, Buring JE. Epidemiology in Medicine. Philadelphia. Lippincott Williams &
Wilkins. 1987.
 Kanchanaraksa S. Causal Association. Johns Hopkins Bloomberg School of Public Health. 2008.
 Rothman KJ, Greenland S. Causation and Causal Inference in Epidemiology. American Journal
of Public Health.2005;95:S144-50.
 Wakeford R. Association and causation in epidemiology- half a century since the publication
of Bradford Hill’s interpretational guidance. Journal of the Royal Society of
Medicine.2015;108(1):4-6.
15-05-2018 45
5/15/2018 46

Association and causation

  • 1.
    Dr. Aparna SenChaudhary 15-05-2018 1
  • 2.
     Association  Associationto Causation  Cause and its strength  Factors for disease causation  Causal Relationship  Evidence of causal relationship  Modifications  References 15-05-2018 2
  • 3.
    Environmental Exposure or Host Characteristics Diseaseor Other Health Outcome Disease or Other Health Outcome Environmental Exposure or Host Characteristics Is an Association Observed An Association is Observed Is the Observed Association Causal? 15-05-2018 3
  • 4.
    15-05-2018 4 Clinical Observations AvailableData Case-control Studies Cohort Studies Randomized Trials
  • 5.
     Descriptive studieshelp in identification of disease problem in the community, it endeavours an aetiological hypothesis.  Analytical and experimental studies test the hypothesis derived.  When the disease is multifactorial numerous factors become implicated in the web of causation. 15-05-2018 5
  • 6.
     “ASSOCIATION” and“RELATIONSHIP” are often used interchangeably.  Defined as –  Statistical dependence between two variables, that is, the degree to which the rate of disease in person with a specific exposure is either higher or lower than the rate of disease among those without that exposure.  It does not imply a causal relationship 15-05-2018 6
  • 7.
     “CORRELATION” indicatesthe degree of association between two characteristics.  Correlation coefficient range from -1.0 to +1.0.  Cannot be used to invoke causation since temporal association cannot be established.  Does not measures risk 15-05-2018 7
  • 8.
     Association canbe grouped under a) Spurious (artefactual)association b) Non-causal association c) Causal association 15-05-2018 8
  • 9.
    Spurious Association • Associationbetween a disease and suspected factor may not be real. • Example - oMore perinatal deaths in hospital delivery than home delivery. oMore number of people dying from disease in places with more number of doctors. 15-05-2018 9
  • 10.
    Non-causal Association • Itis a statistical association between a characteristic (or variable) of interest and a disease due to the presence of another factor, known or unknown, that is common to both the characteristic and the disease. • The third factor is also known as “CONFOUNDING” variable. 15-05-2018 10
  • 11.
    Confounding • Mixing ofthe effect of the exposure under study on the disease with that of a third factor. • This factor must be associated with exposure and, independent of that exposure, be a risk factor for the disease. • Lead to overestimate or underestimate of true association • Can change the direction of observed effect. 15-05-2018 11
  • 12.
  • 13.
    15-05-2018 13  Direct(causal) Association • One-to-one causal relationship •Can be direct or indirect
  • 14.
     The followingconditions have been met: • Adequate Sample Size • Free of Bias • Adjusted for possible confounders  There is an association between exposure of interest and the disease outcome  Is the association causal? 15-05-2018 14
  • 15.
    15-05-2018 15 Statistical Association YesNo Likely Unlikely Yes No Cause Bias in selection or measurement Chance Confounding Cause
  • 16.
     Cause ofa specific disease event can be defined as “an antecedent event, condition or characteristics that was necessary for the occurrence of the disease at the moment it occurred, given that the other conditions are fixed.” 15-05-2018 16
  • 17.
     The strengthof a factor’s effect is usually measured by the change in disease frequency produced.  Can be measured in Absolute or Relative terms  Strength depends on the Time-specific distribution of its causal complements in the population.  Over a period of time, the strength of the effect of a given factor may change, because the prevalence of the causal complements may also change. 15-05-2018 17
  • 18.
    Sufficient Factors: One whichinevitably produces disease i.e., presence always result in disease. Ex- Rabies virus for rabies Necessary Factors: Without which disease does not occur, but by itself, not sufficient to cause disease. Ex- Mycobacterium TB for TB 15-05-2018 18
  • 19.
     A CausalRelationship can be defined as - “ change in the Frequency or Quality of exposure or characteristics results in a corresponding change in the Frequency of the disease or outcome of interest. 15-05-2018 19
  • 20.
     Four typesare possible: I. Necessary and Sufficient One-to-one relationship II. Necessary, but not Sufficient III. Sufficient, but not Necessary IV. Neither Sufficient nor Necessary 15-05-2018 20 Multifactorial relationship
  • 21.
    Necessary & Sufficient •Without that factor, the disease never develops (Necessary) • In presence of that factor, the disease always develops (Sufficient) • Rare situation 15-05-2018 21
  • 22.
    Necessary, But NotSufficient • Each factor is necessary, but not, in itself sufficient to cause disease. • Often required in a specific sequence. • Example - Carcinogenesis, Tuberculosis 15-05-2018 22
  • 23.
    Sufficient, but notnecessary • Factors independently can produce the disease. • Examples- Radiation or Benzene exposure can produce leukaemia. • Although both factors are not needed, other cofactors are probably needed. 15-05-2018 23
  • 24.
    Neither Sufficient norNecessary • More complex model • Most accurately represent the causal relationship operating in CHRONIC DISEASE. 15-05-2018 24
  • 25.
    Henle-Koch’s Postulates (1884and 1890) Hill’s Criteria (1965) 15-05-2018 25
  • 26.
    Henle-Koch’s Postulates (1884and 1890) • Organism is always found with the disease. • Organism must be isolated from a diseased animal and grown in pure culture. • Cultured organism should cause disease when introduced into a healthy animal. • Organism must be re-isolated from the experimentally infected animal. 15-05-2018 26
  • 27.
    Guidelines for AssessingCausation (Hill’s Criteria, 1965) 1. Temporal Relationship 2. Strength of Association 3. Dose-Response Relationship 4. Replication of the findings 5. Biological Plausibility 6. Consideration of Alternate Explanations 7. Cessation of Exposure 8. Consistency with Other Knowledge 9. Specificity of the Association 15-05-2018 27
  • 28.
    1. Temporal Relationship •Most important criteria • Exposure precedes disease development with adequate elapsed time oLatency period oIncubation period • Often easier to establish by Prospective cohort study. 15-05-2018 28
  • 29.
    2. Strength ofthe Association • Measured by the relative risk (or odds ratio) • Stronger the association, the more likely it is that the relation is causal. 15-05-2018 29
  • 30.
    3. Dose-Response Relationship •As the dose of the exposure increases, the risk of disease also increases. • It is a strong evidence for a causal relationship 15-05-2018 30
  • 31.
    4. Replication ofFindings • It is supportive if the same finding can be replicated in subgroups or different populations and/or by using various study designs. 15-05-2018 31
  • 32.
    5. Biological Plausibility •Refers to knowledge of biological (or social) model or mechanism that explains the cause-effect association. • Epidemiologic studies often identify cause-effect relationships before a biological mechanism is identified. • Examples- i. Teratogenic viruses and Rubella and congenital cataracts; ii. Thalidomide and limb defects 15-05-2018 32
  • 33.
    6. Consideration ofAlternate Explanations. • Take into account the extent to which the researchers has considered alternative explanations for the outcome. • Example - Confounding 15-05-2018 33
  • 34.
    7. Cessation ofExposure • The risk of disease to decline when exposure to the factor is reduced or eliminated. • Ex- Reduction in Eosinophilia-myalgia syndrome epidemic after withdrawal of L- tryptophan in 1989. • Cessation data if available provide helpful supporting evidence for a causal association. 15-05-2018 34
  • 35.
    8. Consistency withOther Knowledge • If a relationship is causal, the findings will be consistent with the other data. • Ex- Lung Cancer and Cigarette smoking in men and women • Absence of consistency would not completely rule out the hypothesis. 15-05-2018 35
  • 36.
    9. Specificity ofthe Association • Association is specific when a certain exposure is associated with only one disease. • Weakest of all the guidelines • When found, it provides additional support for a causal inference. 15-05-2018 36
  • 37.
    1. TEMPORAL RELATIONSHIP •H.pylori linked to chronic gastritis. • In a study, 11% of the patients with duodenal ulcers were positive for H.pylori. 2. STRENGTH OF ASSOCIATION • H.pylori is found in at least 90% of patients with duodenal ulcers. 15-05-2018 37
  • 38.
    15-05-2018 38 3. DOSE-RESPONSERELATIONSHIP • Density of H.pylori per sq. mm of gastric mucosa is higher in patients with duodenal ulcer. 4. REPLICATION OF THE FINDINGS • Observations have been replicated.
  • 39.
    15-05-2018 39 5. BIOLOGICALPLAUSIBILITY • H.pylori has binding sites on antral cells • Induces mediators of inflammation • Infected mucosa – susceptible to damaging effects of acid.
  • 40.
    15-05-2018 40 6. CONSIDERATIONOF ALTERNATE EXPLANATIONS • Smoking can increase the risk of duodenal ulcer in infected patients. 7. CESSATION OF EXPOSURE • Eradication of H.pylori heals ulcers • Long-term ulcer recurrence rates were zero after triple-antimicrobial therapy.
  • 41.
    15-05-2018 41 8. CONSISTENCYWITH OTHER KNOWLEDGE • Prevalence is same in men and women • Prevalence peaked in the latter part of the 19th century. 9. SPECIFICITY OF THE ASSOCIATION • Prevalence of H.pylori in patients with duodenal ulcers is 90-100%.
  • 42.
    Process for usingevidence includes 1. Categorization on the basis of quality of sources 2. Evaluation of the evidence of a causal relationship using standardized guideline. 15-05-2018 42
  • 43.
    Quality of sources 15-05-201843 Trials Cohort or case-control Time-series studies Case-series studies
  • 44.
    Evidence of causalrelationship 15-05-2018 44 Major Criteria • Temporal Relationship • Biological Plausibility • Consistency • Alternative explanation Other considerations • Dose-response relationship • Strength of the association • Cessation effects
  • 45.
     Gordis L.Epidemiology. 5th edition. Philadelphia. Elsevier. 2015.  Park K. Park’s Textbook of Preventive and Social Medicine. 24th edition. Jabalpur, India. Banarsidas Bhanot. 2017.  Hennekens CH, Buring JE. Epidemiology in Medicine. Philadelphia. Lippincott Williams & Wilkins. 1987.  Kanchanaraksa S. Causal Association. Johns Hopkins Bloomberg School of Public Health. 2008.  Rothman KJ, Greenland S. Causation and Causal Inference in Epidemiology. American Journal of Public Health.2005;95:S144-50.  Wakeford R. Association and causation in epidemiology- half a century since the publication of Bradford Hill’s interpretational guidance. Journal of the Royal Society of Medicine.2015;108(1):4-6. 15-05-2018 45
  • 46.

Editor's Notes

  • #28 Temporal Relationship, Strength of Association Consistency with Other Knowledge Biologic Plausibility Dose-Response Relationship