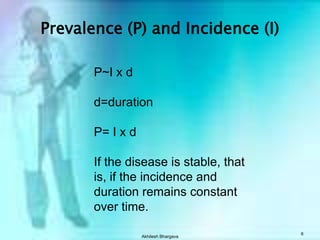
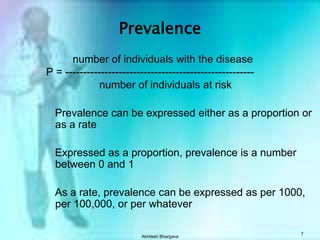
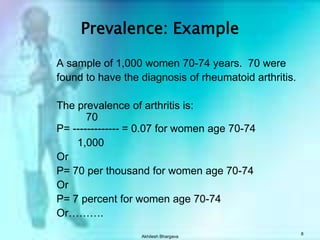
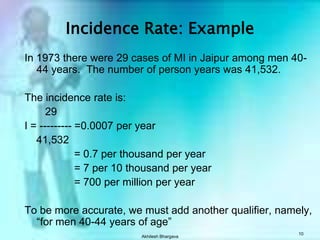
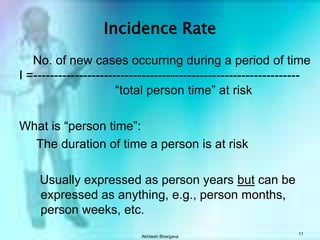
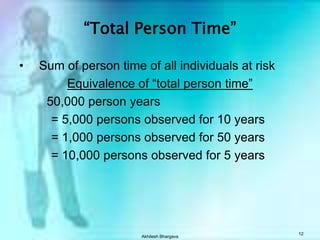
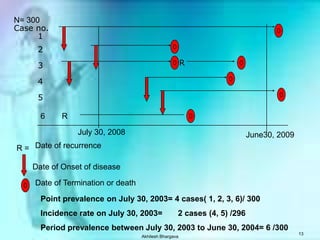
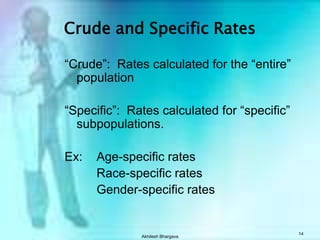
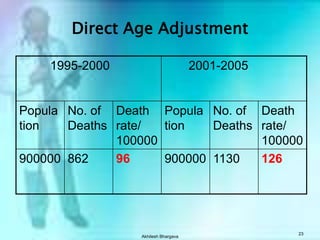
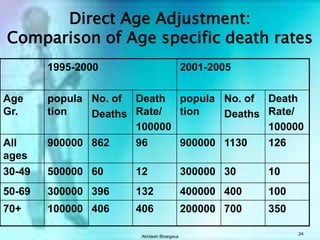
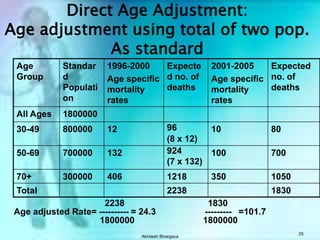
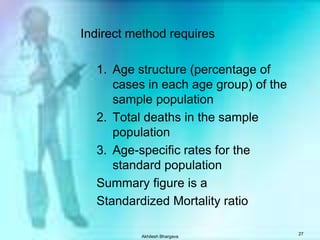
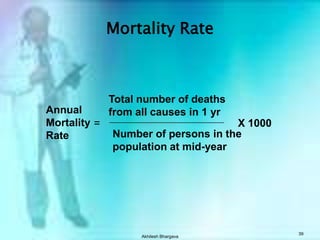
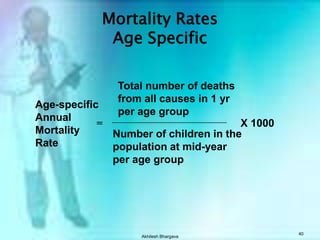
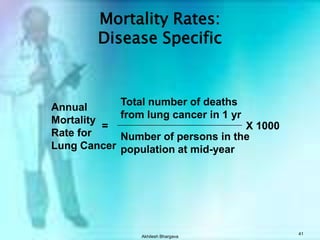
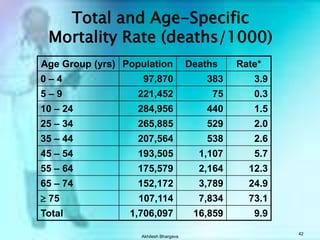
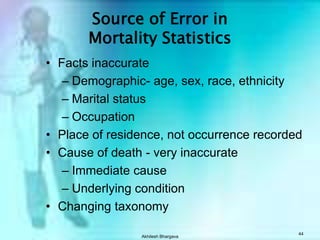
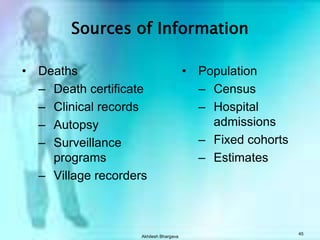
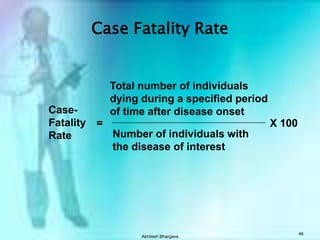
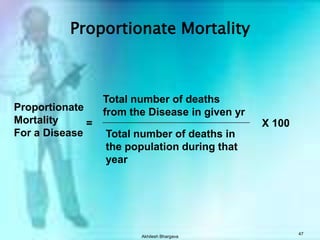
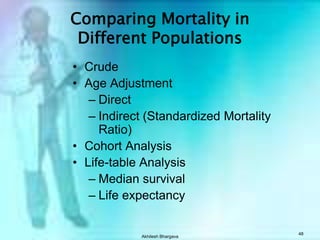
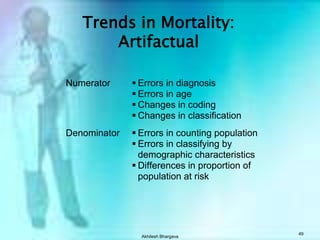
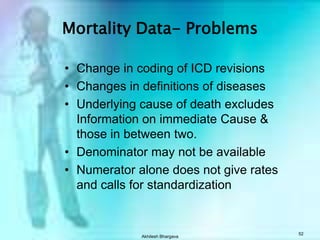
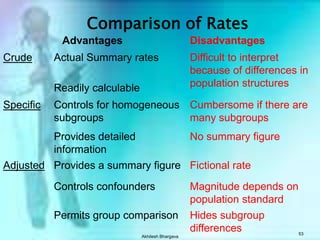
The document discusses various measures used to quantify disease occurrence and mortality rates. It defines key terms like prevalence, incidence, rates, ratios and standardized rates. Prevalence is a snapshot of disease at a point in time while incidence describes new cases occurring over time. Crude rates are calculated for the entire population while specific rates are for subpopulations. Standardized rates allow comparison between populations by adjusting for differences in age or other distributions. Methods like direct and indirect standardization are used to derive adjusted rates. Mortality data from vital statistics provides important public health indicators but has issues like accuracy of documentation and changing disease classifications over time.
An overview of a key statistical technique in epidemiology – standardization - is introduced. The process and application of both direct and indirect standardization in improving the validity of comparisons between populations are described.
Standardization of rates by Dr. Basil TumainiBasil Tumaini
Standardization of rates by Dr. Basil Tumaini, presented during the residency at Muhimbili University of Health and Allied Sciences, Epidemiology class
Introduction to Epidemiology
History of Epidemiology.
Definition of Epidemiology and its components.
Epidemiological Basic concepts.
Aims of Epidemiology.
Ten Uses of Epidemiology.
Scope or The Areas of Application .
Types of Epidemiological Studies.
This lecture looks specifically at measures of disease frequency: morbidity and mortality. You will see how morbidity data can be used, how routinely collected mortality data can begin to throw light on very important issues that might determine health. You will review the sources of important, routinely collected population data in Malaysia: demographic data (e.g., population census) and health event data (e.g., mortality, hospital and general practice data).
tHESE SLIDES ARE PREPAREED TO UNDERSTAND about DISPOSAL OF WASTE IN EASY WAY Important links- NOTES- https://mynursingstudents.blogspot.com/ youtube channel https://www.youtube.com/c/MYSTUDENTSU... CHANEL PLAYLIST- ANATOMY AND PHYSIOLOGY-https://www.youtube.com/playlist?list=PL93S13oM2gAPM3VTGVUXIeswKJ3XGaD2p COMMUNITY HEALTH NURSING- https://www.youtube.com/playlist?list=PL93S13oM2gAPyslPNdIJoVjiXEDTVEDzs CHILD HEALTH NURSING- https://www.youtube.com/playlist?list=PL93S13oM2gANcslmv0DXg6BWmWN359Gvg FIRST AID- https://www.youtube.com/playlist?list=PL93S13oM2gAMvGqeqH2ZTklzFAZhOrvgP HCM- https://www.youtube.com/playlist?list=PL93S13oM2gAM7mZ1vZhQBHWbdLnLb-cH9 FUNDAMENTALS OF NURSING- https://www.youtube.com/playlist?list=PL93S13oM2gAPFxu78NDLpGPaxEmK1fTao COMMUNICABLE DISEASES- https://www.youtube.com/playlist?list=PL93S13oM2gAOWo4IwNjLU_LCuhRN0ZLeb ENVIRONMENTAL HEALTH- https://www.youtube.com/playlist?list=PL93S13oM2gAPkI6LvfS8Zu1nm6mZi9FK6 MSN- https://www.youtube.com/playlist?list=PL93S13oM2gAOdyoHnDLAoR_o8M6ccqYBm HINDI ONLY- https://www.youtube.com/playlist?list=PL93S13oM2gAN4L-FJ3s_IEXgZCijGUA1A ENGLISH ONLY- https://www.youtube.com/playlist?list=PL93S13oM2gAMYv2a1hFcq4W1nBjTnRkHP facebook profile- https://www.facebook.com/suresh.kr.lrhs/ FACEBOOK PAGE- https://www.facebook.com/My-Student-S... facebook group NURSING NOTES- https://www.facebook.com/groups/24139... FOR MAKING EASY NOTES YOU CAN ALSO VISIT MY BLOG – BLOGGER- https://mynursingstudents.blogspot.com/ Instagram- https://www.instagram.com/mystudentsu... Twitter- https://twitter.com/student_system?s=08 #PEM, #ASHA,#EPIDEMIOLOGY,#ICDS,#nurses,#ASSESSMENT, #APPEARENCE,#PULSE,#GRIMACE,#REFLEX,#RESPIRATION,#RESUSCITATION,#NEWBORN,#BABY,#VIRGINIA, #CHILD, #OXYGEN,#CYANOSIS,#OPTICNERVE, #SARACHNA,#MYSTUDENTSUPPORTSYSTEM, #rashes,#nursingclasses, #communityhealthnursing,#ANM, #GNM, #BSCNURING,#NURSINGSTUDENTS, #WHO,#NURSINGINSTITUTION,#COLLEGEOFNURSING,#nursingofficer,#COMMUNITYHEALTHOFFICE
This ppt contains all information about Health statistics-Vital Statistics. It is useful for students of medical field learning preventive and social medicine, Swasthavritta (Ayurved), nursing and everyone who is interested in knowing about it.
Chapter 3Measures of Morbidity and Mortality Used in EpidemiolEstelaJeffery653
Chapter 3
Measures of Morbidity and Mortality Used in Epidemiology
Learning Objectives
Define and distinguish among ratios, proportions, and rates
Explain the term population at risk
Identify and calculate commonly used rates for morbidity, mortality, and natality
State the meanings and applications of incidence rates and prevalence
Learning Objectives (cont’d)
Discuss limitations of crude rates and alternative measures for crude rates
Apply direct and indirect methods to adjust rates
List situations where direct and indirect adjustment should be used
Overview of Epidemiologic Measures
Count
The simplest and most frequently performed quantitative measure in epidemiology.
Refers to the number of cases of a disease or other health phenomenon being studied.
Examples of Counts
Cases of influenza reported in Westchester County, New York, during January of a particular year.
Traffic fatalities in Manhattan in a 24-hour time period
College dorm students who had mono
Foreign-born stomach cancer patients
Ratio
The value obtained by dividing one quantity by another.
Consists of a numerator and a denominator.
The most general form has no specified relationship between numerator and denominator.
Rates, proportions, and percentages are also ratios.
Example of a
Simple Sex Ratio Calculation
A ratio may be expressed at = X/Y
Simple sex ratio (data from textbook)
Of 1,000 motorcycle fatalities, 950 victims are men and 50 are women.
Number of male cases 950
Number of female cases 50
19:1 male to female
=
=
Example of a
Demographic Sex Ratio Calculation
This ratio refers to the number of males per 100 females. In the U.S., the sex ratio in 2010 for the entire population was 96.7, indicating more females than males.
Number of male cases 151,781,326
Number of female cases 156,964,212
96.7
X 100 =
=
X 100
Example of a
Sex Ratio at Birth Calculation
The sex ratio at birth is defined as: (the number of male births divided by the number of female births) multiplied by 1,000.
Number of male births
Number of female births
X 1,000
Definition of Proportion
A measure that states a count relative to the size of the group.
A ratio in which the numerator is part of the denominator.
May be expressed as a percentage.
Uses of Proportions
Can demonstrate the magnitude of a problem.
Example: 10 dormitory students develop hepatitis. How important is this problem?
If only 20 students live in the dorm, 50% are ill.
If 500 students live in the dorm, 2% are ill.
Example of a Proportion
Calculate the proportion of African-American male deaths among African-American and white boys aged 5 to 14 years.
Rate
Definition: a ratio that consists of a numerator and a denominator and in which time forms part of the denominator.
Contains the following elements:
disease frequency
unit size of population
time period during which an event occurs
Crude death rate =
Number of deaths in a given y ...
Frequency measures of health is an important aspect in the planing of the type of services required in a specific population. This is due to the fact that they are able to indicate the type and level of health problems being faced In that population during a specified period of time.
Flu Vaccine Alert in Bangalore Karnatakaaddon Scans
As flu season approaches, health officials in Bangalore, Karnataka, are urging residents to get their flu vaccinations. The seasonal flu, while common, can lead to severe health complications, particularly for vulnerable populations such as young children, the elderly, and those with underlying health conditions.
Dr. Vidisha Kumari, a leading epidemiologist in Bangalore, emphasizes the importance of getting vaccinated. "The flu vaccine is our best defense against the influenza virus. It not only protects individuals but also helps prevent the spread of the virus in our communities," he says.
This year, the flu season is expected to coincide with a potential increase in other respiratory illnesses. The Karnataka Health Department has launched an awareness campaign highlighting the significance of flu vaccinations. They have set up multiple vaccination centers across Bangalore, making it convenient for residents to receive their shots.
To encourage widespread vaccination, the government is also collaborating with local schools, workplaces, and community centers to facilitate vaccination drives. Special attention is being given to ensuring that the vaccine is accessible to all, including marginalized communities who may have limited access to healthcare.
Residents are reminded that the flu vaccine is safe and effective. Common side effects are mild and may include soreness at the injection site, mild fever, or muscle aches. These side effects are generally short-lived and far less severe than the flu itself.
Healthcare providers are also stressing the importance of continuing COVID-19 precautions. Wearing masks, practicing good hand hygiene, and maintaining social distancing are still crucial, especially in crowded places.
Protect yourself and your loved ones by getting vaccinated. Together, we can help keep Bangalore healthy and safe this flu season. For more information on vaccination centers and schedules, residents can visit the Karnataka Health Department’s official website or follow their social media pages.
Stay informed, stay safe, and get your flu shot today!
Lung Cancer: Artificial Intelligence, Synergetics, Complex System Analysis, S...Oleg Kshivets
RESULTS: Overall life span (LS) was 2252.1±1742.5 days and cumulative 5-year survival (5YS) reached 73.2%, 10 years – 64.8%, 20 years – 42.5%. 513 LCP lived more than 5 years (LS=3124.6±1525.6 days), 148 LCP – more than 10 years (LS=5054.4±1504.1 days).199 LCP died because of LC (LS=562.7±374.5 days). 5YS of LCP after bi/lobectomies was significantly superior in comparison with LCP after pneumonectomies (78.1% vs.63.7%, P=0.00001 by log-rank test). AT significantly improved 5YS (66.3% vs. 34.8%) (P=0.00000 by log-rank test) only for LCP with N1-2. Cox modeling displayed that 5YS of LCP significantly depended on: phase transition (PT) early-invasive LC in terms of synergetics, PT N0—N12, cell ratio factors (ratio between cancer cells- CC and blood cells subpopulations), G1-3, histology, glucose, AT, blood cell circuit, prothrombin index, heparin tolerance, recalcification time (P=0.000-0.038). Neural networks, genetic algorithm selection and bootstrap simulation revealed relationships between 5YS and PT early-invasive LC (rank=1), PT N0—N12 (rank=2), thrombocytes/CC (3), erythrocytes/CC (4), eosinophils/CC (5), healthy cells/CC (6), lymphocytes/CC (7), segmented neutrophils/CC (8), stick neutrophils/CC (9), monocytes/CC (10); leucocytes/CC (11). Correct prediction of 5YS was 100% by neural networks computing (area under ROC curve=1.0; error=0.0).
CONCLUSIONS: 5YS of LCP after radical procedures significantly depended on: 1) PT early-invasive cancer; 2) PT N0--N12; 3) cell ratio factors; 4) blood cell circuit; 5) biochemical factors; 6) hemostasis system; 7) AT; 8) LC characteristics; 9) LC cell dynamics; 10) surgery type: lobectomy/pneumonectomy; 11) anthropometric data. Optimal diagnosis and treatment strategies for LC are: 1) screening and early detection of LC; 2) availability of experienced thoracic surgeons because of complexity of radical procedures; 3) aggressive en block surgery and adequate lymph node dissection for completeness; 4) precise prediction; 5) adjuvant chemoimmunoradiotherapy for LCP with unfavorable prognosis.
The prostate is an exocrine gland of the male mammalian reproductive system
It is a walnut-sized gland that forms part of the male reproductive system and is located in front of the rectum and just below the urinary bladder
Function is to store and secrete a clear, slightly alkaline fluid that constitutes 10-30% of the volume of the seminal fluid that along with the spermatozoa, constitutes semen
A healthy human prostate measures (4cm-vertical, by 3cm-horizontal, 2cm ant-post ).
It surrounds the urethra just below the urinary bladder. It has anterior, median, posterior and two lateral lobes
It’s work is regulated by androgens which are responsible for male sex characteristics
Generalised disease of the prostate due to hormonal derangement which leads to non malignant enlargement of the gland (increase in the number of epithelial cells and stromal tissue)to cause compression of the urethra leading to symptoms (LUTS
Ethanol (CH3CH2OH), or beverage alcohol, is a two-carbon alcohol
that is rapidly distributed in the body and brain. Ethanol alters many
neurochemical systems and has rewarding and addictive properties. It
is the oldest recreational drug and likely contributes to more morbidity,
mortality, and public health costs than all illicit drugs combined. The
5th edition of the Diagnostic and Statistical Manual of Mental Disorders
(DSM-5) integrates alcohol abuse and alcohol dependence into a single
disorder called alcohol use disorder (AUD), with mild, moderate,
and severe subclassifications (American Psychiatric Association, 2013).
In the DSM-5, all types of substance abuse and dependence have been
combined into a single substance use disorder (SUD) on a continuum
from mild to severe. A diagnosis of AUD requires that at least two of
the 11 DSM-5 behaviors be present within a 12-month period (mild
AUD: 2–3 criteria; moderate AUD: 4–5 criteria; severe AUD: 6–11 criteria).
The four main behavioral effects of AUD are impaired control over
drinking, negative social consequences, risky use, and altered physiological
effects (tolerance, withdrawal). This chapter presents an overview
of the prevalence and harmful consequences of AUD in the U.S.,
the systemic nature of the disease, neurocircuitry and stages of AUD,
comorbidities, fetal alcohol spectrum disorders, genetic risk factors, and
pharmacotherapies for AUD.
Anti ulcer drugs and their Advance pharmacology ||
Anti-ulcer drugs are medications used to prevent and treat ulcers in the stomach and upper part of the small intestine (duodenal ulcers). These ulcers are often caused by an imbalance between stomach acid and the mucosal lining, which protects the stomach lining.
||Scope: Overview of various classes of anti-ulcer drugs, their mechanisms of action, indications, side effects, and clinical considerations.
Tom Selleck Health: A Comprehensive Look at the Iconic Actor’s Wellness Journeygreendigital
Tom Selleck, an enduring figure in Hollywood. has captivated audiences for decades with his rugged charm, iconic moustache. and memorable roles in television and film. From his breakout role as Thomas Magnum in Magnum P.I. to his current portrayal of Frank Reagan in Blue Bloods. Selleck's career has spanned over 50 years. But beyond his professional achievements. fans have often been curious about Tom Selleck Health. especially as he has aged in the public eye.
Follow us on: Pinterest
Introduction
Many have been interested in Tom Selleck health. not only because of his enduring presence on screen but also because of the challenges. and lifestyle choices he has faced and made over the years. This article delves into the various aspects of Tom Selleck health. exploring his fitness regimen, diet, mental health. and the challenges he has encountered as he ages. We'll look at how he maintains his well-being. the health issues he has faced, and his approach to ageing .
Early Life and Career
Childhood and Athletic Beginnings
Tom Selleck was born on January 29, 1945, in Detroit, Michigan, and grew up in Sherman Oaks, California. From an early age, he was involved in sports, particularly basketball. which played a significant role in his physical development. His athletic pursuits continued into college. where he attended the University of Southern California (USC) on a basketball scholarship. This early involvement in sports laid a strong foundation for his physical health and disciplined lifestyle.
Transition to Acting
Selleck's transition from an athlete to an actor came with its physical demands. His first significant role in "Magnum P.I." required him to perform various stunts and maintain a fit appearance. This role, which he played from 1980 to 1988. necessitated a rigorous fitness routine to meet the show's demands. setting the stage for his long-term commitment to health and wellness.
Fitness Regimen
Workout Routine
Tom Selleck health and fitness regimen has evolved. adapting to his changing roles and age. During his "Magnum, P.I." days. Selleck's workouts were intense and focused on building and maintaining muscle mass. His routine included weightlifting, cardiovascular exercises. and specific training for the stunts he performed on the show.
Selleck adjusted his fitness routine as he aged to suit his body's needs. Today, his workouts focus on maintaining flexibility, strength, and cardiovascular health. He incorporates low-impact exercises such as swimming, walking, and light weightlifting. This balanced approach helps him stay fit without putting undue strain on his joints and muscles.
Importance of Flexibility and Mobility
In recent years, Selleck has emphasized the importance of flexibility and mobility in his fitness regimen. Understanding the natural decline in muscle mass and joint flexibility with age. he includes stretching and yoga in his routine. These practices help prevent injuries, improve posture, and maintain mobilit
HOT NEW PRODUCT! BIG SALES FAST SHIPPING NOW FROM CHINA!! EU KU DB BK substit...GL Anaacs
Contact us if you are interested:
Email / Skype : kefaya1771@gmail.com
Threema: PXHY5PDH
New BATCH Ku !!! MUCH IN DEMAND FAST SALE EVERY BATCH HAPPY GOOD EFFECT BIG BATCH !
Contact me on Threema or skype to start big business!!
Hot-sale products:
NEW HOT EUTYLONE WHITE CRYSTAL!!
5cl-adba precursor (semi finished )
5cl-adba raw materials
ADBB precursor (semi finished )
ADBB raw materials
APVP powder
5fadb/4f-adb
Jwh018 / Jwh210
Eutylone crystal
Protonitazene (hydrochloride) CAS: 119276-01-6
Flubrotizolam CAS: 57801-95-3
Metonitazene CAS: 14680-51-4
Payment terms: Western Union,MoneyGram,Bitcoin or USDT.
Deliver Time: Usually 7-15days
Shipping method: FedEx, TNT, DHL,UPS etc.Our deliveries are 100% safe, fast, reliable and discreet.
Samples will be sent for your evaluation!If you are interested in, please contact me, let's talk details.
We specializes in exporting high quality Research chemical, medical intermediate, Pharmaceutical chemicals and so on. Products are exported to USA, Canada, France, Korea, Japan,Russia, Southeast Asia and other countries.
1. Measures of Morbidity and Mortality Akhilesh Bhargava MD, DHA, PGDHRM Professor-Community Medicine & Director-SIHFW, Jaipur
2. Akhilesh Bhargava 2 The fundamental task in epidemiologic research is to quantify the occurrence of illness The goal is to evaluate causation of illness by relating disease occurrence to characteristics of people and their environment Rates, Ratios, and Standardized Rates are primary tools for quantifying occurrence of illness
3. Akhilesh Bhargava 3 What is a rate? “a measure of speed with which events are occurring in a population in a specified time period.” Essentials A numerator A denominator that “appropriately” relates the numerator to population at risk A “unit” such as per 1000, per 100,000 or per million
5. Akhilesh Bhargava 5 Prevalence VS. Incidence Prevalence: A “snapshot” of disease at a point in time in a population Relevant for planning of health services Incidence: A description of how new cases of disease are occurring. “force of morbidity” “rate of flow” of cases from non disease to disease state Relevant for exploring causal theories
6. Akhilesh Bhargava 6 Prevalence (P) and Incidence (I) P~I x d d=duration P= I x d If the disease is stable, that is, if the incidence and duration remains constant over time.
7. Akhilesh Bhargava 7 Prevalence number of individuals with the disease P = ----------------------------------------------------- number of individuals at risk Prevalence can be expressed either as a proportion or as a rate Expressed as a proportion, prevalence is a number between 0 and 1 As a rate, prevalence can be expressed as per 1000, per 100,000, or per whatever
8. Akhilesh Bhargava 8 Prevalence: Example A sample of 1,000 women 70-74 years. 70 were found to have the diagnosis of rheumatoid arthritis. The prevalence of arthritis is: 70 P= ------------- = 0.07 for women age 70-74 1,000 Or P= 70 per thousand for women age 70-74 Or P= 7 percent for women age 70-74 Or……….
9. Akhilesh Bhargava 9 Prevalence Choice of scale of rate usually depends on the ubiquity of the disease. Thus, more common disease prevalence may be presented as percentage Rare disease prevalence may be presented as per 100,000 or per million
10. Akhilesh Bhargava 10 Incidence Rate: Example In 1973 there were 29 cases of MI in Jaipur among men 40-44 years. The number of person years was 41,532. The incidence rate is: 29 I = --------- =0.0007 per year 41,532 = 0.7 per thousand per year = 7 per 10 thousand per year = 700 per million per year To be more accurate, we must add another qualifier, namely, “for men 40-44 years of age”
11. Akhilesh Bhargava 11 Incidence Rate No. of new cases occurring during a period of time I =---------------------------------------------------------------- “total person time” at risk What is “person time”: The duration of time a person is at risk Usually expressed as person years but can be expressed as anything, e.g., person months, person weeks, etc.
12. Akhilesh Bhargava 12 “Total Person Time” Sum of person time of all individuals at risk Equivalence of “total person time” 50,000 person years = 5,000 persons observed for 10 years = 1,000 persons observed for 50 years = 10,000 persons observed for 5 years
13. Akhilesh Bhargava 13 N= 300 Case no. 1 2 R 3 4 5 R 6 July 30, 2008 June30, 2009 Date of recurrence R = Date of Onset of disease Date of Termination or death Point prevalence on July 30, 2003= 4 cases( 1, 2, 3, 6)/ 300 Incidence rate on July 30, 2003= 2 cases (4, 5) /296 Period prevalence between July 30, 2003 to June 30, 2004= 6 /300
14. Akhilesh Bhargava 14 Crude and Specific Rates “Crude”: Rates calculated for the “entire” population “Specific”: Rates calculated for “specific” subpopulations. Ex: Age-specific rates Race-specific rates Gender-specific rates
15. Akhilesh Bhargava 15 Comparing Apples with Apples In comparing populations (groups) one should recognize that populations (groups) can differ in two important respects: Subpopulation-specific rates Distribution of subpopulations
16.
17. Population A has higher crude death rate for large aged pop.
18.
19. Akhilesh Bhargava 18 Adjusted Rates are Created Through Standardization Standardization: The process by which you derive a summary figure to compare health outcomes of groups The process can be used for mortality, natality, or morbidity data .
20. Akhilesh Bhargava 19 Direct Adjustment Rates of populations to be compared applied to the standard population The question: What would be the number of events (deaths, births, etc.) in the standard population if events were happening at the category-specific rates in each population?
21. Akhilesh Bhargava 20 Example: Age-Adjustment Direct Method requires - Age-specific rates in the sample population The age of each case The population-at-risk for each age group in the sample Age structure (percentage of cases in each age group) of a standard population Summary figure is an Age-adjusted rate
26. Akhilesh Bhargava 24 Direct Age Adjustment:Comparison of Age specific death rates
27. Akhilesh Bhargava 25 Direct Age Adjustment:Age adjustment using total of two pop. As standard 22381830 Age adjusted Rate= ---------- = 24.3 --------- =101.7 1800000 1800000
28. Akhilesh Bhargava 26 Indirect Adjustment Rates of standard population applied to populations to be compared. The question: What would be the number of events (deaths, births, etc.) if the particular population was having events at the same category specific rates as the standard population?
29. Akhilesh Bhargava 27 Indirect method requires Age structure (percentage of cases in each age group) of the sample population Total deaths in the sample population Age-specific rates for the standard population Summary figure is a Standardized Mortality ratio
34. Akhilesh Bhargava 33 Indicators of Public Health Mortality statistics Age specific mortality rates Disease specific mortality rates Case-fatality Life Expectancy Maternal mortality rates Infant mortality rates Morbidity statistics Fertility rates Vaccination coverage Health care utilization Health status indicators
35. Akhilesh Bhargava 34 Vital Statistics Systems for collecting vital statistics Civil registration system Advocated by the United Nations Present in industrialized countries Costly to develop and maintain Alternative methods Probability area samples Purposeful area samples Records-based surveys
36. Akhilesh Bhargava 35 Vital Statistics Priority in Vital Statistics Collection – based on UN criteria Births and deaths Marriages Divorces Fetal deaths Annulments Judicial separations adoptions
38. Akhilesh Bhargava 37 Vital Statistics History U.S. census every 10 years since 1790 Mid-point census since 1976 Census Latin – to estimate or assess Enumerating the number of people in a given population Age, sex, race, household relationships, marital status, number of rooms in house, length of time in residence, rental or ownership, value of home Sampling strategies for difficult to reach populations
39. Akhilesh Bhargava 38 Mortality Data Comprehensive Measure of community health Track trends over time by region Proportionate mortality Infant death Applies to men and women Cohort analysis Standardization for comparison across populations Demography
40. Akhilesh Bhargava 39 Mortality Rate Total number of deaths from all causes in 1 yr Annual Mortality Rate = X 1000 Number of persons in the population at mid-year
41. Akhilesh Bhargava 40 Mortality RatesAge Specific Total number of deaths from all causes in 1 yr per age group Age-specific Annual Mortality Rate = X 1000 Number of children in the population at mid-year per age group
42. Akhilesh Bhargava 41 Mortality Rates:Disease Specific Total number of deaths from lung cancer in 1 yr Annual Mortality Rate for Lung Cancer = X 1000 Number of persons in the population at mid-year
44. Akhilesh Bhargava 43 Infant Mortality Rate Number of deaths in a year of live-born infants less than 1 year of age IMR = Number of live births in the same year X 1000
45. Akhilesh Bhargava 44 Source of Error in Mortality Statistics Facts inaccurate Demographic- age, sex, race, ethnicity Marital status Occupation Place of residence, not occurrence recorded Cause of death - very inaccurate Immediate cause Underlying condition Changing taxonomy
46. Akhilesh Bhargava 45 Sources of Information Deaths Death certificate Clinical records Autopsy Surveillance programs Village recorders Population Census Hospital admissions Fixed cohorts Estimates
47. Akhilesh Bhargava 46 Case Fatality Rate Total number of individuals dying during a specified period of time after disease onset Case- Fatality Rate = X 100 Number of individuals with the disease of interest
48. Akhilesh Bhargava 47 Proportionate Mortality Total number of deaths from the Disease in given yr Proportionate Mortality For a Disease = X 100 Total number of deaths in the population during that year
49. Akhilesh Bhargava 48 Comparing Mortality in Different Populations Crude Age Adjustment Direct Indirect (Standardized Mortality Ratio) Cohort Analysis Life-table Analysis Median survival Life expectancy
51. Akhilesh Bhargava 50 Measures of Mortality: Mortality rate Cause specific Age specific Case-fatality rate Proportionate mortality rate Standardized Mortality Rates
52. Akhilesh Bhargava 51 Why study Mortality- Eternal, ultimate experience A measure of disease severity Effectiveness of treatment Surrogate for incidence (in severe, fatal diseases) Comparison of rates in two or more population or one population at different times
53. Akhilesh Bhargava 52 Mortality Data- Problems Change in coding of ICD revisions Changes in definitions of diseases Underlying cause of death excludes Information on immediate Cause & those in between two. Denominator may not be available Numerator alone does not give rates and calls for standardization