Downloaded 2,123 times
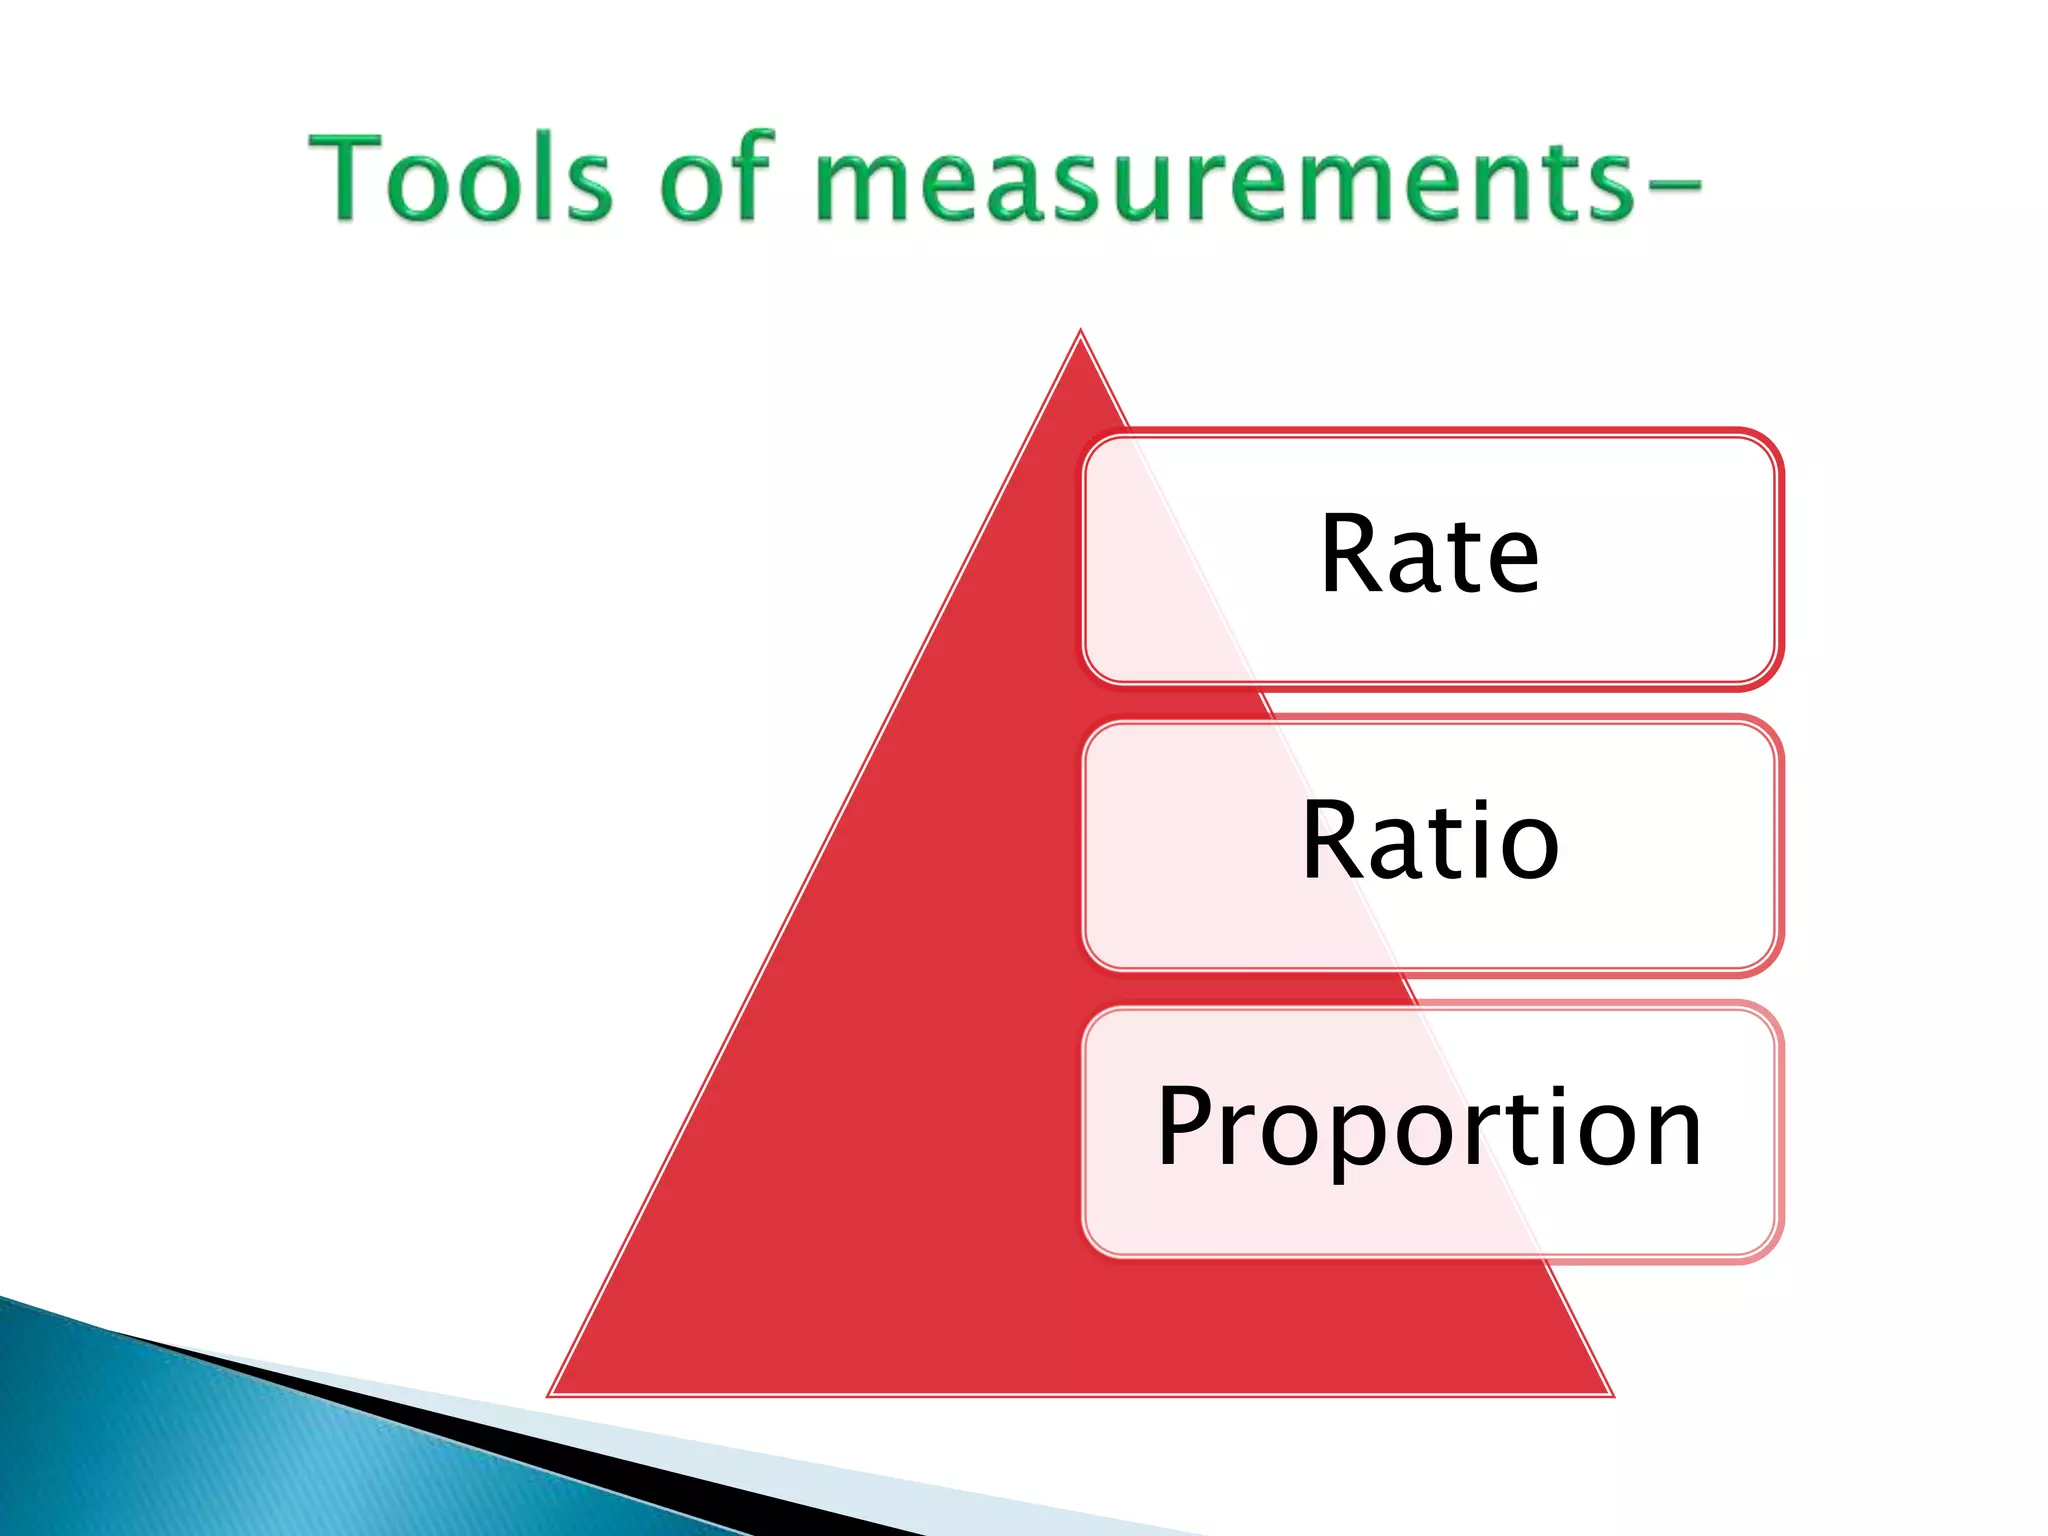
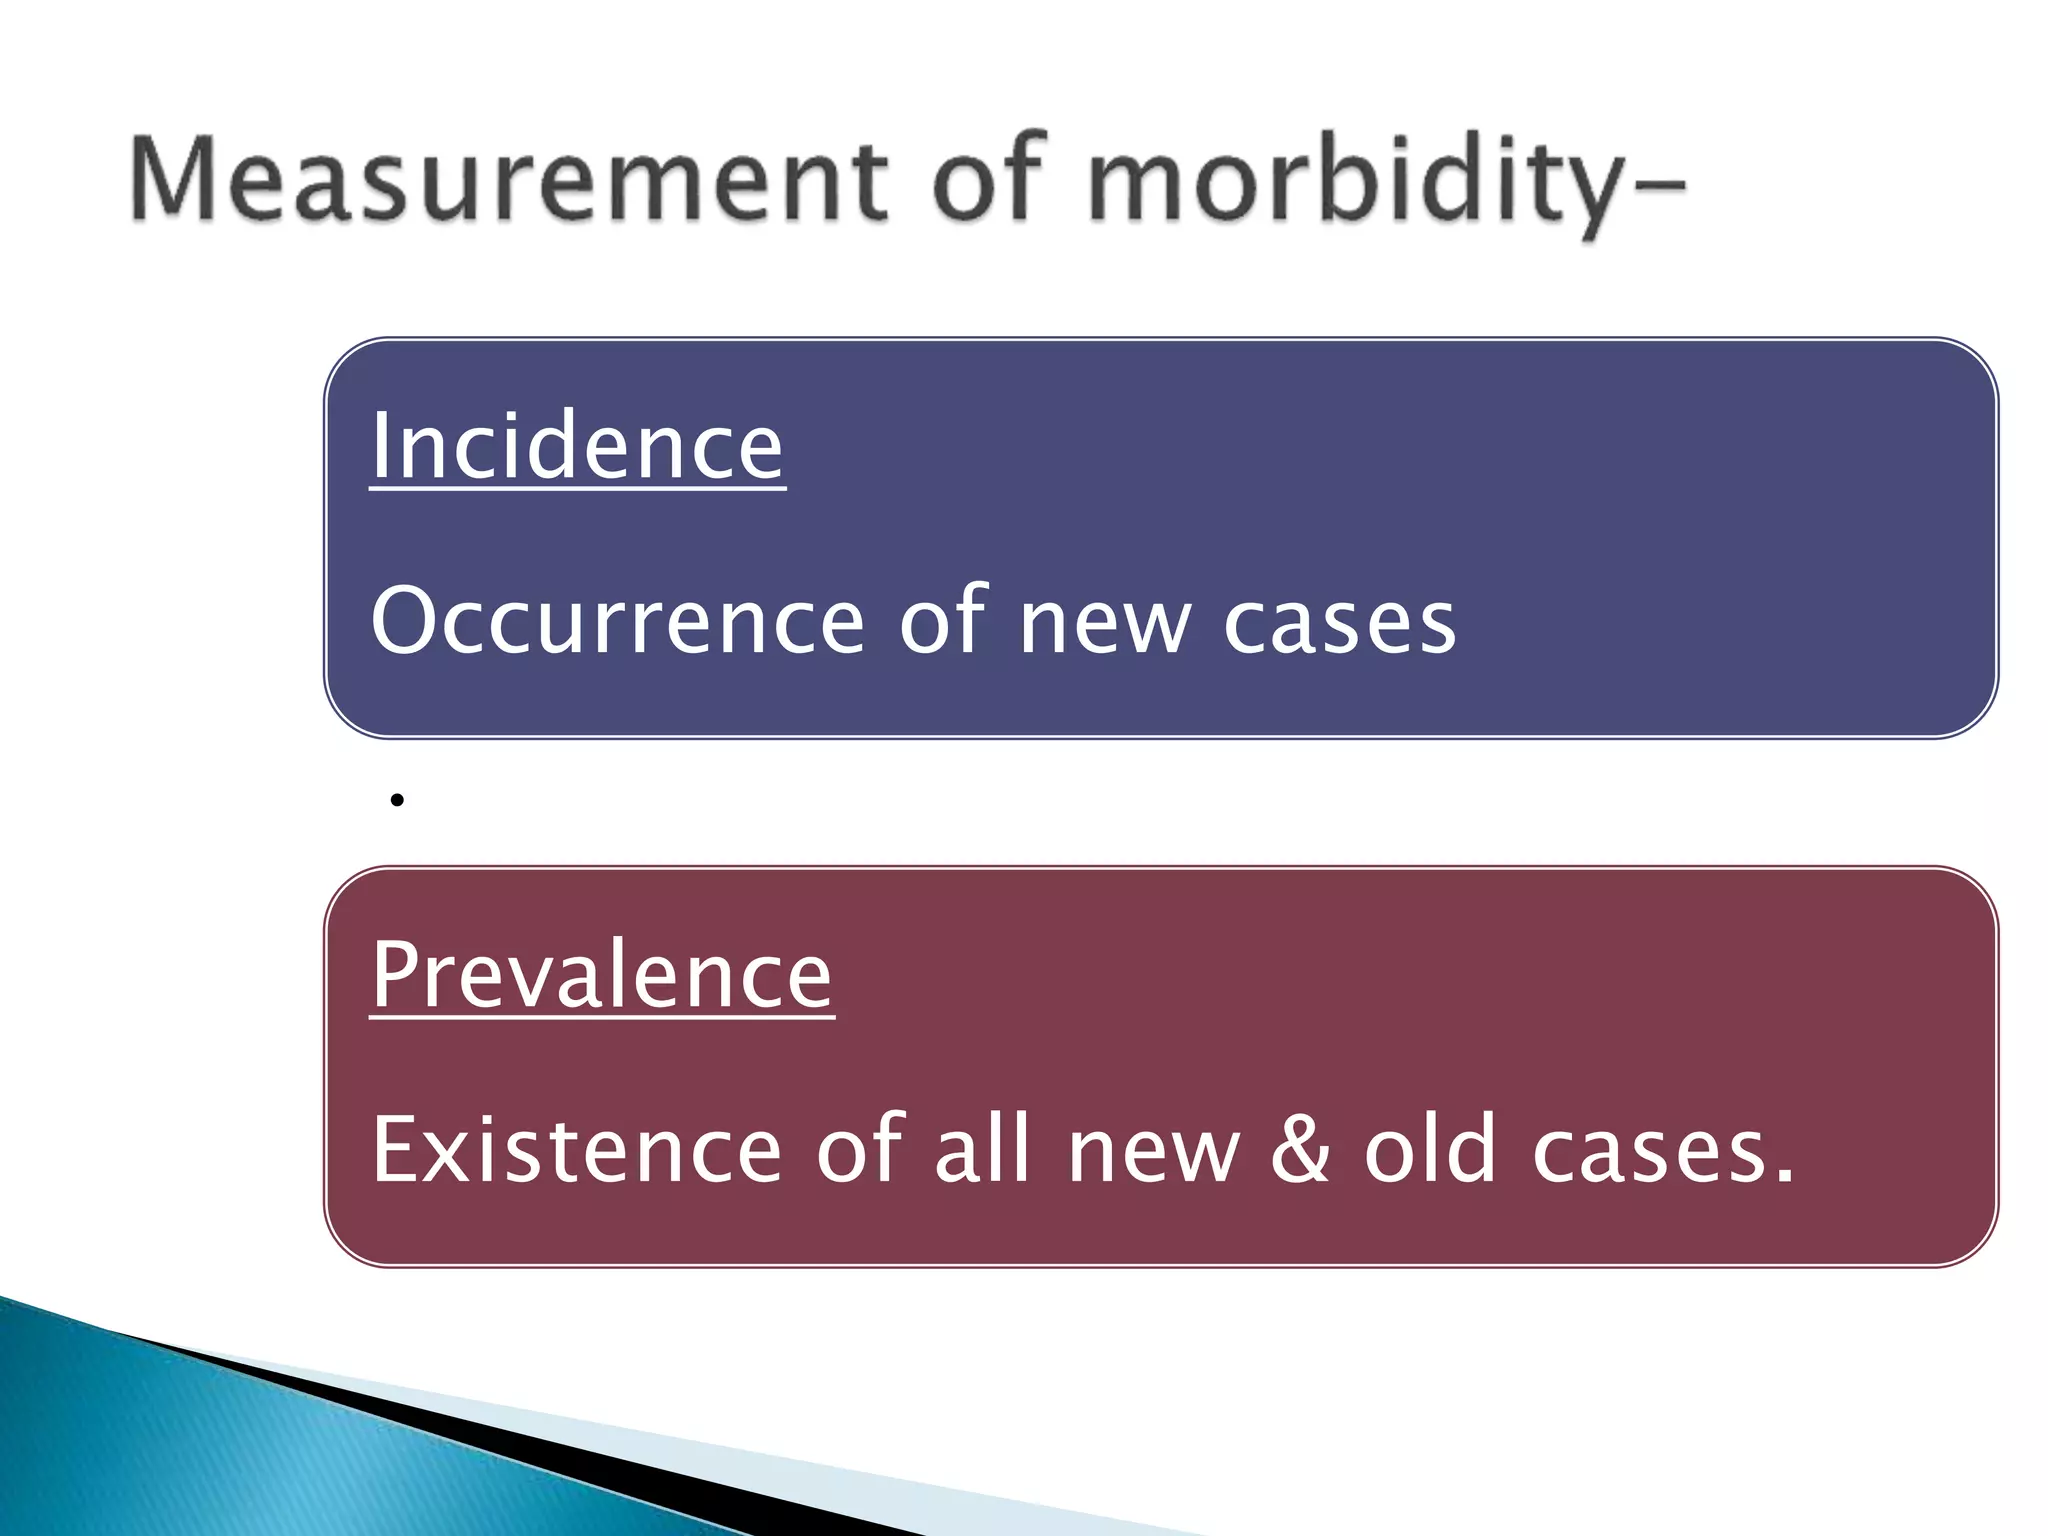
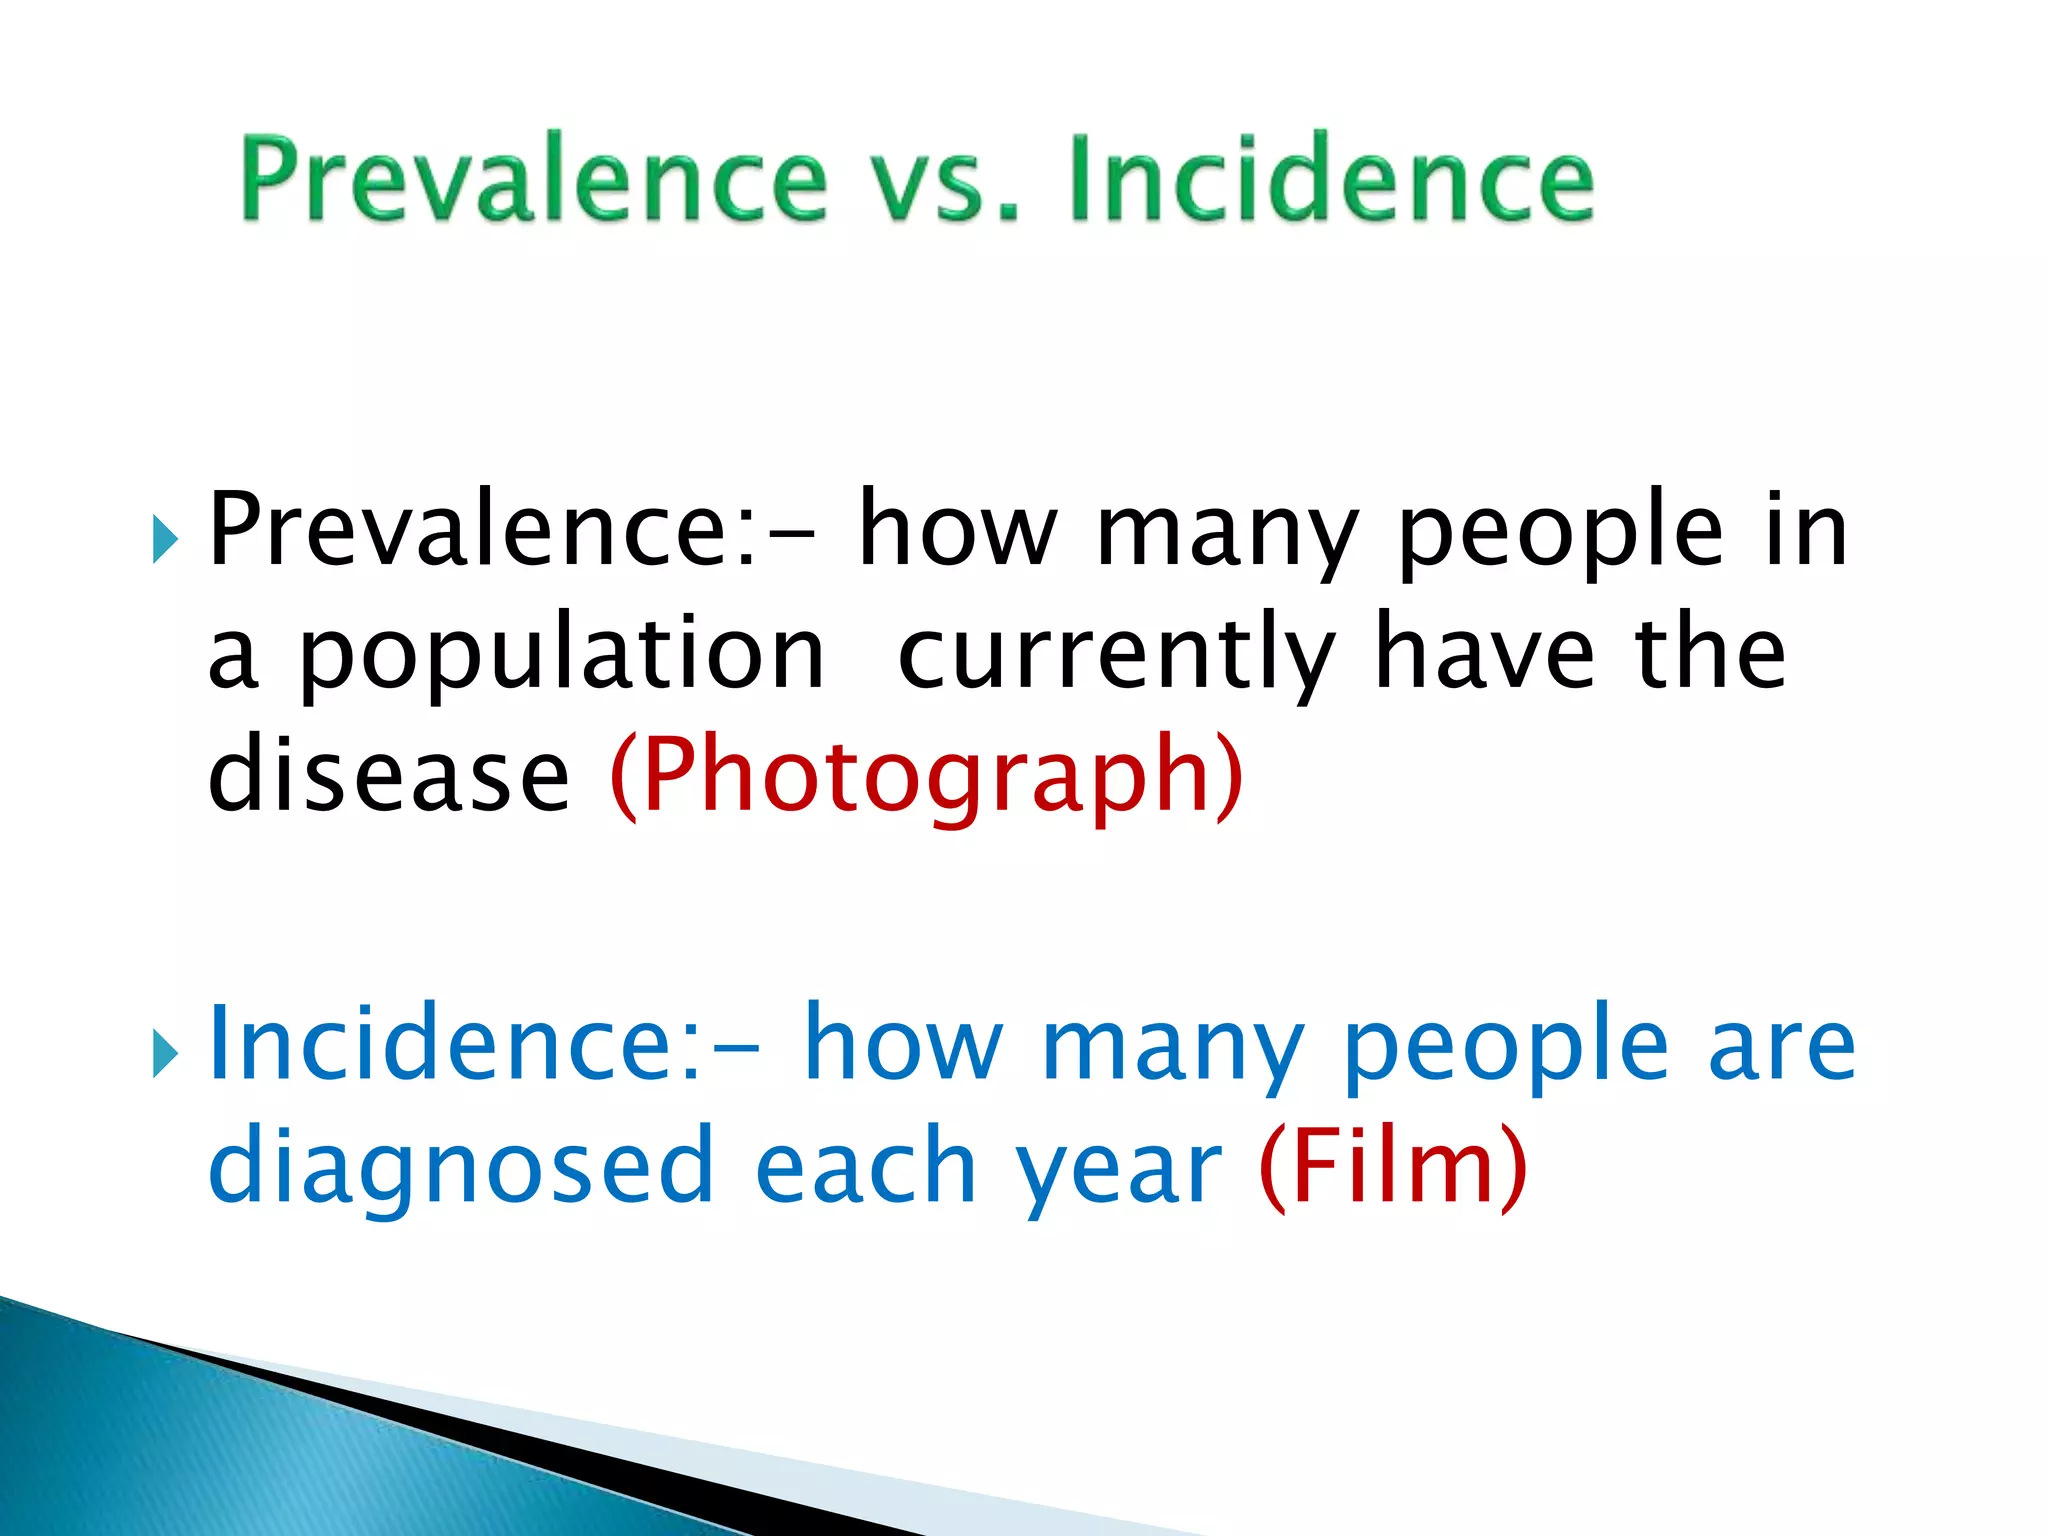
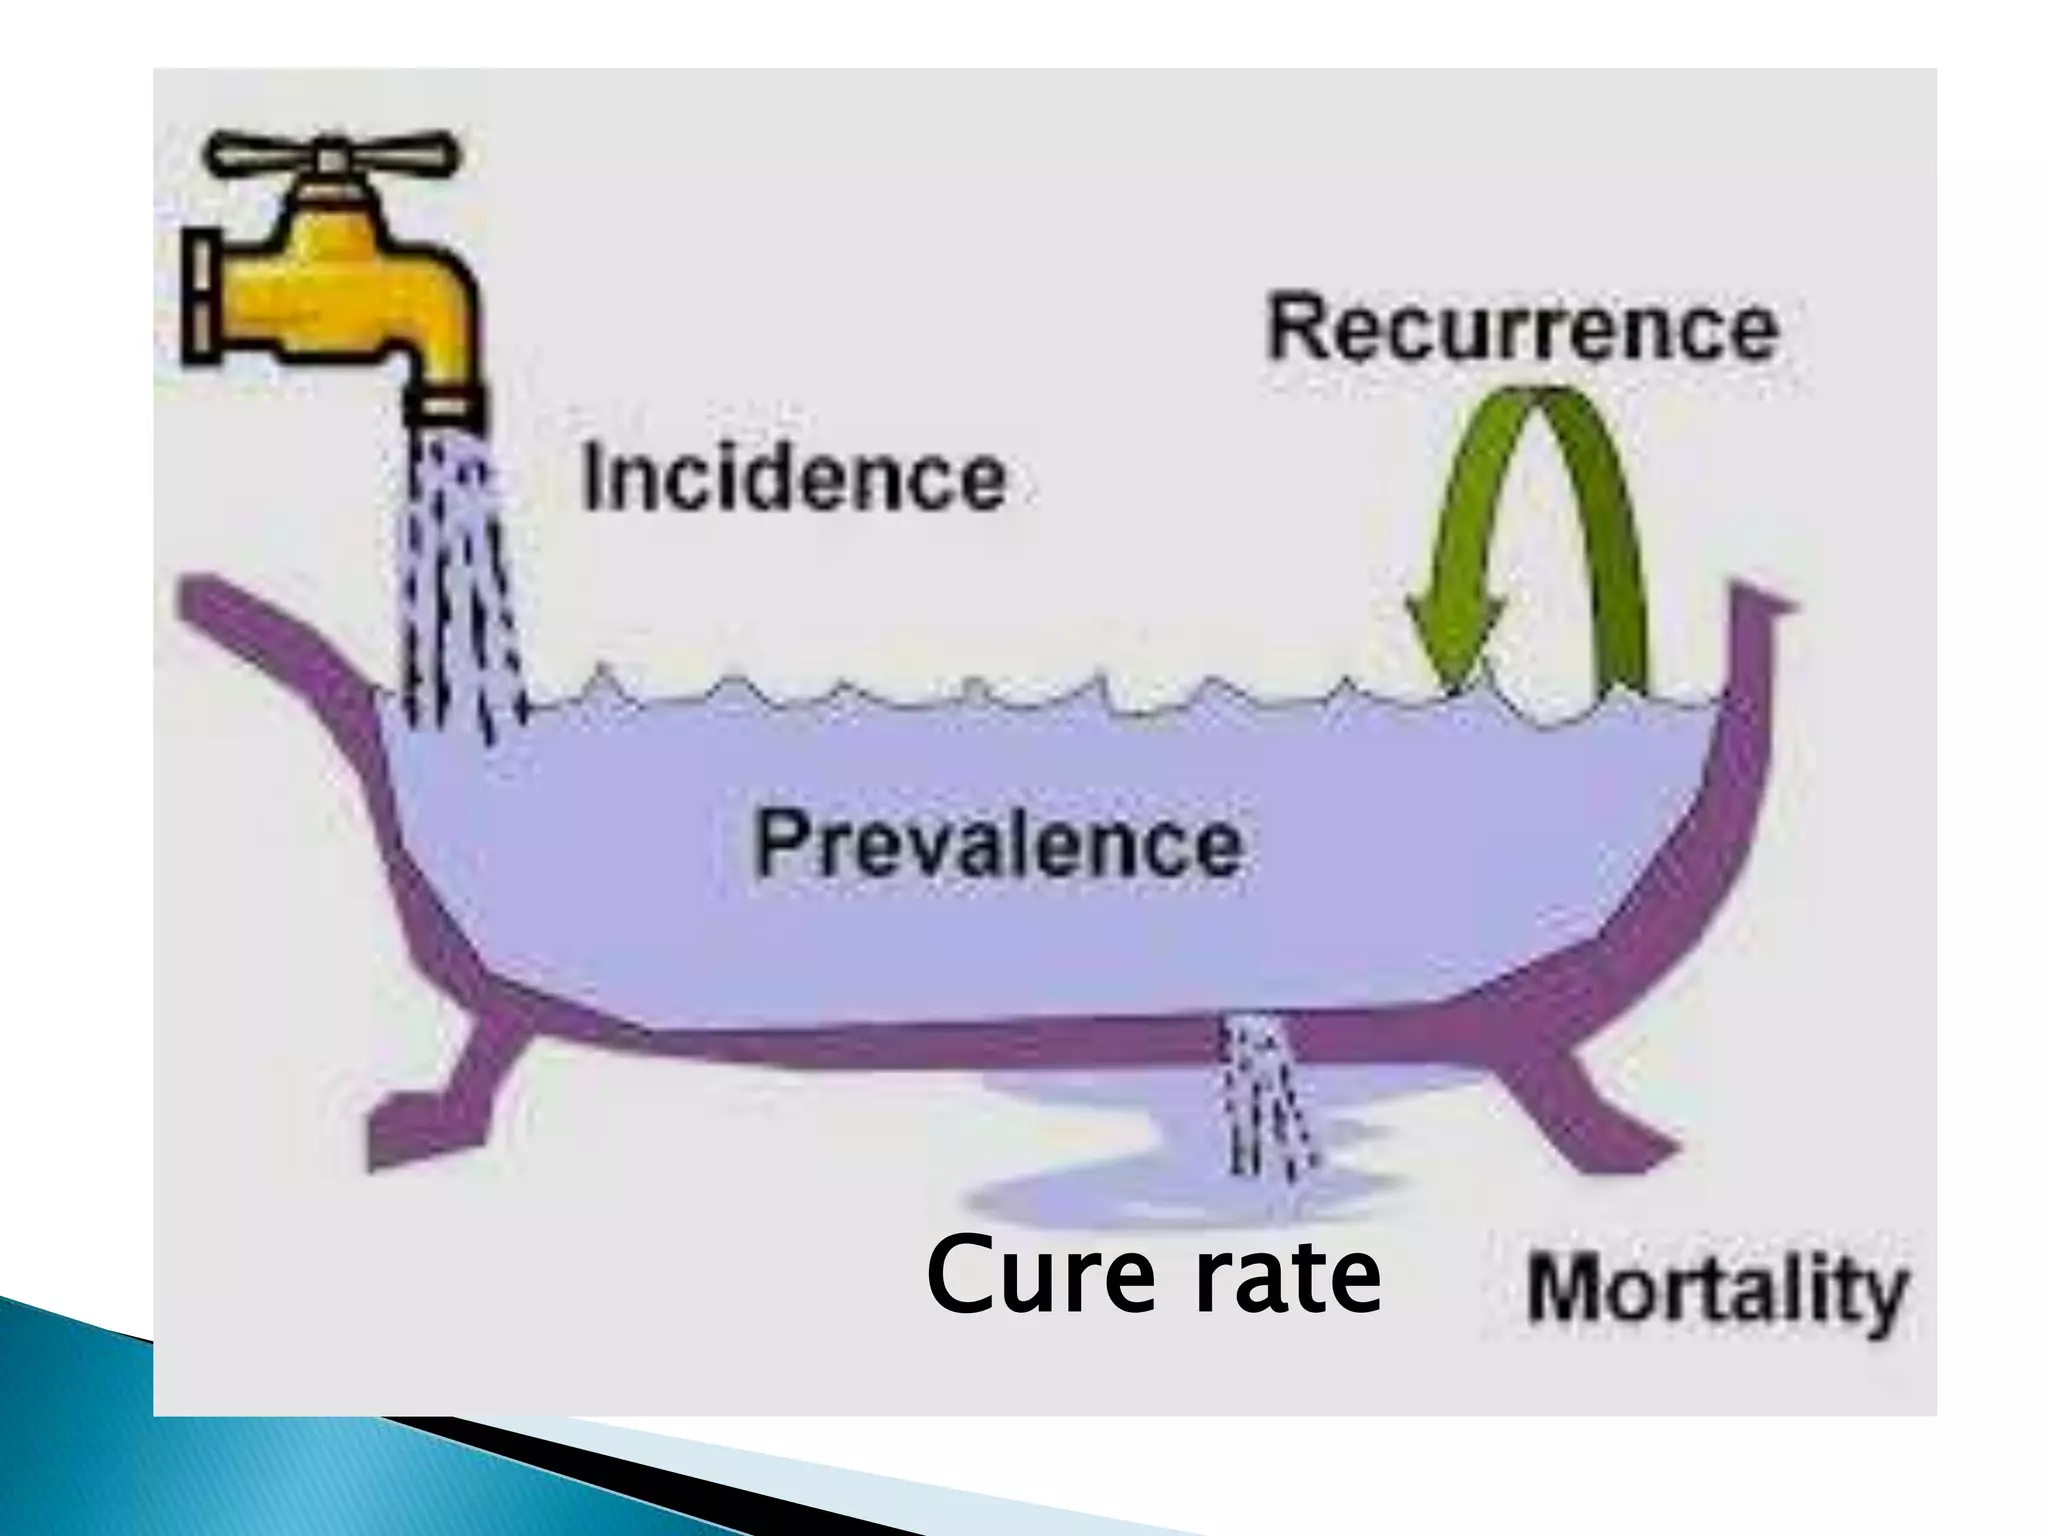

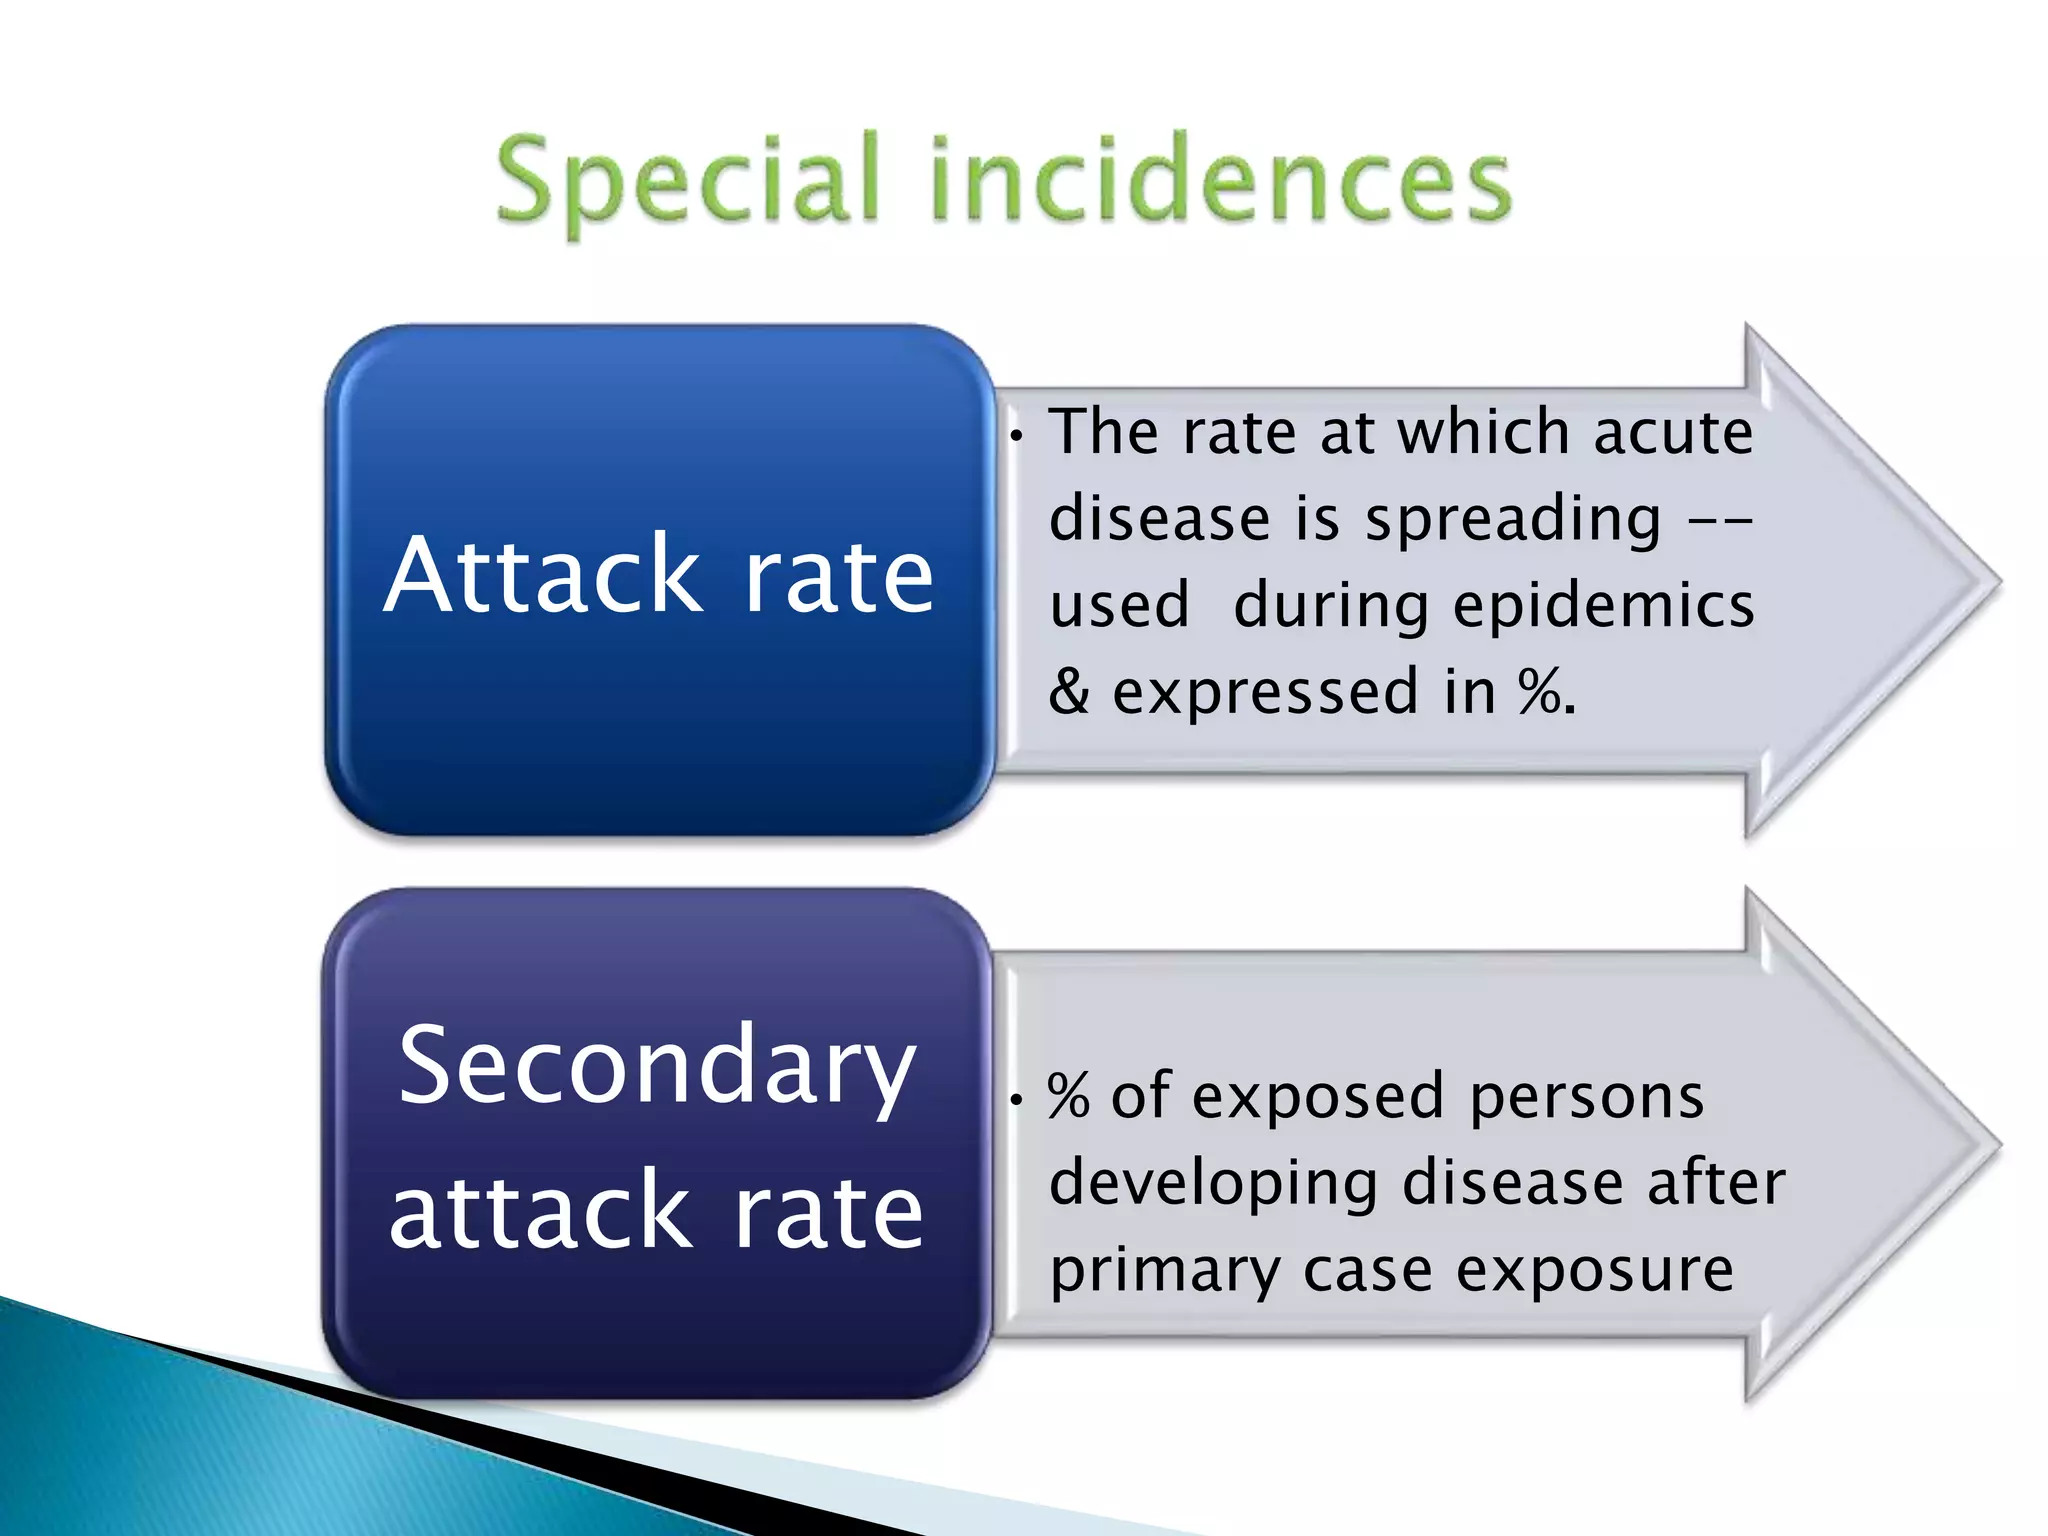
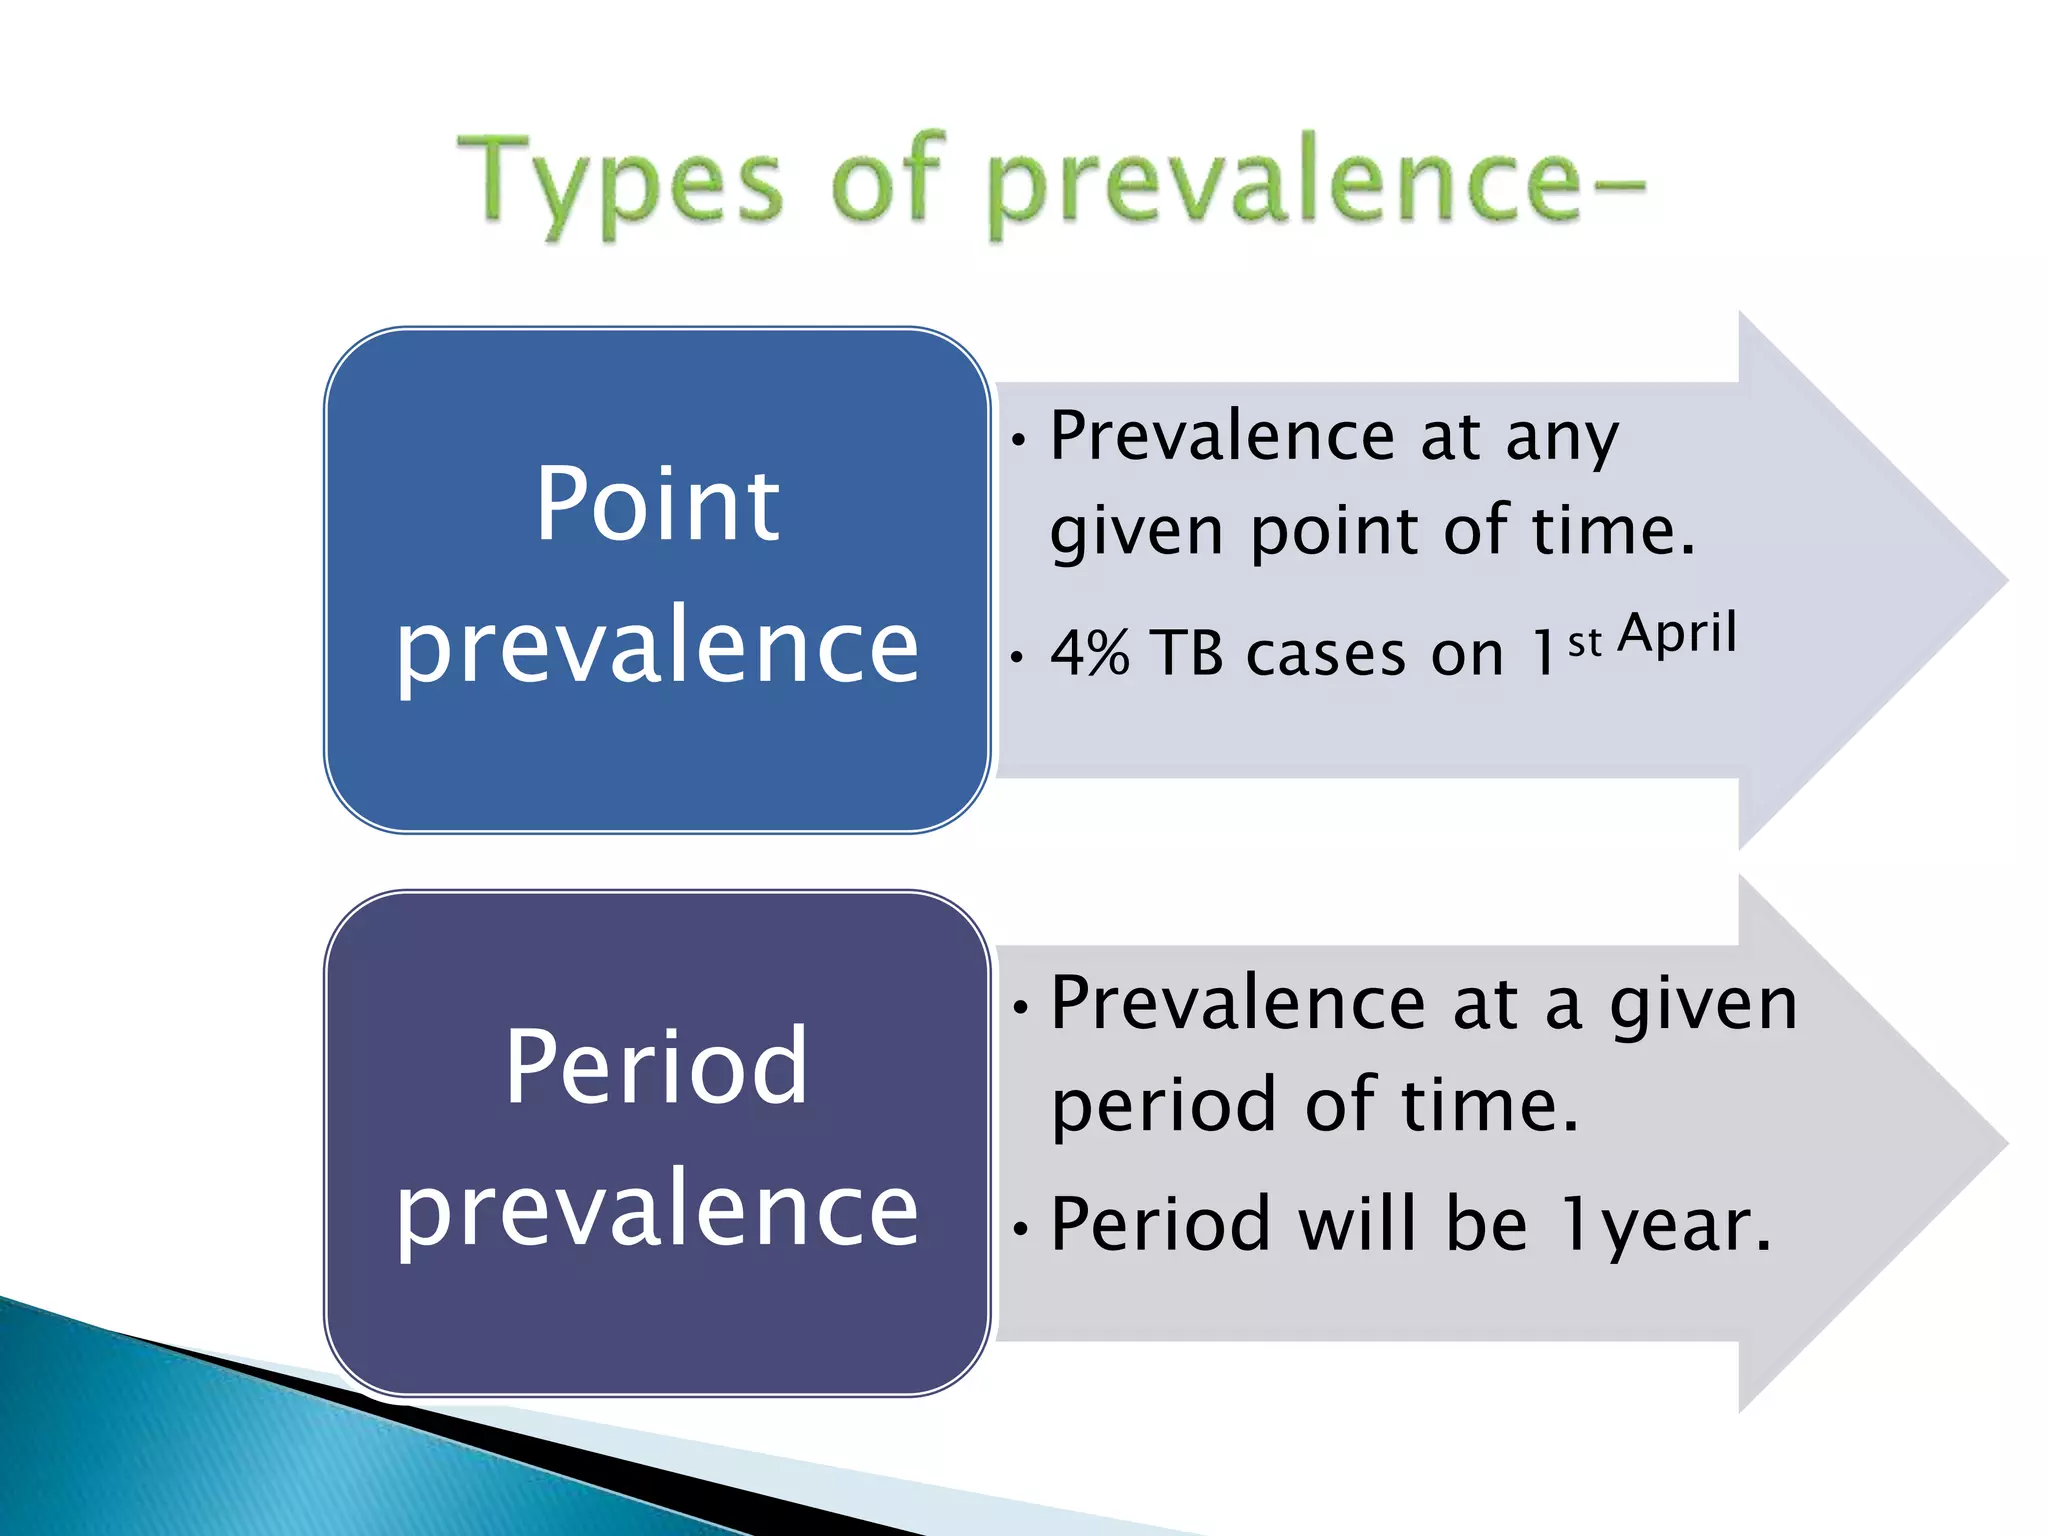
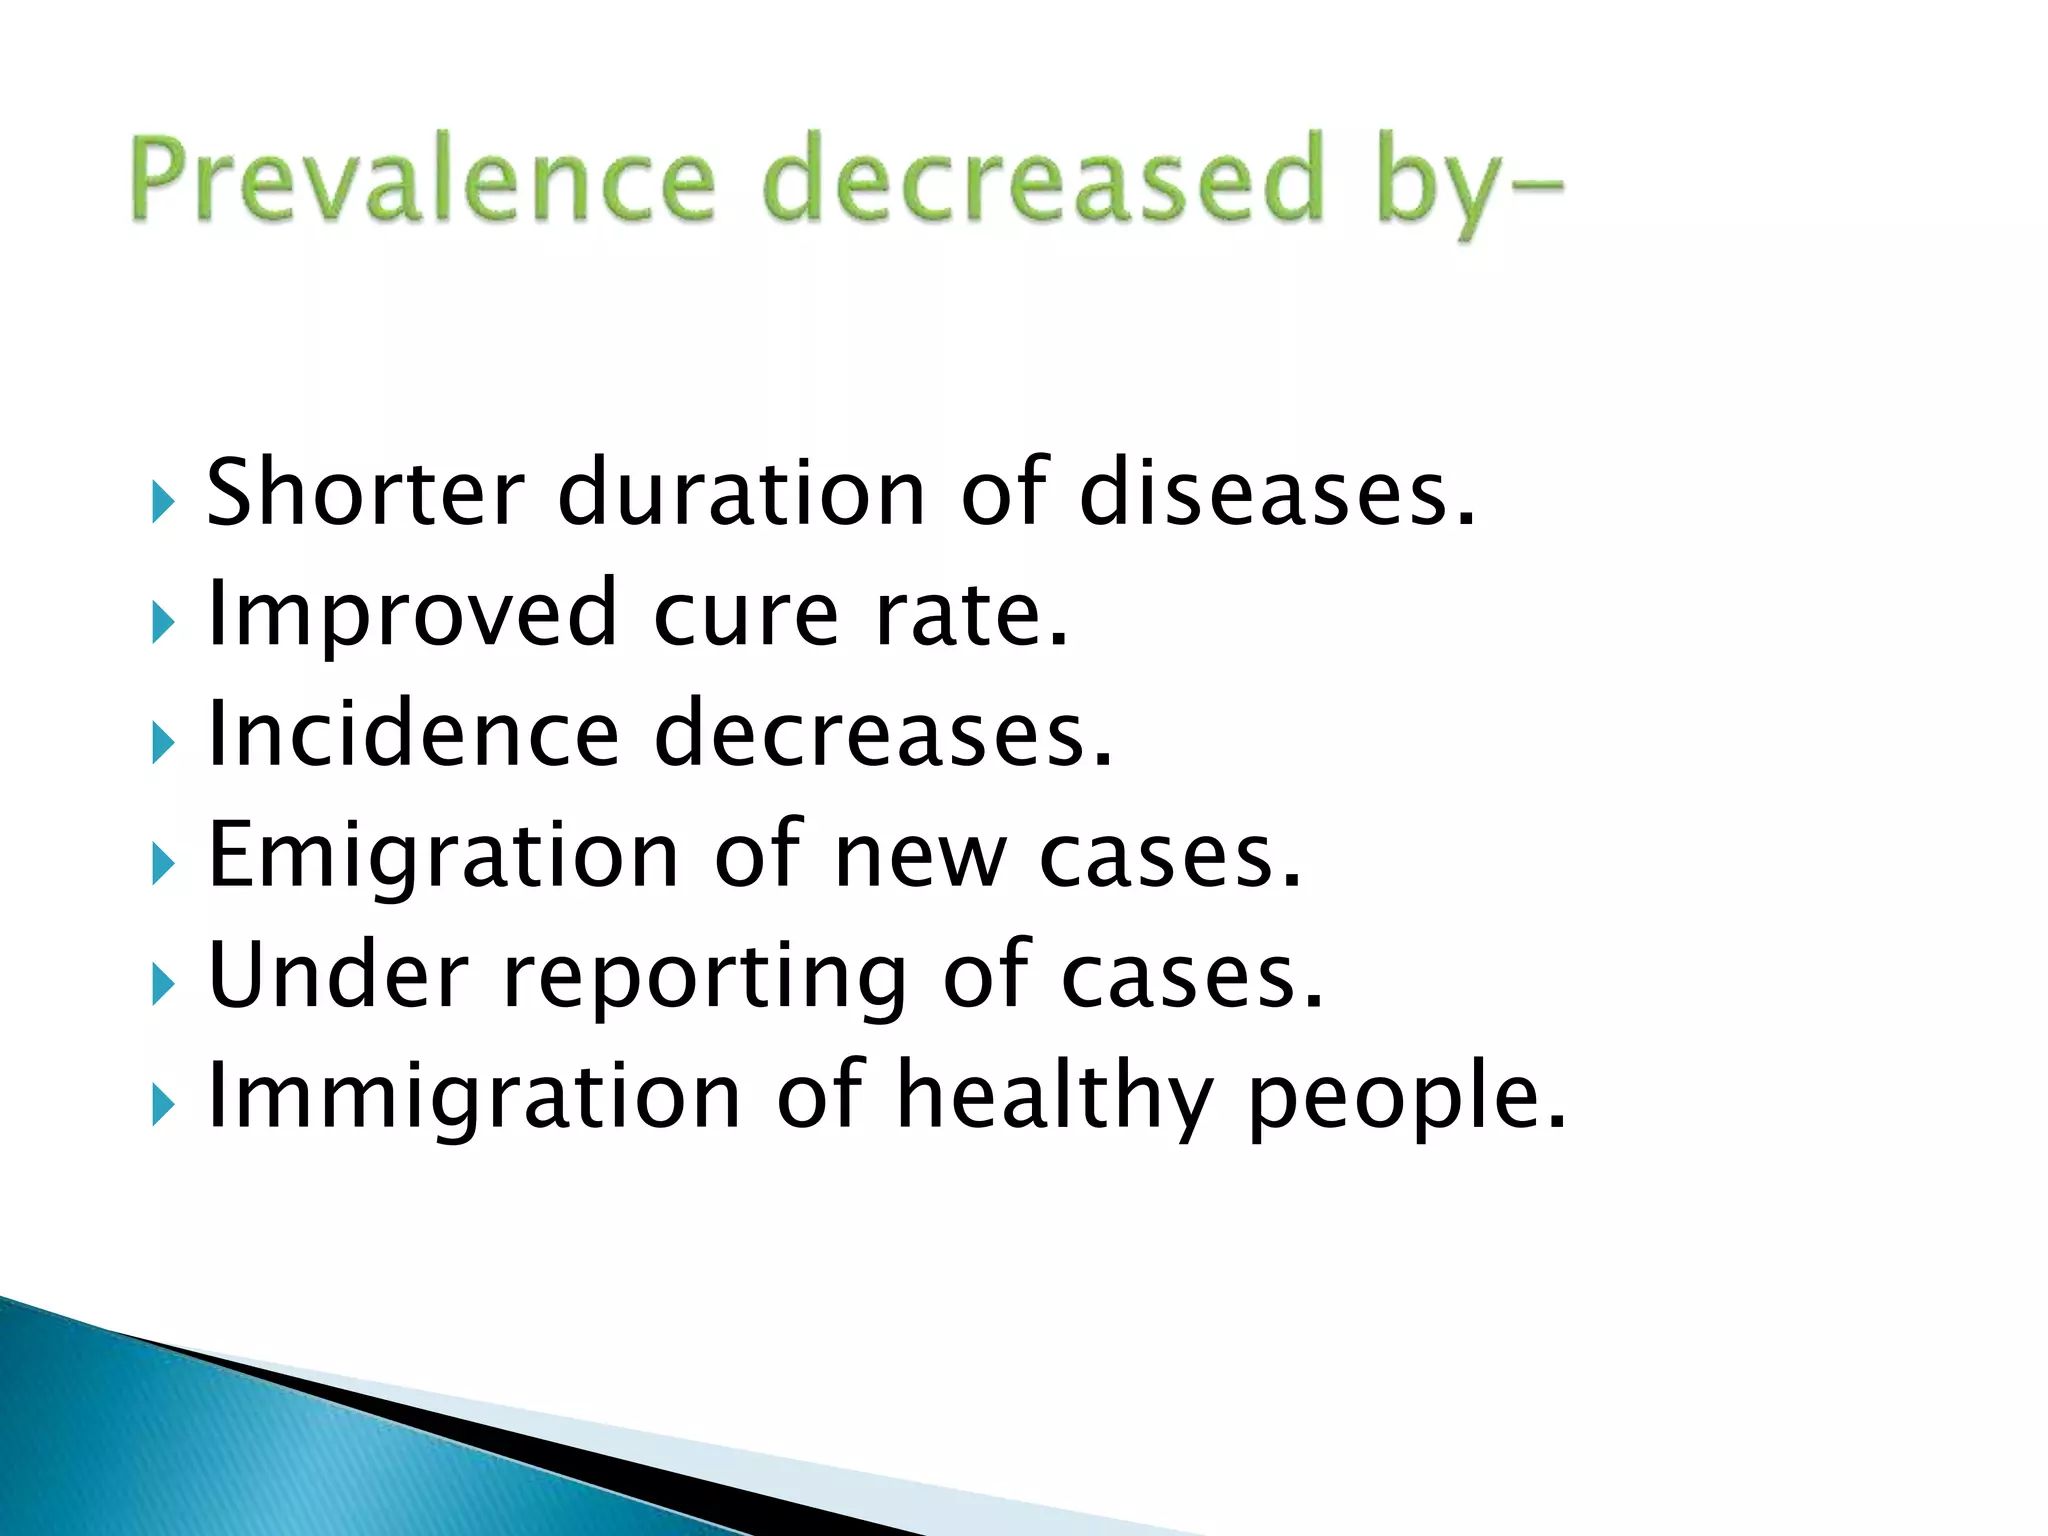
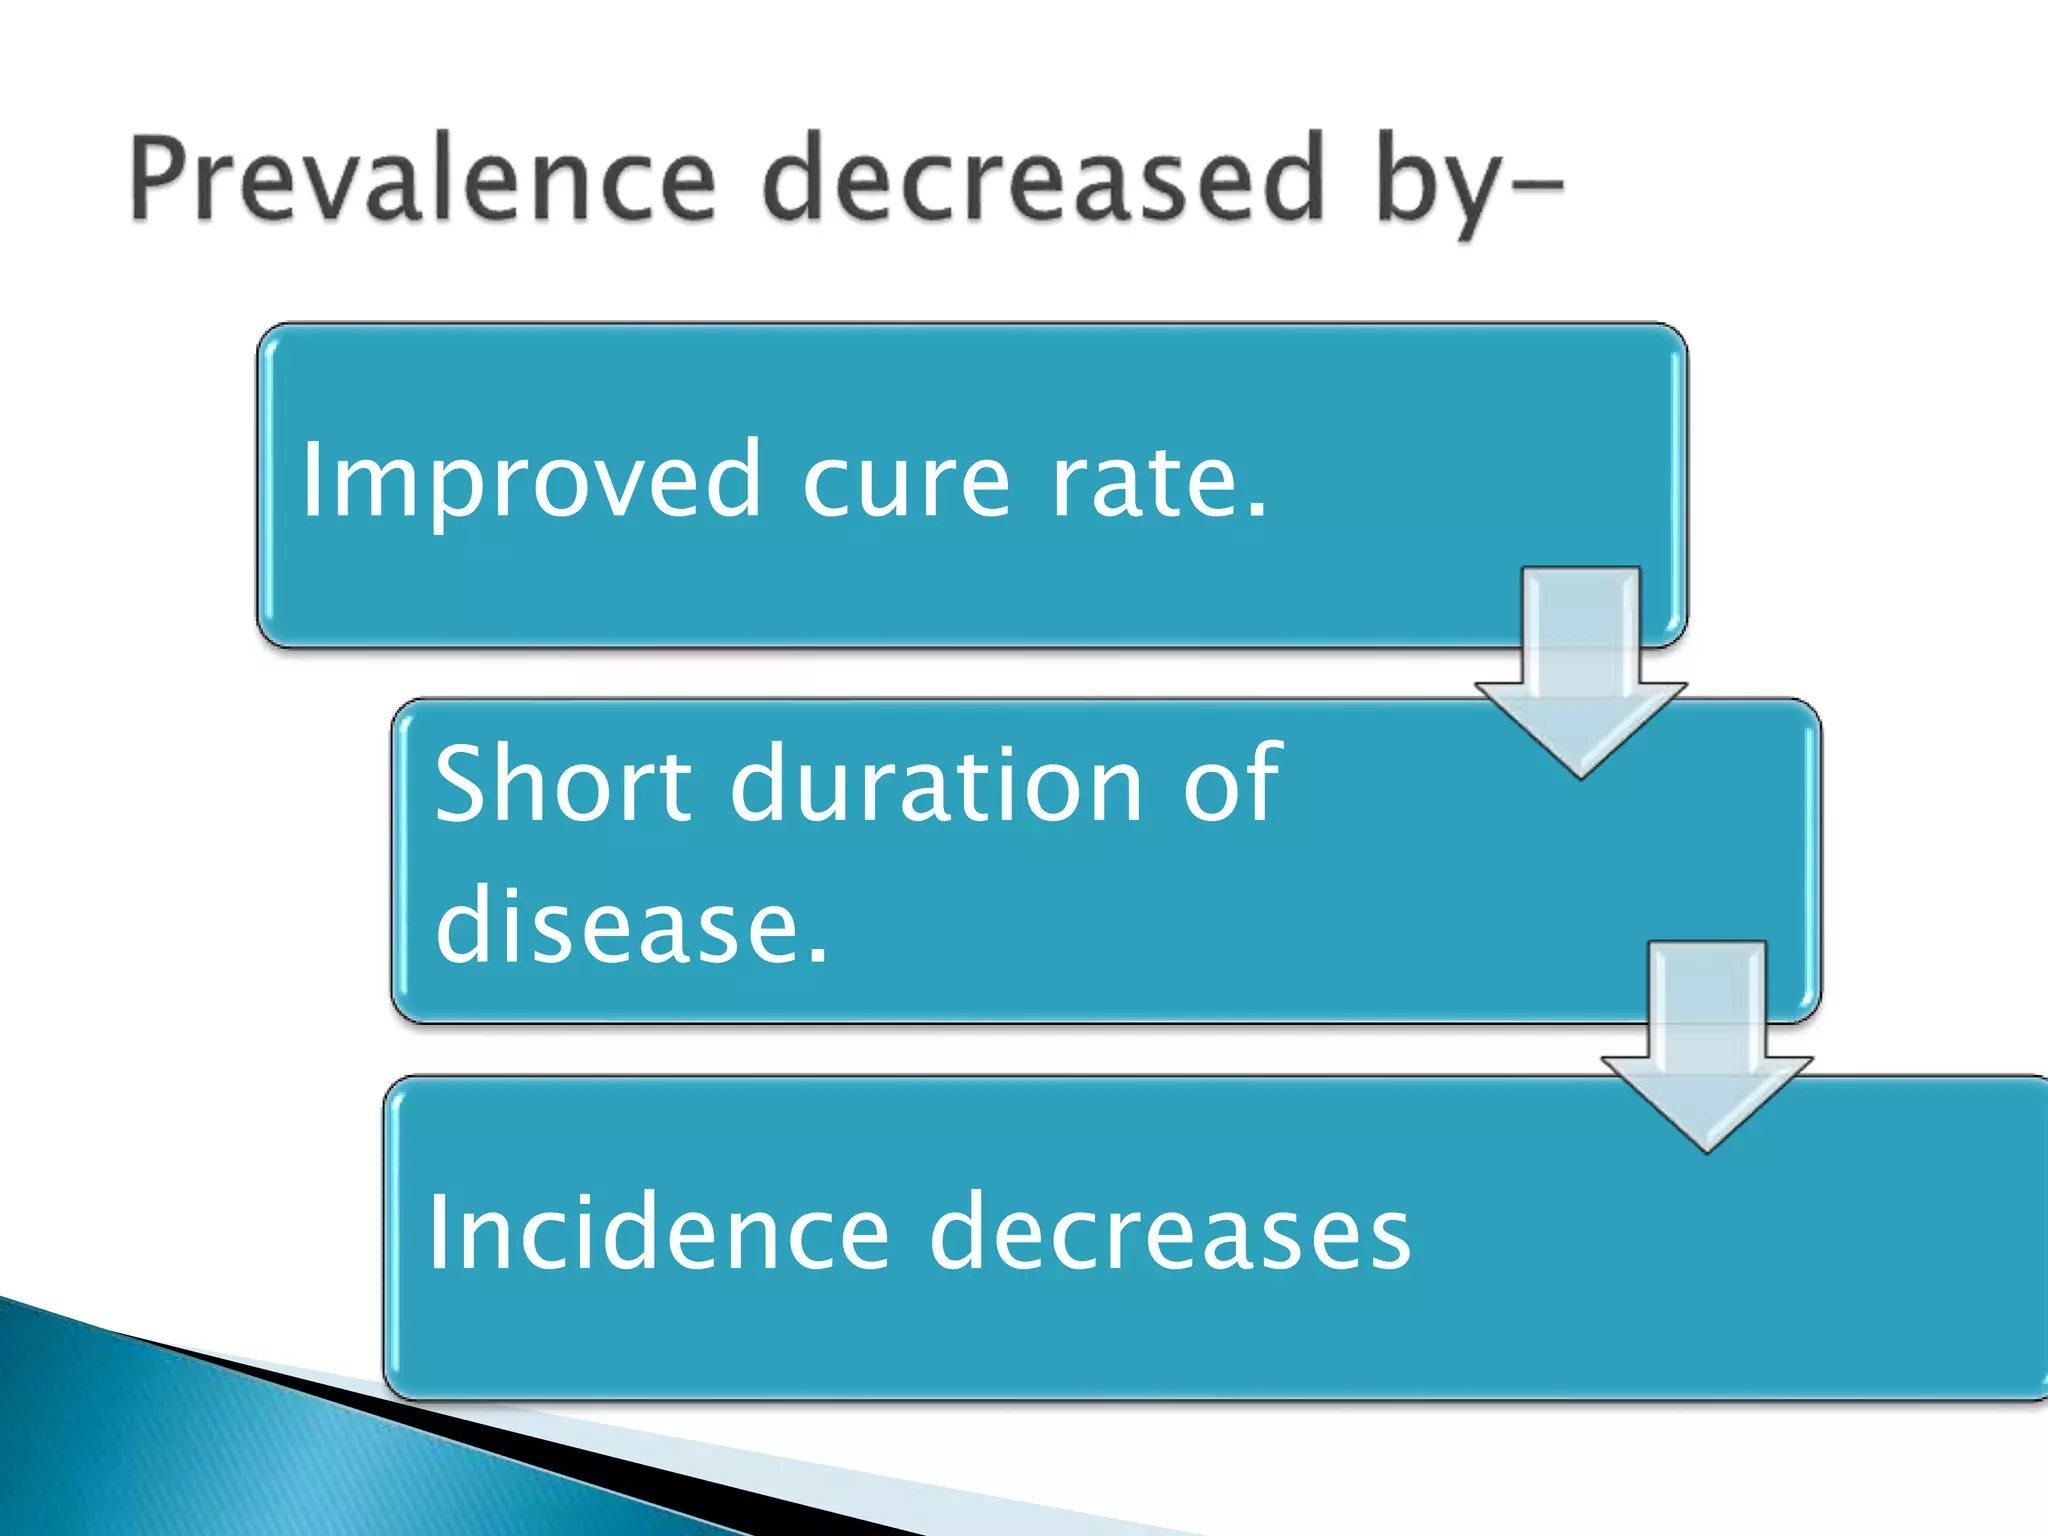
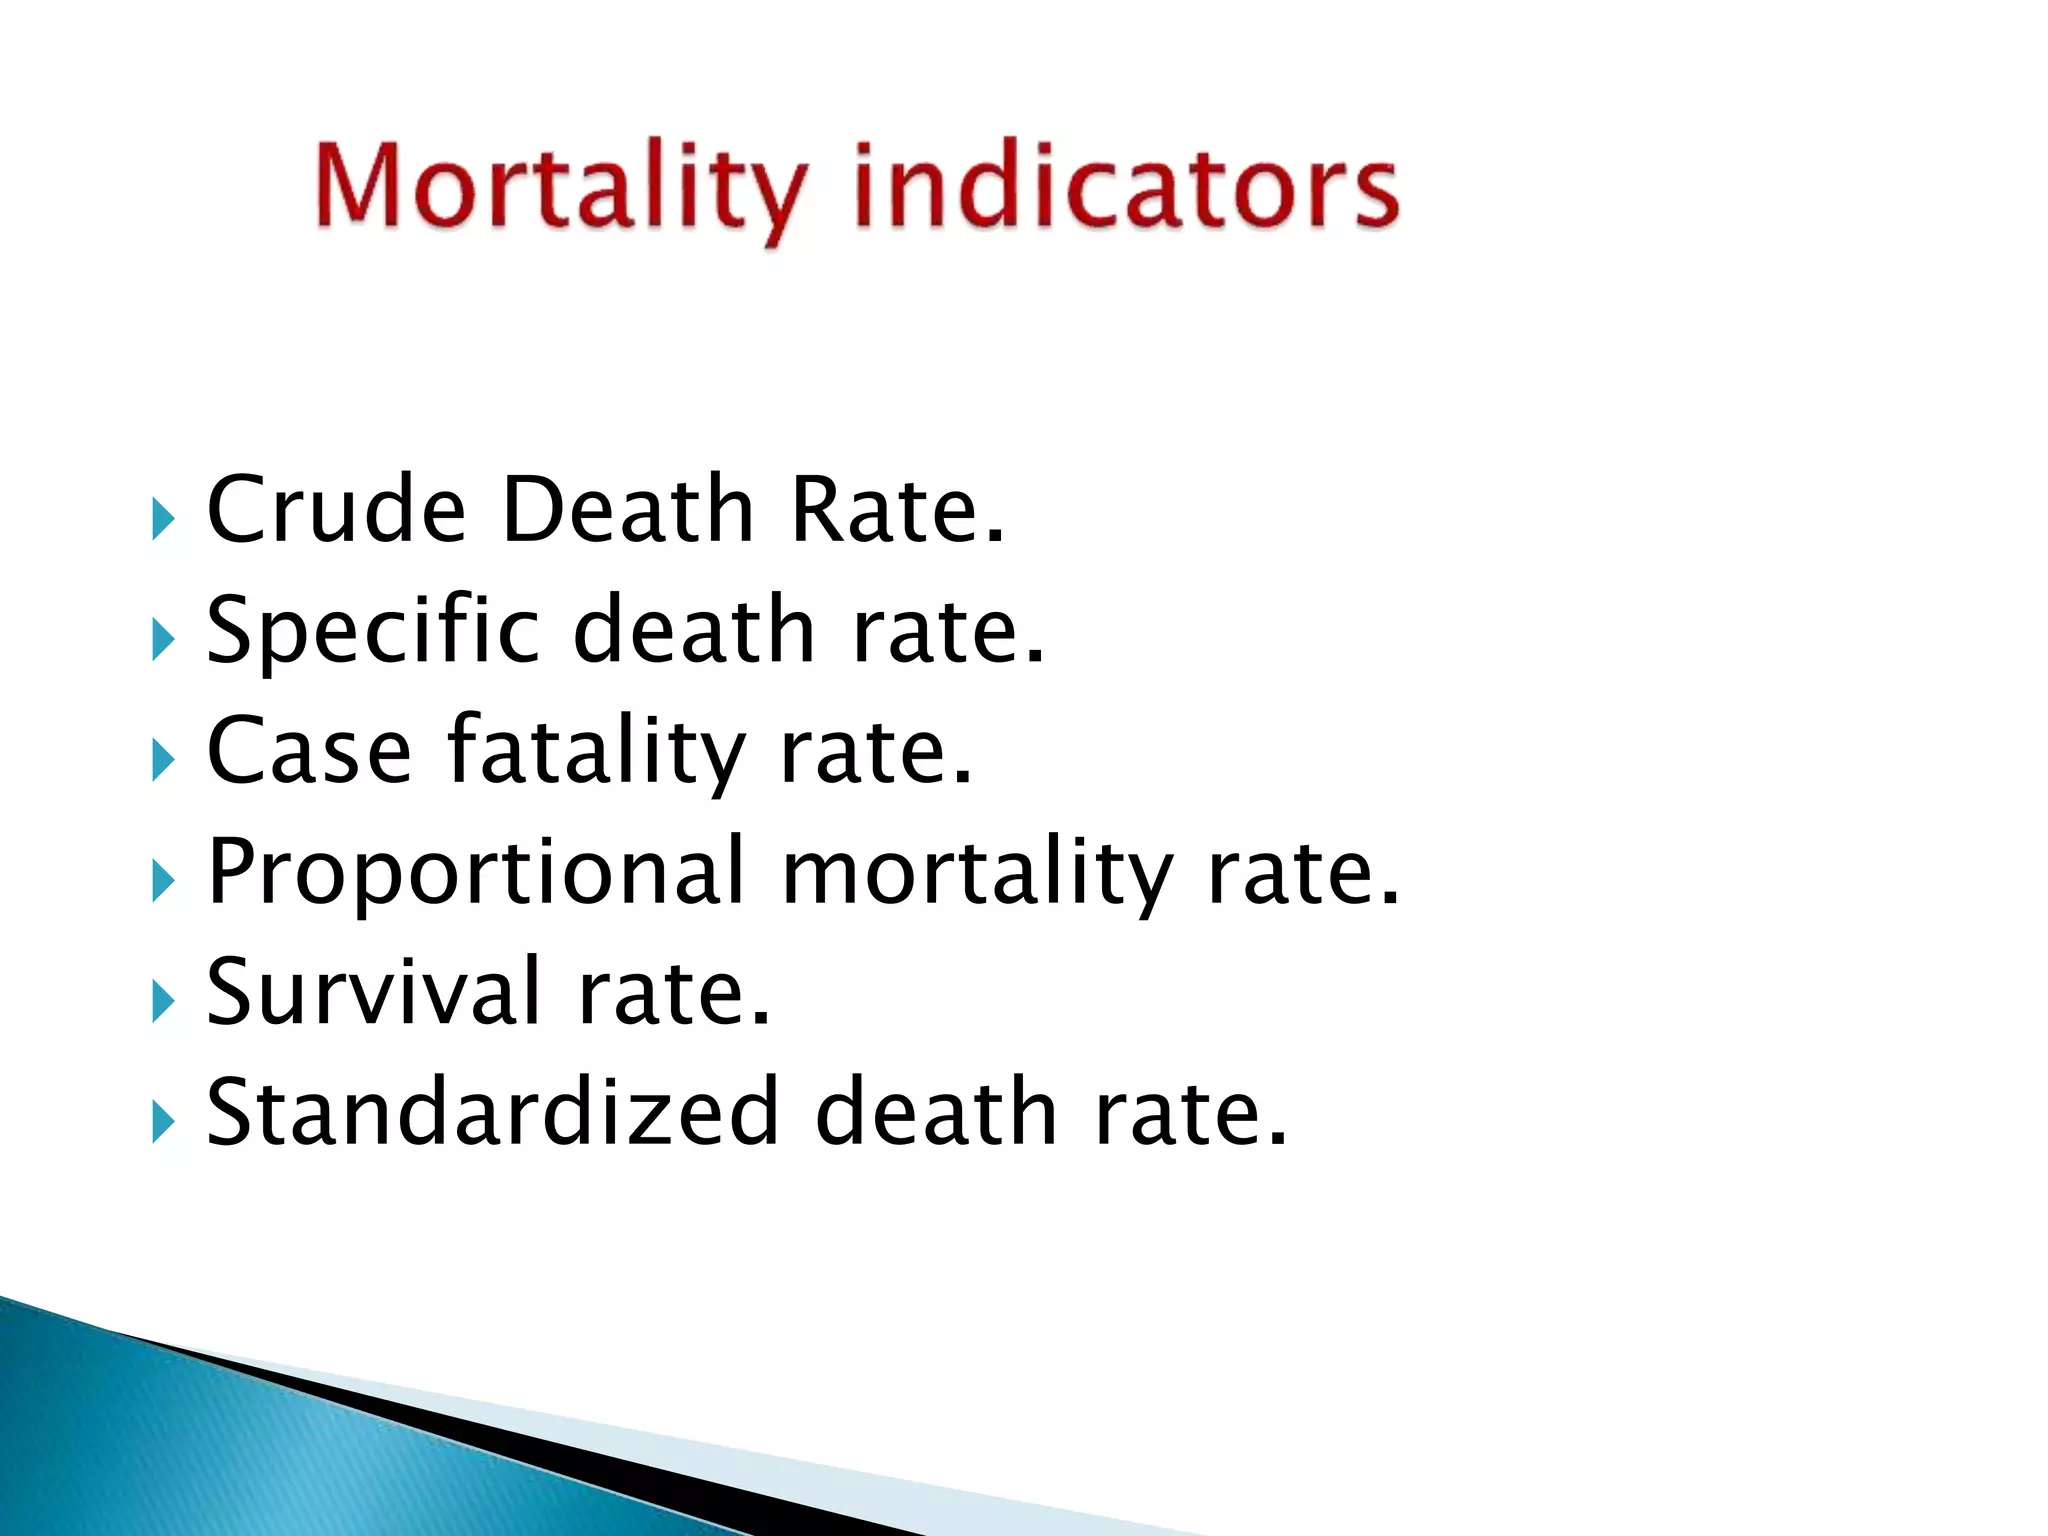
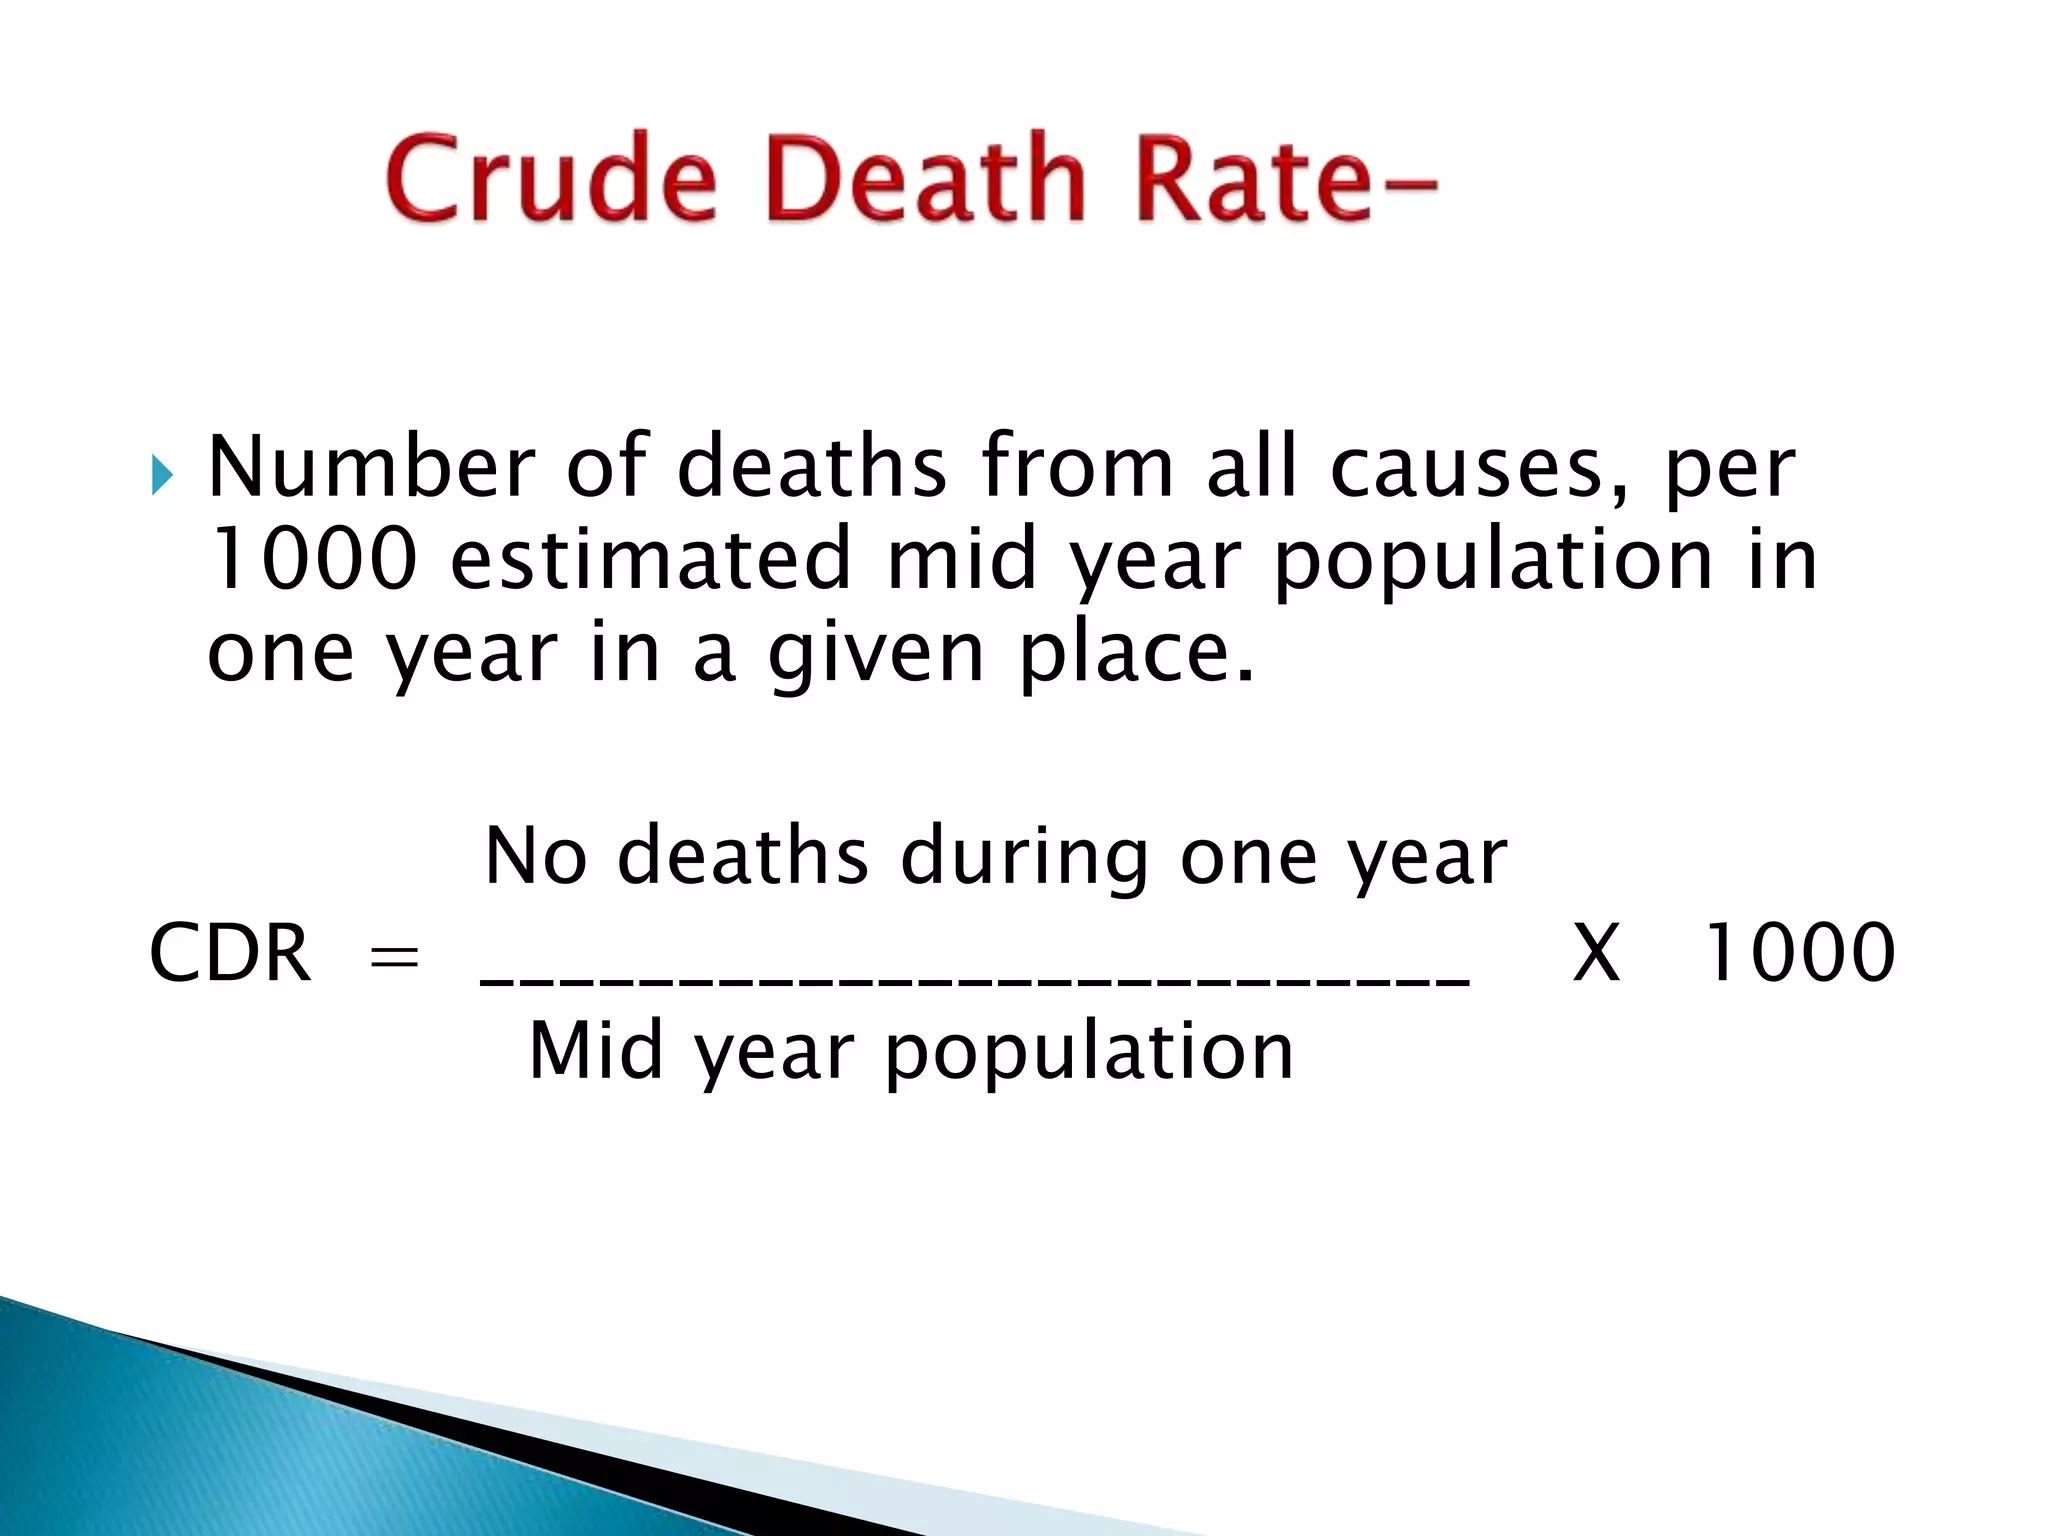
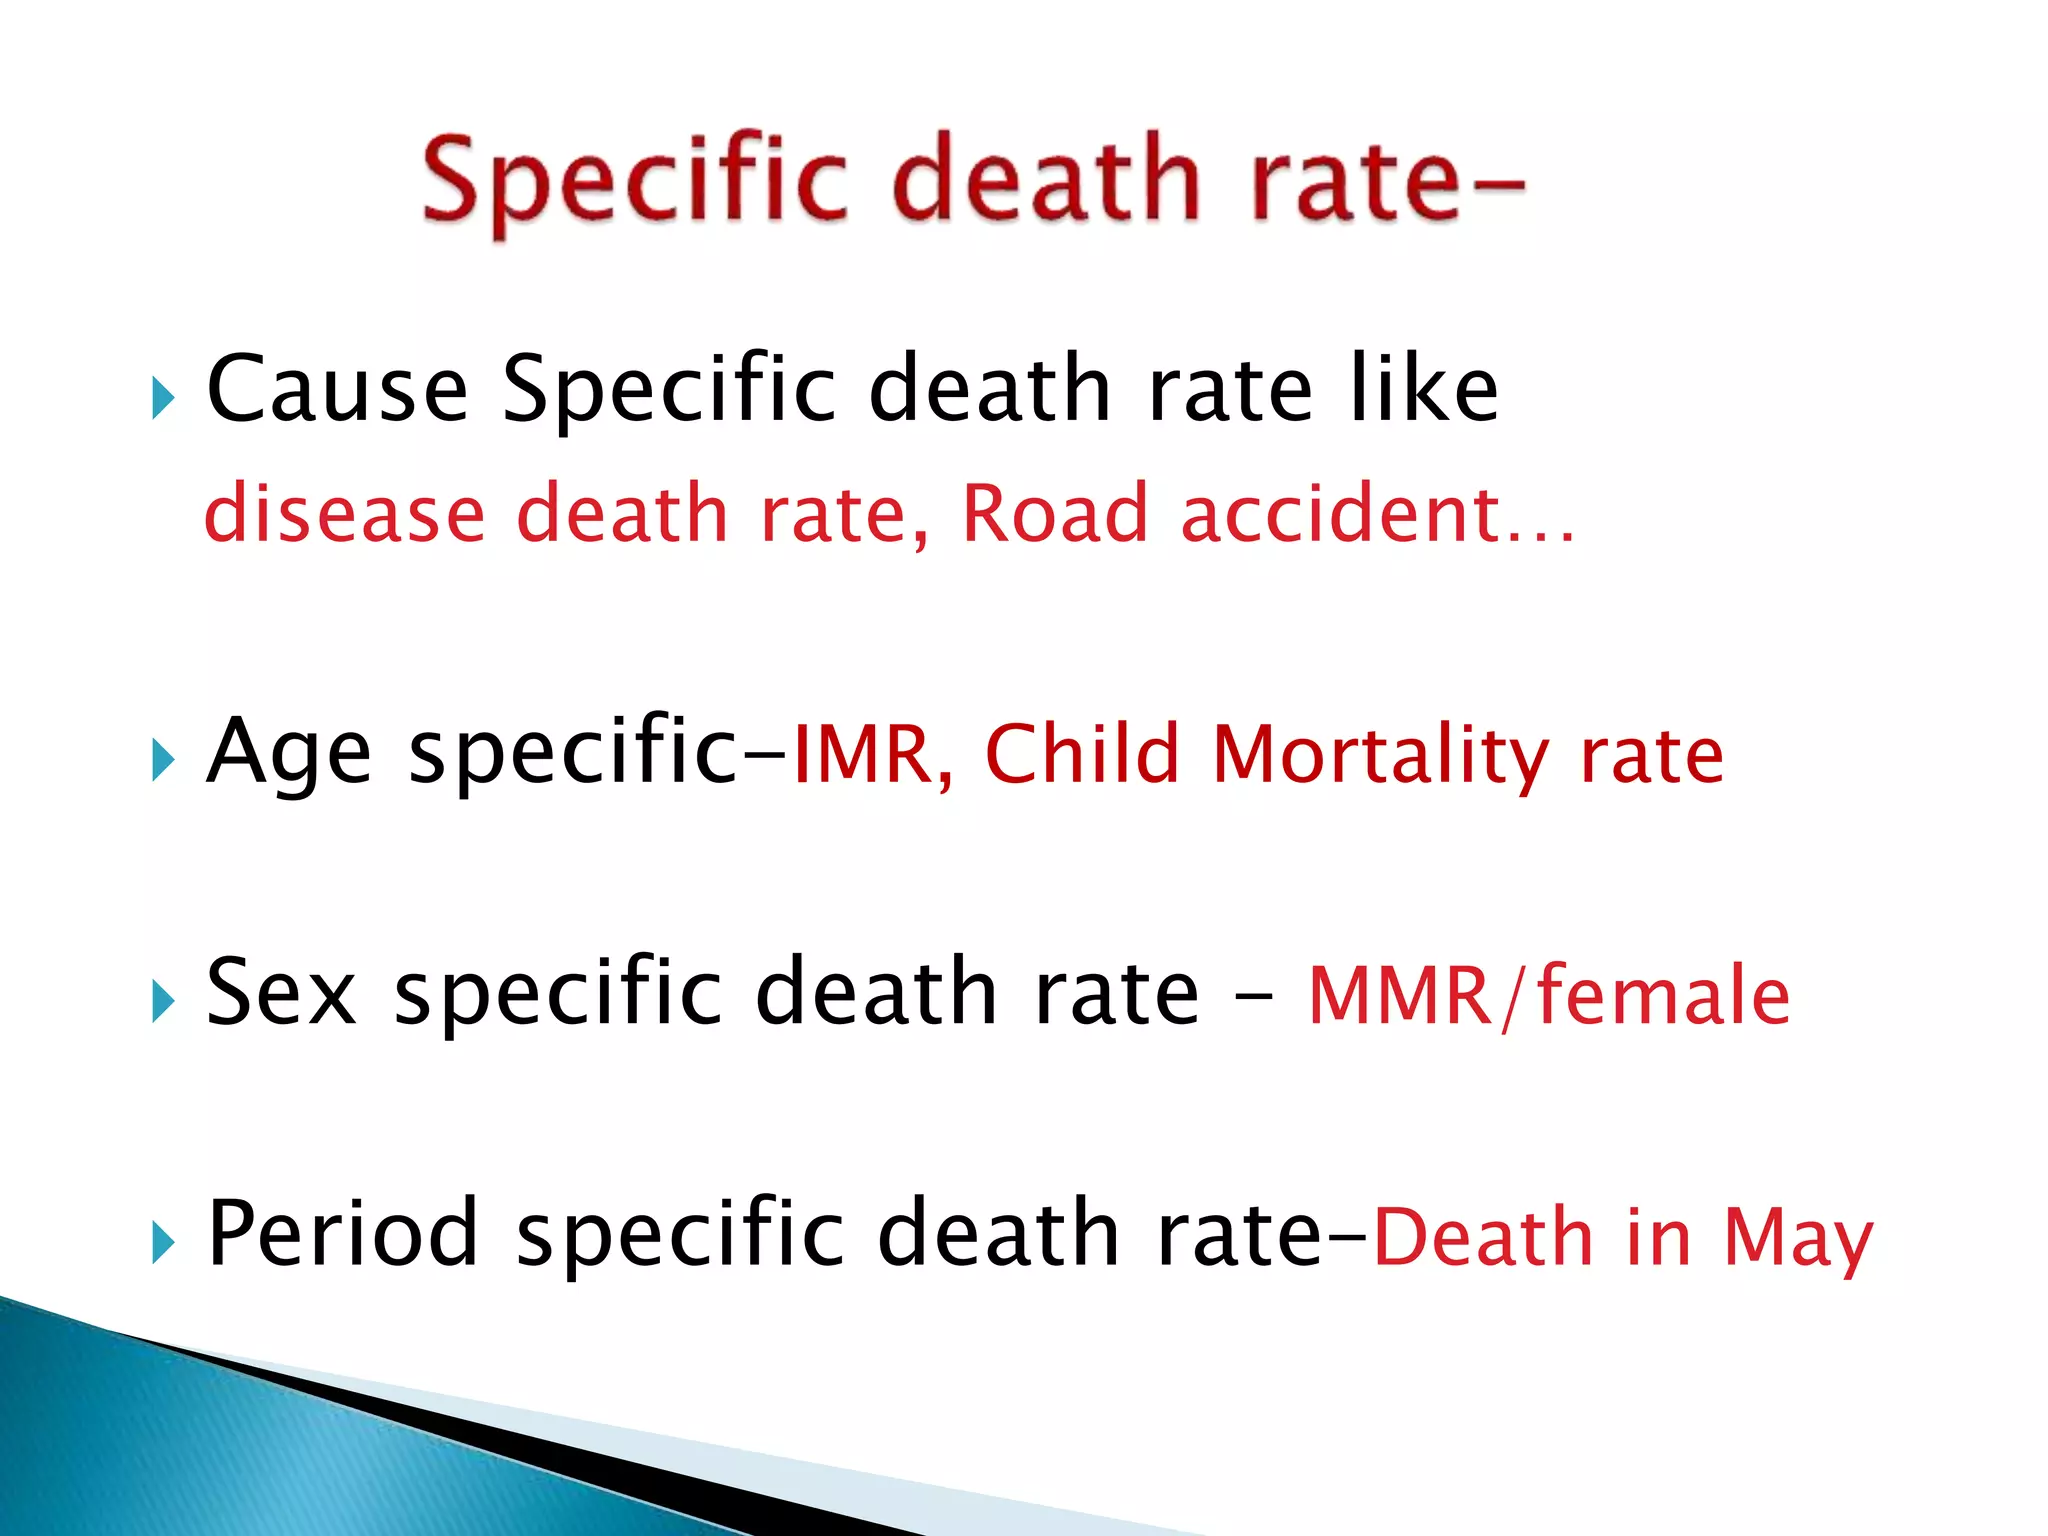
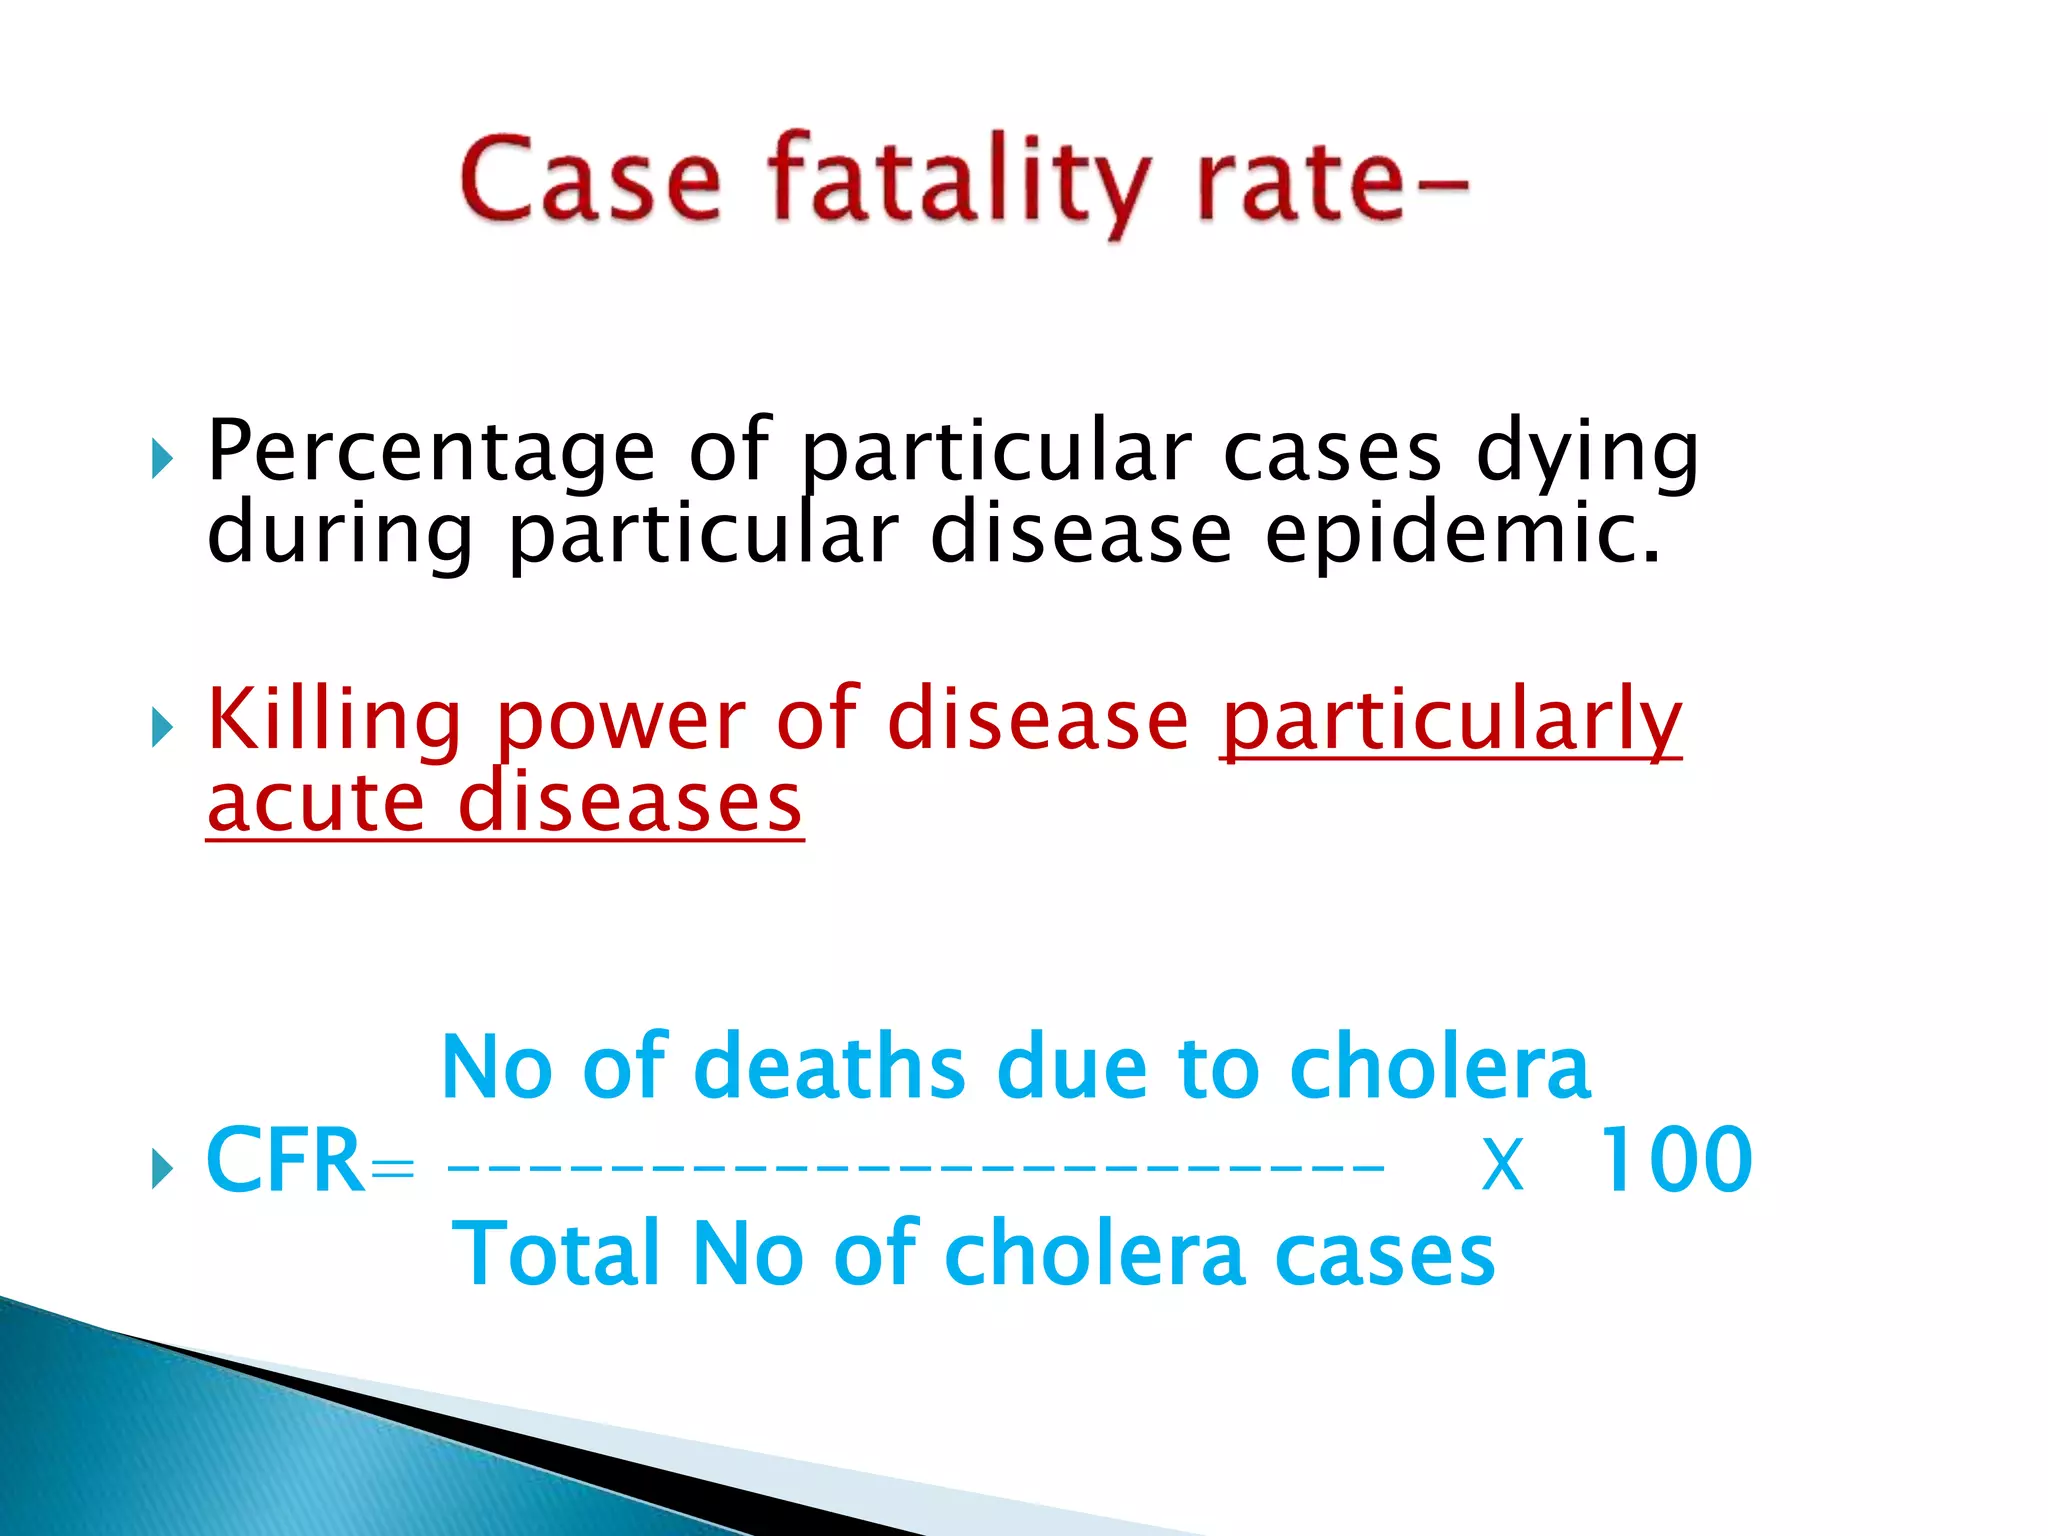
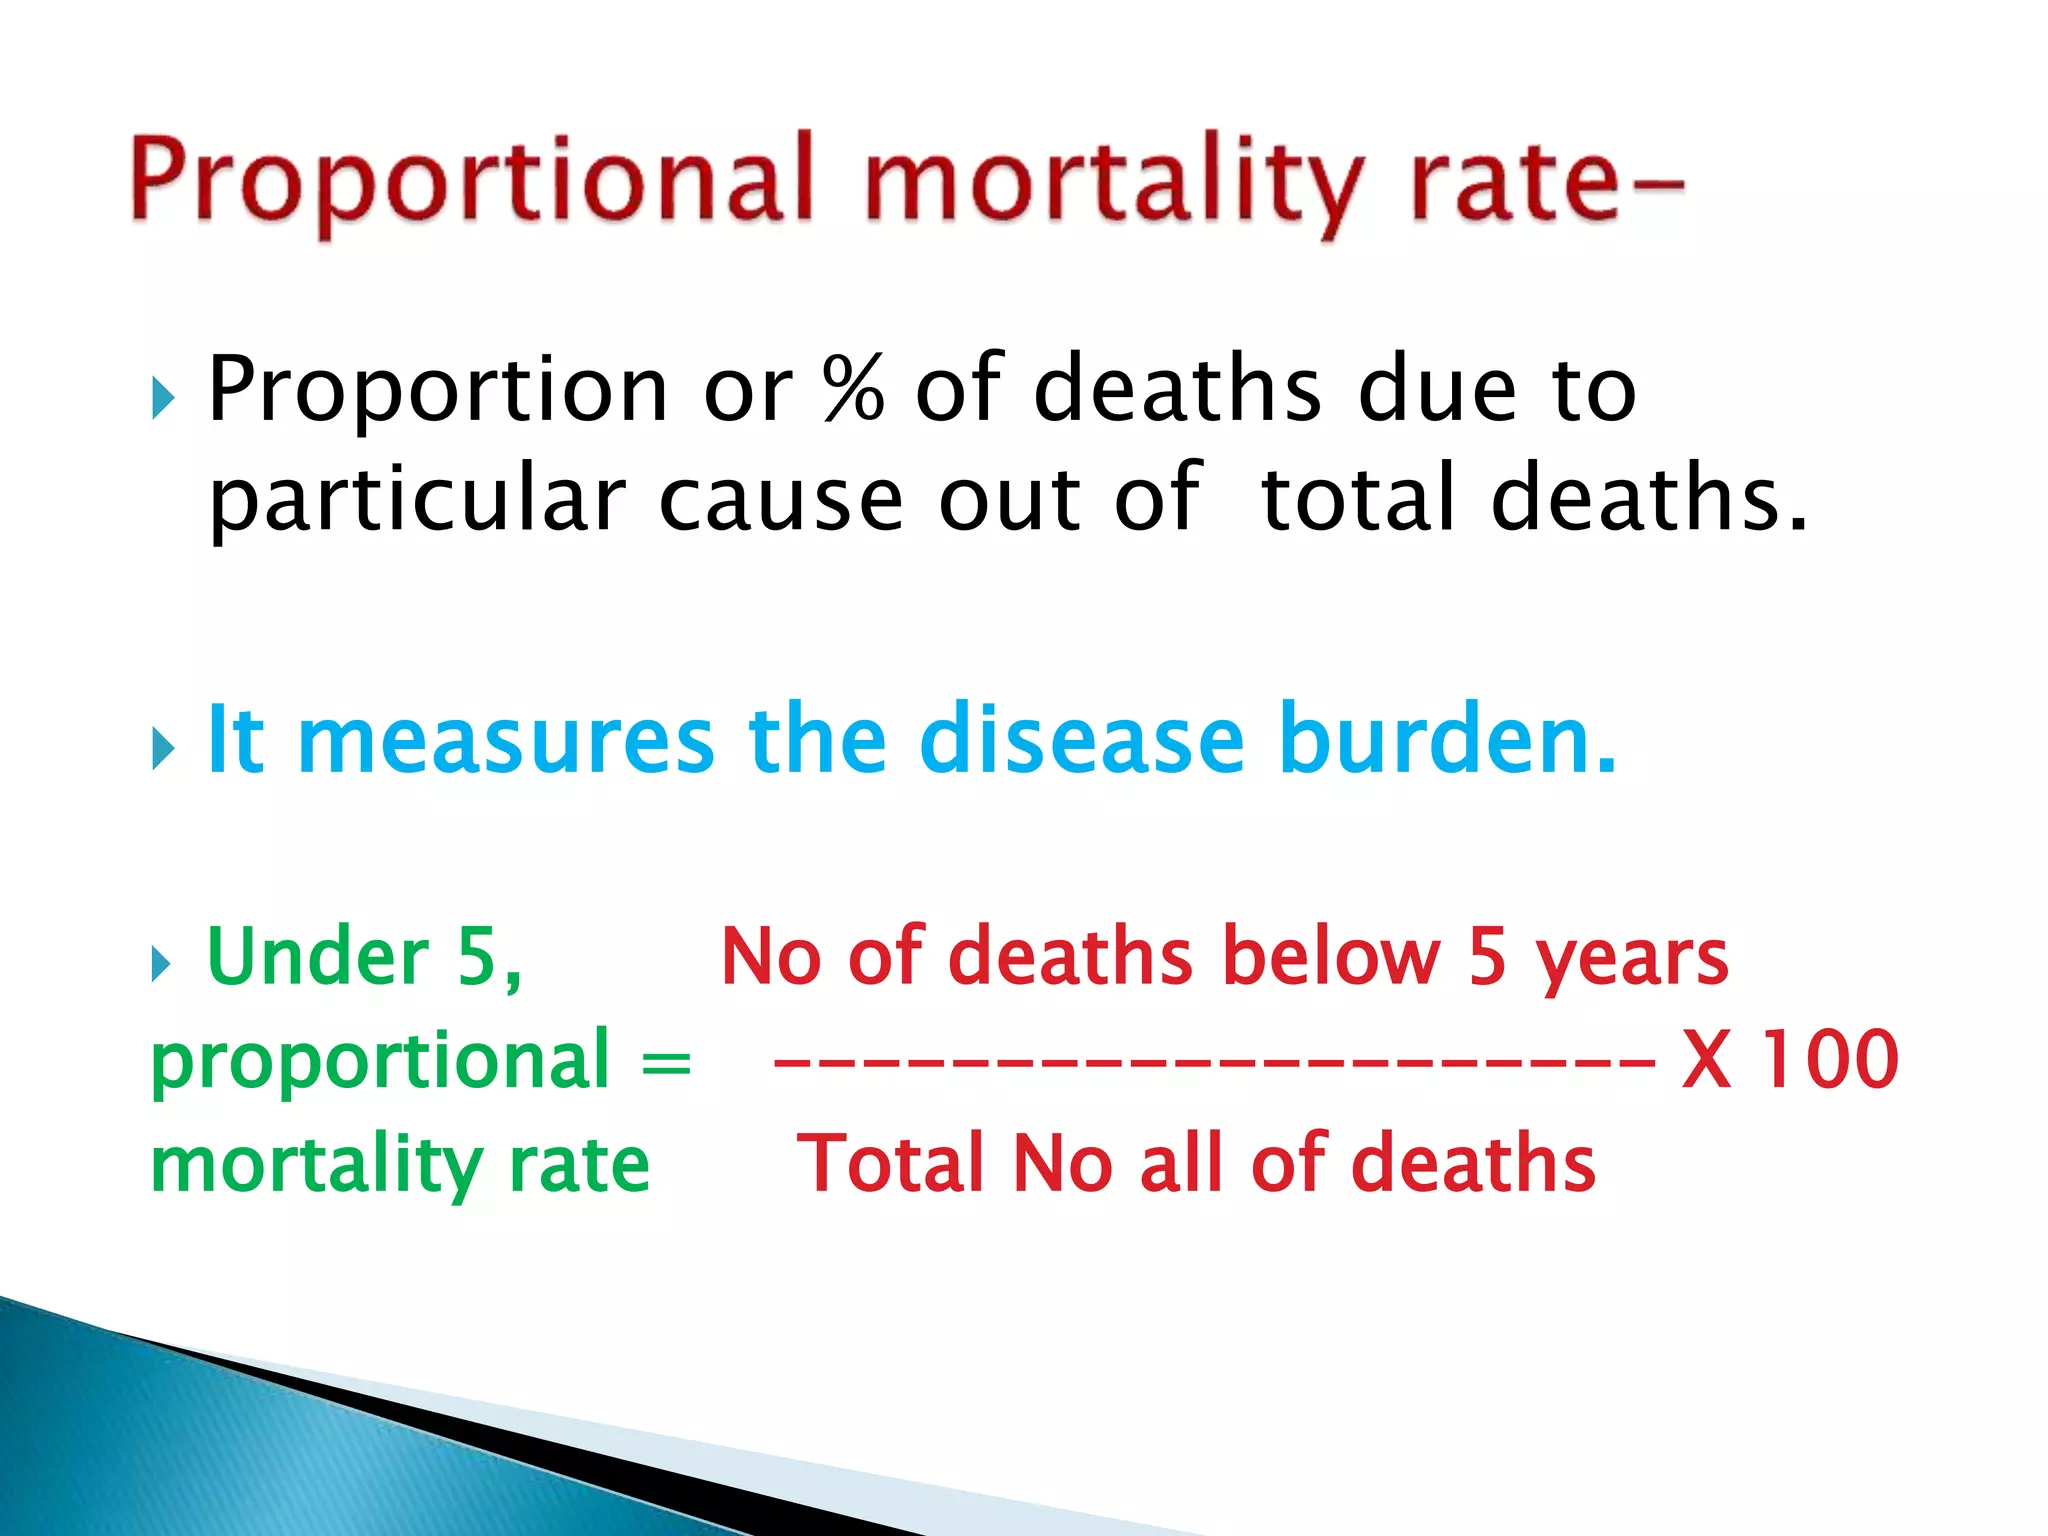

This document discusses various epidemiological terms used to measure disease frequency and distribution in a population. It defines rate, ratio, and proportion as different ways of comparing two quantities, with rate expressing the occurrence of an event over time, ratio comparing the relative sizes or values of two quantities without a time component, and proportion expressing one quantity as a percentage of the whole. It also defines various epidemiological measures including incidence, prevalence, attack rate, case fatality rate, and different types of mortality rates.