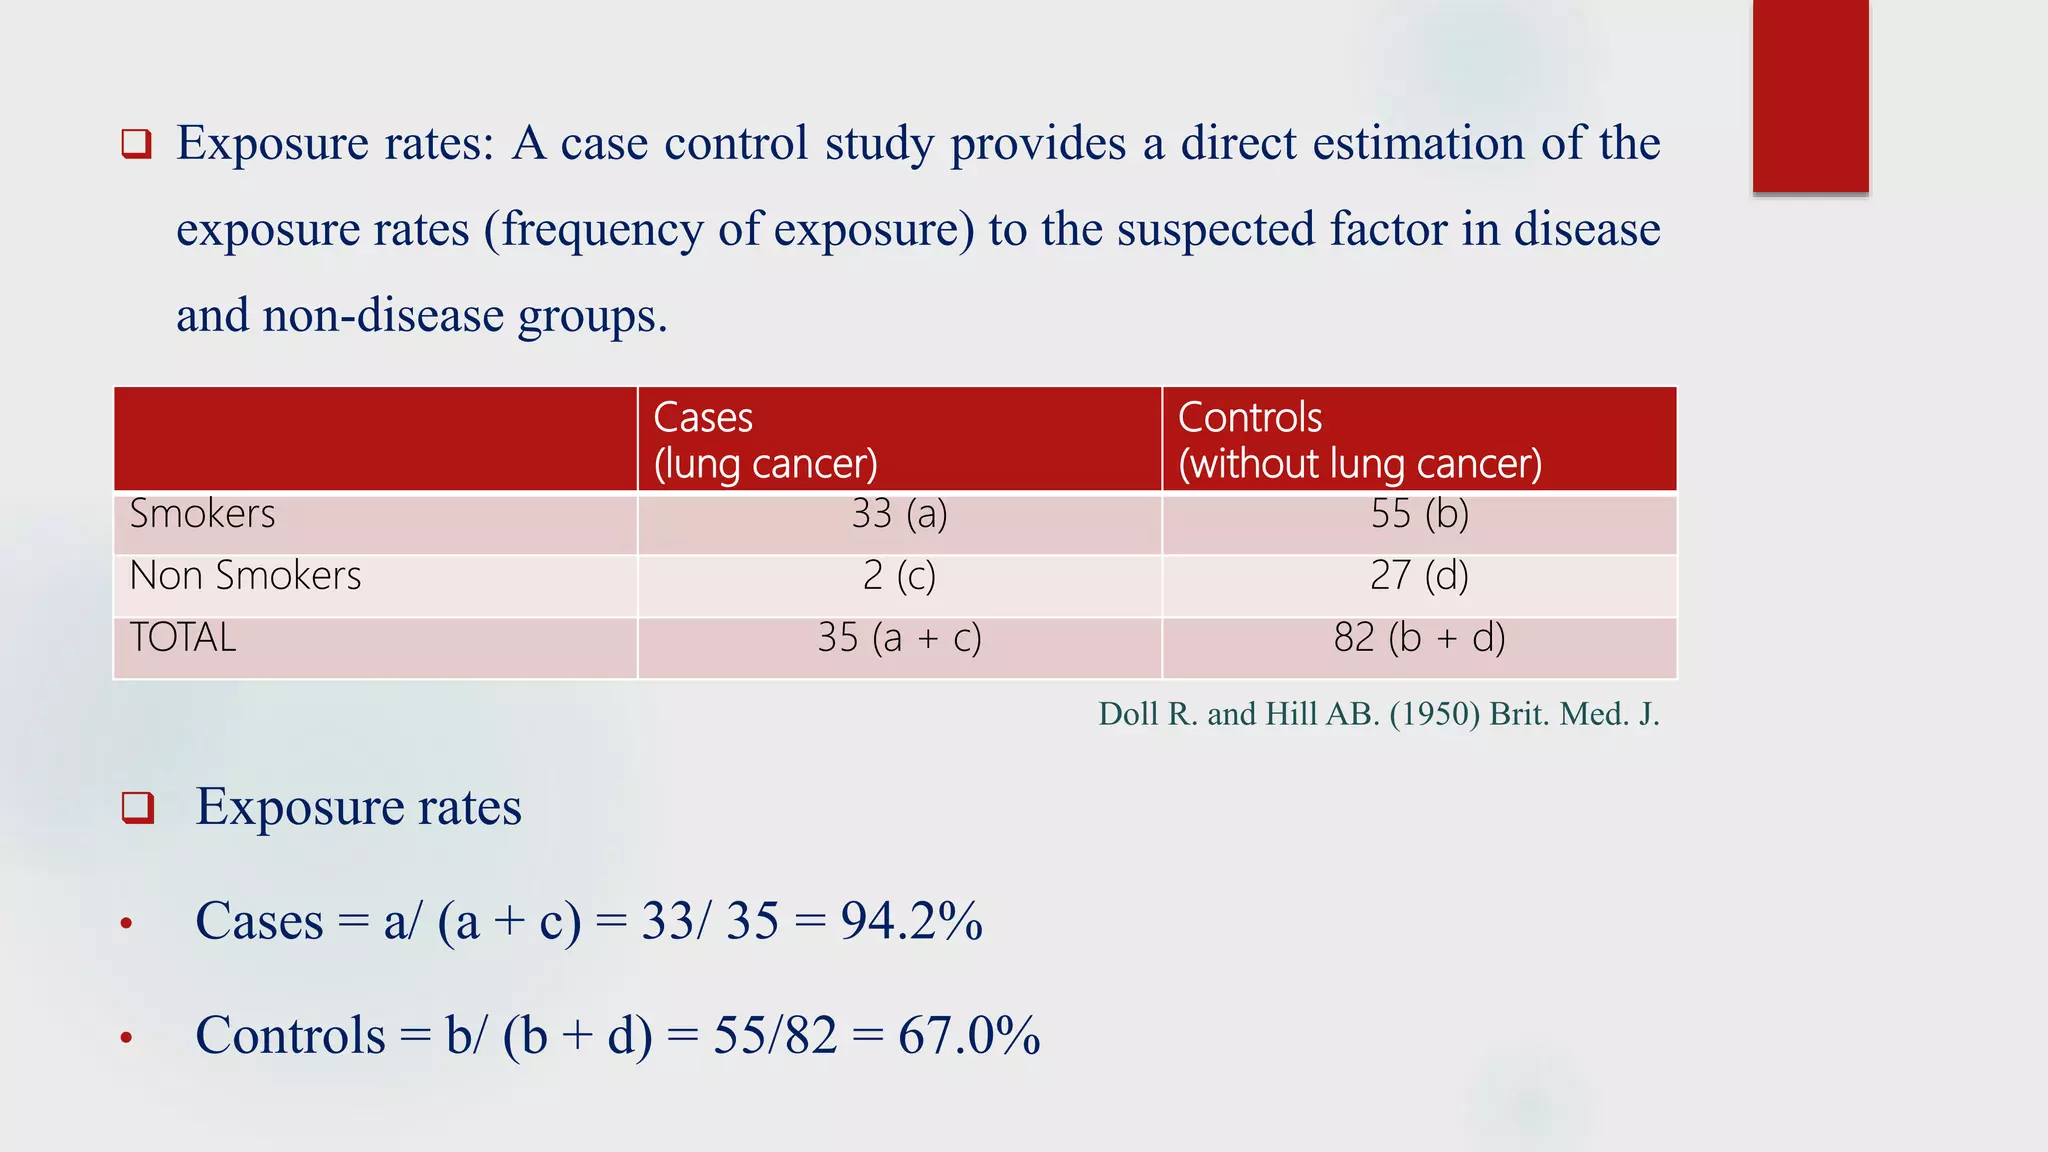
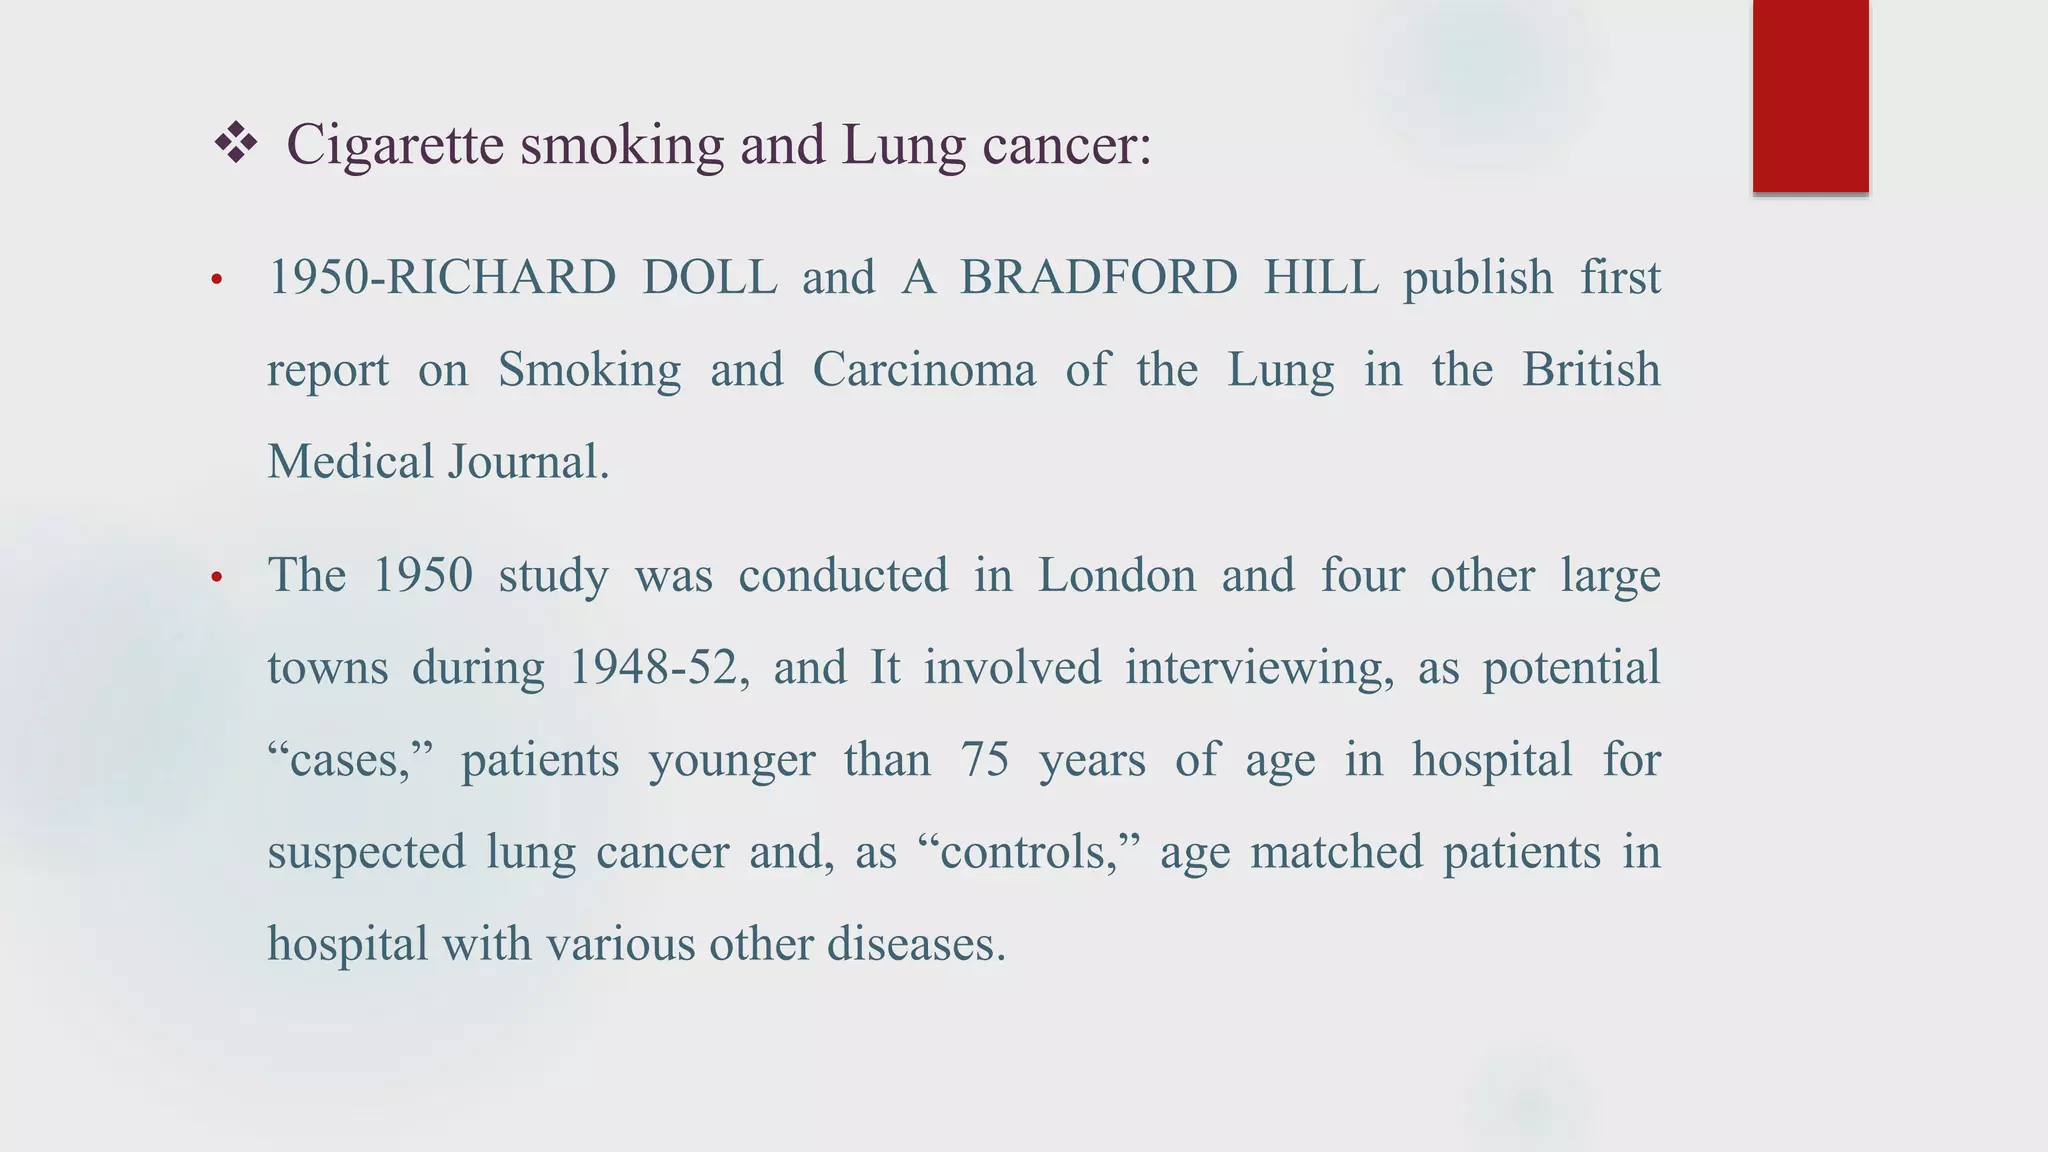
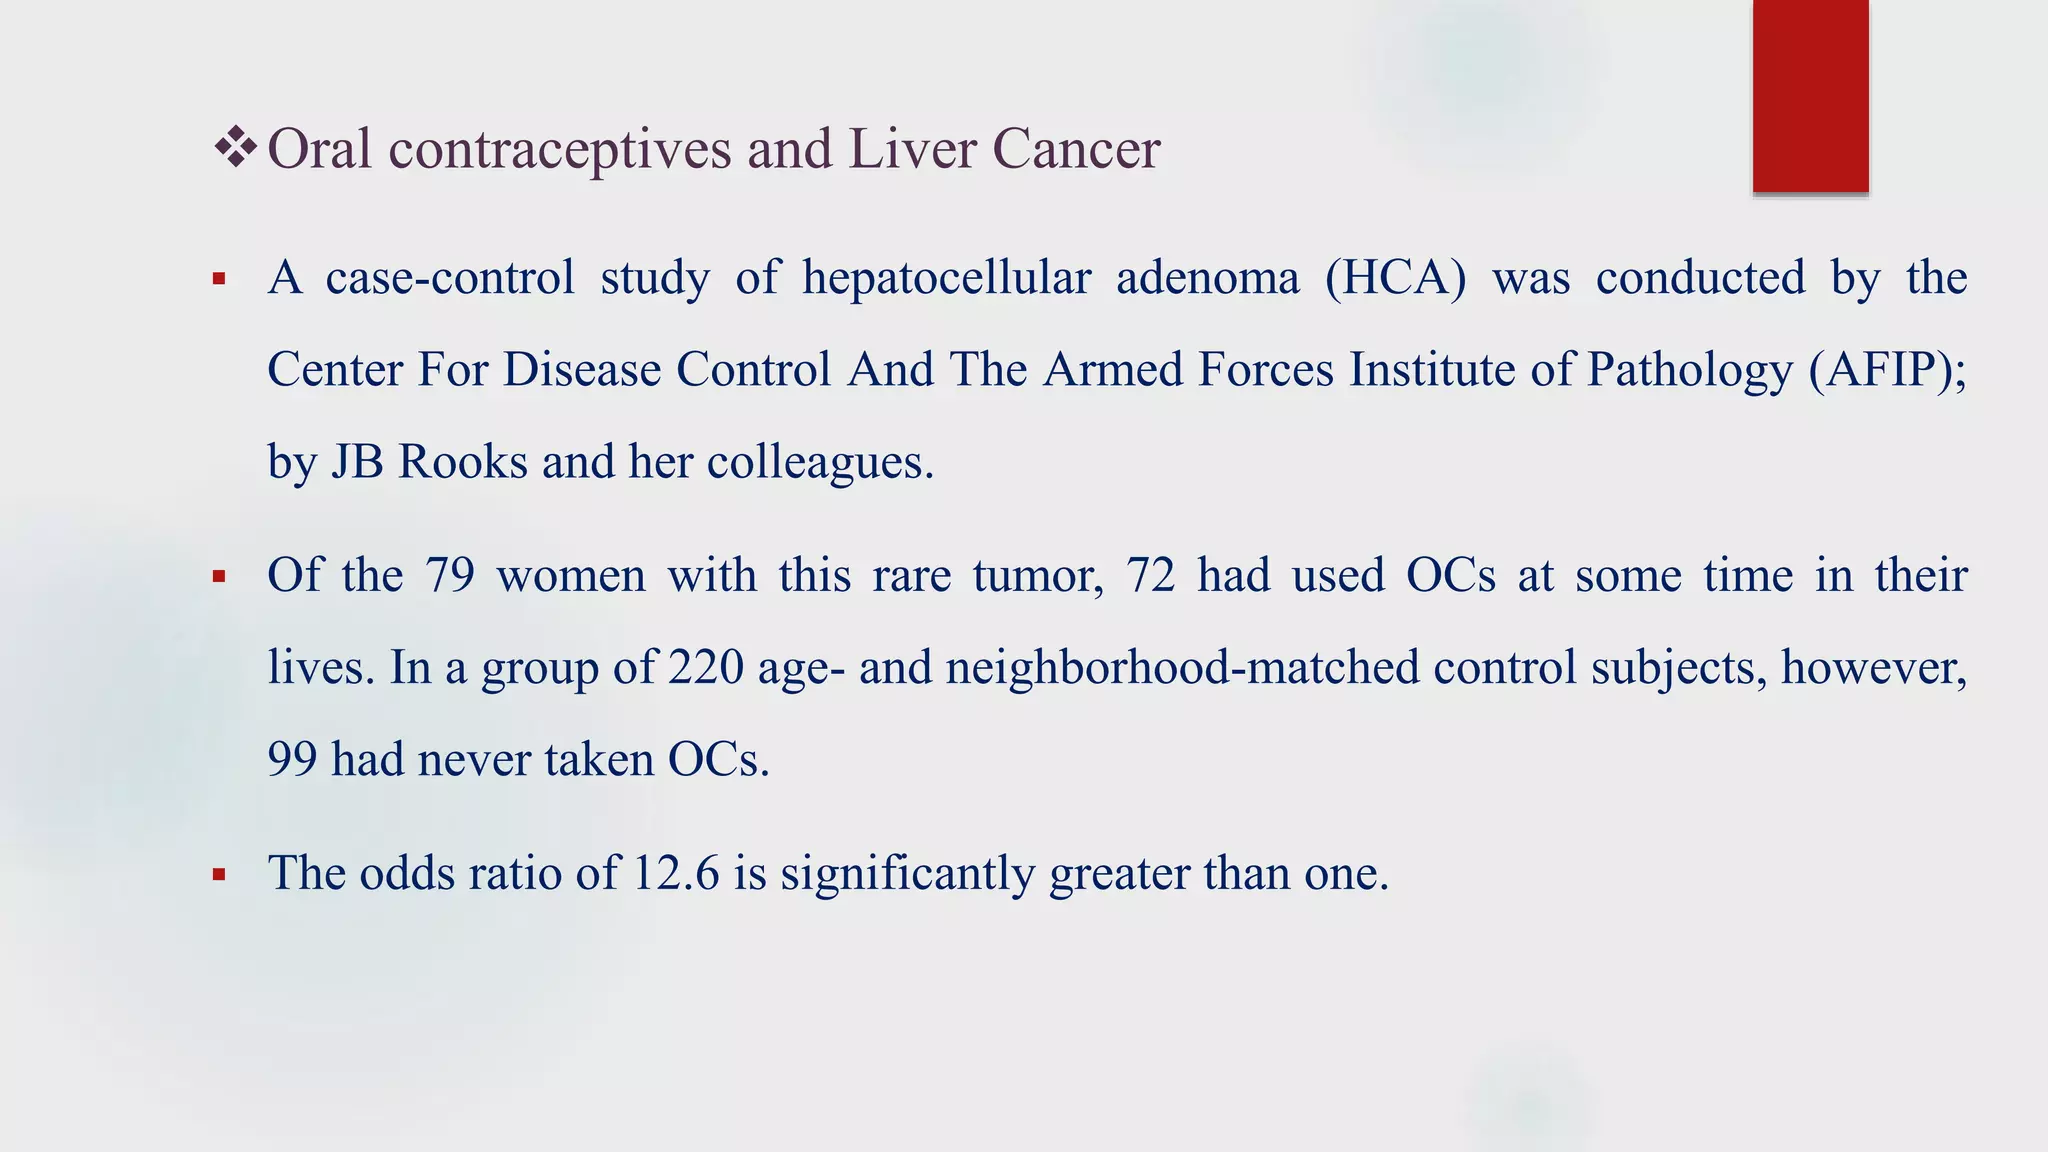
CASE CONTROL
STUDY
DR. ABHIJIT DAS
WHY
??
Dr. Alton Ochsner
Out line of presentation
 Epidemiological study cycle
 Case control study
 History
 Definition
 Design
 Outcomes
 Limitations
 Advantages
 Case crossover Study
 Classical Examples
BRIEF HISTORY
 Term was probably coined by Philip Sartwell.
 Concept found in works of Parisian physician P.C.A. Louis.
 First explicit description contained in a paper by William Augustus
Guy, who reported analysis of relation between prior occupational
exposure and occurrence of pulmonary consumption to The
Statistical Society of London in 1843.
Cont.
 First modern use of the method of Case Control Study reported by
Lane- Claypon in the study ‘A further report on cancer of the
breast.’ in 1926.
 The evolution of case control study thereafter has been described
by A.M. Lilienfield & D. Lilienfield in The Journal of Chronic
Disease in 1979.
Cont.
 1950 - Four studies that implicated cigarette smoking in cancer of
the lung published in 1950 in the United States (Levin et al 1950;
Wynder & Graham 1950; Schrek et al. 1950) and in Britain (Doll &
Hill 1950), have established several features of the modern form of
the Case Control study.
 Doll & Hill’s study is perhaps the most well known in history.
DEFINITION
The observational epidemiologic study of persons with the disease (or
other outcome variable) of interest and a suitable control (comparison/
reference) group of persons without the disease.
(Dictionary of Epidemiology: 4th ed; John M Last. 2001)
 The past history of exposure to a suspected risk factor is compared
between ‘case’ and ‘control’, who resemble the case in such
respects as age & sex but do not have the disease.
 Case Control Study Synonyms:
• Case Comparison Study
• Case Compeer Study
• Case History Study
• Case Referent Study
• Retrospective Study
Design of Case Control Study
The investigator selects
Cases with the disease
And appropriate
Controls without the disease
And obtains
Data regarding past exposure to possible etiologic factors in
both groups.
The investigator then compares the frequency of exposure of the two groups.
 Hallmark of Case Control Study: Begins with people with disease (cases) and
compares them to people without disease (controls) and searches for exposure.
CASE
DISEASE
CONTROL
NO DISEASE
EXPOSED NOT EXPOSED EXPOSED NOT EXPOSED
FIRST SELECT
CASES CONTROLS
(WITH DISEASE) (WITHOUT DISEASE)
SECOND
Measure exposed a b
Exposure not exposed c d
Total a+c b+d
Proportions a b
Exposed a+c b+d
Four Steps
1. Selection of cases and controls.
2. Matching.
3. Measurement of Exposure.
4. Analysis and Interpretation.
Important Definitions
 CASE: A person in the population or study group identified as
having the particular disease, health disorder or condition under
investigation.
 CONTROL: Person or persons in a comparison group that differs,
in disease experience (or other health related outcome) in not
having the outcome being studied.
(Dictionary of Epidemiology: 4th ed; John M Last. 2001)
Cont.
 MATCHING: The process of selecting controls in a case-control
study so that the controls are similar to the cases with regard to
certain key characteristics—such as age, sex, race, socioeconomic
status and occupation.
 BIAS: Any systematic error in the design, conduct, or analysis of a
study that results in mistaken estimates of the effect of the exposure
on disease.
Cont.
 CONFOUNDING: When a measure of the effect of an exposure
on risk is distorted because of the association of exposure with
other factors that influence the outcome. It creates data where it is
not possible to separate the contribution that any single causal
factor has made an effect.
Selection of Cases:
 Two Specification:
• Diagnostic criteria- The diagnostic criteria of the disease and the stage of
disease, if any (e.g. , breast cancer Stage I) to be included in the study must be
specified before the study is undertaken.
• Eligibility Criteria- Incident cases are eligible than the Prevalent cases.
• Any risk factors we may identify in a study using prevent cases may be related
more to the survival with the disease than to the development of the disease
(incidence).
SELECTION OF CASES:
 SOURCES:
• Hospitals, patients in physician’s practice.
• General Population.
Selection of Control
case control
Total Population
Study Base
Cont.
 Similar to the cases in all respects other than having the disease, i.e.
Comparable.
 Should represent all non-diseased people in the population from
which the cases are selected, i.e. Representative.
 Representative in terms of probability of exposure to the risk factor.
Cont.
 Cases emerge within a study base. Controls should emerge from the
same study base, except that they are not cases.
 For example, if cases are selected exclusively from hospitalized
patients, controls must also be selected from hospitalized patients.
 Comparability is more important than representativeness in the
selection of controls.
Sources
Source Advantage Disadvantage
Hospital based Easily identified.
Available for interview.
More willing to cooperate.
Tend to give complete and
accurate information
( recall bias).
Not typical of general population.
Possess more risk factors for disease.
Some diseases may share risk factors
with disease under study.
(Berkesonian bias)
Population based
(registry cases)
Most representative of the
general population.
Generally healthy.
Time, money, energy.
Opportunity of exposure may not be
same as that of cases. (location, occupation,)
Neighborhood
controls/ Telephone
exchange random
dialing
Controls and cases similar
in residence.
Easier than sampling the
population.
Non cooperation.
Security issues.
Not representative of general
population.
Best friend control/
Sibling control
Accessible, Cooperative.
Similar to cases in most
aspects.
Overmatching.
 SELECTION OF CONTROLS : NUMBER
• Large study: cases: control :: 1:1
• Small study: cases: control :: 1:2, 1:3, 1:4.
• Use of multiple controls
Problems in control selection–Confounding variables.
 Confounding variables are factors associated with the exposure of interest
and causally with the disease of interest.
 May lead to a spurious/ biased relationship between risk factor and disease.
 Common confounding variables are : age, sex, educational status,
socioeconomic level, etc.
 These can be adjusted by :
 Designing the study through- Matching. Randomization. Restricting the
variable.
Matching:
 The process of selecting the controls so that they are similar to the
cases in certain characteristics, such as age, race, sex,
socioeconomic status, and occupation.
(Gordis Epidemiology; 6th ed)
 Matching may be of two types: (1) group matching and (2)
individual matching.
 Group matching / Frequency matching- Consists of selecting the controls in such a
manner that the proportion of controls with a certain characteristic is identical to the
proportion of cases with the same characteristic.
 E.g. If 25% of the cases are married, the controls will be selected so that 25% of that
group is also married.
 Individual matching / Matched pairs- In this approach, for each case selected for the
study, a control is selected who is similar to the case in terms of the specific variable or
variables of concern.
Problems of Matching:
 Practical problems with matching: If an attempt is made to match
according to too many characteristics, it may prove difficult or impossible
to identify an appropriate control.
 Conceptual Problems With Matching: once we have matched controls to
cases according to a given characteristic, we can not study that
characteristic.
Bias in case control study
Any systematic error in the design, conduct, or analysis of a study that
results in mistaken estimates of the effect of the exposure on disease.
 Types of bias in case control studies:
 Selection bias.
 Information bias.
 Confounding bias.
Selection Bias:
• May not be the representative of general population.
• Incomplete ascertainment of cases (detection or diagnostic bias).
• Inappropriate control group.
• Survivorship Bias : Generally takes the patients who are living. Cases
who have died are generally not taken and these may be systematically
very different from living case as regards the exposure status.
• Berksonian Bias : The probability of admission to hospital or detection
of the outcome (disease) may be more among the cases simply because
of the exposure.
Information Bias:
 Occurs due to -
• Imperfect definitions of study variables.
• Or
• Flawed data collection procedures.
 Types-
• Recall bias.
• Interviewer bias.
Recall Bias
• Also known as rumination bias, termed by Ernst Wynder.
• Cases who are aware of their disease status may be more likely to
recall exposures than controls.
• e.g. congenital malformation with prenatal infections.
Interviewer bias:
 When interviewer is not blinded (knows) case status of subjects
there is potential for interviewer bias.
 This type of bias can be eliminated by double-blinding.
Confounding Bias:
 From confounder, i.e. to mix together.
 When a measure of the effect of a exposure on risk is distorted because of the
association of exposure with other factors that influence the outcome.
 Not possible to separate the contribution that any single causal factor has made.
 E.g.: Alcohol & Esophageal Ca ; confounding factor-smoking.
 Solution: Study design : Matching. smoking
Ca esophagus
alcohol
Outcomes
 On analysis of case control study we find out
• Exposure rates: the frequency of exposure to suspected risk factor
in cases and in controls.
• Estimation of disease risk associated with exposure: (Odds ratio).
 Exposure rates: A case control study provides a direct estimation of the
exposure rates (frequency of exposure) to the suspected factor in disease
and non-disease groups.
Doll R. and Hill AB. (1950) Brit. Med. J.
 Exposure rates
• Cases = a/ (a + c) = 33/ 35 = 94.2%
• Controls = b/ (b + d) = 55/82 = 67.0%
Cases
(lung cancer)
Controls
(without lung cancer)
Smokers 33 (a) 55 (b)
Non Smokers 2 (c) 27 (d)
TOTAL 35 (a + c) 82 (b + d)
 Odds Ratio / Relative Odds (Estimate of Relative Risk).
• Odds: Odds of an event is defined as the ratio of the number of
ways an event can occur to the number of ways an event cannot
occur.
• If the probability of event X occurring is P, then odds of it
occurring is = P/ 1-P.
 Odds ratio: Ratio of the odds that the cases were exposed to the
odds that the controls were exposed.
Odds ratio:
Using the four-fold table –
Odds Ratio =
𝑂𝑑𝑑𝑠 𝑡ℎ𝑎𝑡 𝑐𝑎𝑠𝑒 𝑤𝑎𝑠 𝑒𝑥𝑝𝑜𝑠𝑒𝑑
𝑂𝑑𝑑𝑠 𝑡ℎ𝑎𝑡 𝑐𝑜𝑛𝑡𝑟𝑜𝑙 𝑤𝑎𝑠 𝑒𝑥𝑝𝑜𝑠𝑒𝑑
=
(
𝑎
𝑐
)
(
𝑏
𝑑
)
= ad/bc
Diseased/ Cases Not diseased/
Controls
Exposed a b
Not exposed c d
 Odds ratio ( = cross products ratio) can also be viewed as the ratio
of the product of the two cells that support the hypothesis of an
association (cells a & d – diseased people who were exposed and
non diseased people who were not exposed), to the product of the
two cells which negate the hypothesis of an association (cells b & c
– non diseased people who were exposed and diseased People who
were not exposed).
The derivation of odds ratio is based on three assumptions :
1.Disease being investigated must be relatively rare.
2. The cases must be representative of those with the disease.
3. The controls must be representative of those without the disease.
Interpretation of odds ratio:
 OR=1; Exposure is not related to disease.
 OR>1; Exposure is related to disease.
 OR<1; Exposure is protective against disease.
Limitation / Disadvantages:
 Not suitable for rare exposure.
 Susceptible to bias if not carefully designed.
 Especially susceptible to recall bias.
 Restricted to single outcome.
 Incidence rates not usually calculated.
 Cannot assess effects of matching variables.
Advantages
 Only realistic study design for uncovering etiology in rare diseases.
 Efficient for the study of chronic diseases.
 Require comparatively few subjects.
 Commonly used in outbreaks investigation.
 Tend to require a smaller sample size than other designs.
 Relatively inexpensive.
Case Crossover Design
 Primarily used for studying the etiology of acute outcomes.
 Both case & control information taken from same person; i.e. each
case serves as his or her own control.
 Also referred as “case only study” .
 Exposure is ascertained for short period preceding the event and
compared with ‘control’ period more remote to the event.
Classical Examples:
 Adenocarcinoma of vagina
• 7 young girls (15-22 years) were treated for adenocarcinoma at the Vincent
Memorial Hospital, Boston between 1966 & 1969.
• 8th case occurred in 1969 in a 20 year old patient who was treated at another
Boston hospital in USA.
• Arthur L. Herbst and 2 of his colleagues investigated the cause of this tumor
by case control study in 1971.
 As this was a rare disease, for each case, four matched controls were put
up.
 The controls were identified from the birth records from New England
hospitals between 1946 & 1951.
• Information was collected by personal interviews regarding (a) maternal
age (b) maternal smoking (c) antenatal radiology, and (d) diethyl-
stilbestrol (DES) exposure in foetal life.
• 7 cases were exposed to DES in foetal life
• Their mother were given this drug to prevent miscarriage in pregnancy
while none of the mothers in control group were given this drug.
 Oral contraceptives and thromboembolic disease
• By August 1965, the British Committee on Safety of Drugs had received 249
reports of adverse reactions and 16 reports of death in women taking oral
contraceptives.
• In 1968 and 1969; M.P. Vessey and Ricard Doll reported the findings of their case
control studies; they interviewed women admitted with venous thrombosis or pulm.
embolism without medical cause and compared the history from other women
patient from same hospital with other disease.
 They found 50% of those with venous thrombosis or pulmonary
embolism had been using OCP, compared with 14% of controls.
 Concluded that users of Oral contraceptives were about 6 times as
likely as non-users to develop thromboembolic disease.
Thalidomide tragedy
 Thalidomide was used as a safe hypnotic in 1960s.
 1961: birth of babies with congenital malformation in UK, previously rare.
 Case control study of 46 mothers who delivered deformed babies showed
that 41 were found to have thalidomide in their early pregnancy.
 Compared to 300 mothers who delivered normal babies but their was no
thalidomide exposure.
 Cigarette smoking and Lung cancer:
• 1950-RICHARD DOLL and A BRADFORD HILL publish first
report on Smoking and Carcinoma of the Lung in the British
Medical Journal.
• The 1950 study was conducted in London and four other large
towns during 1948-52, and It involved interviewing, as potential
“cases,” patients younger than 75 years of age in hospital for
suspected lung cancer and, as “controls,” age matched patients in
hospital with various other diseases.
Oral contraceptives and Liver Cancer
 A case-control study of hepatocellular adenoma (HCA) was conducted by the
Center For Disease Control And The Armed Forces Institute of Pathology (AFIP);
by JB Rooks and her colleagues.
 Of the 79 women with this rare tumor, 72 had used OCs at some time in their
lives. In a group of 220 age- and neighborhood-matched control subjects, however,
99 had never taken OCs.
 The odds ratio of 12.6 is significantly greater than one.
References:
1. John M Last, A Dictionary Of Epidemiology, 4th edition.
2. K. Park, Park's Textbook Of Preventive And Social Medicine, M/S Banarsidas Bhanot Publishers,25TH
edition,2019.
3. Gordis Epidemiology, Elsevier, 6th edition.
4. Origins and early development of the case-control study: part 1, Early evolution, Nigel Paneth, Ezra
Susser, Mervyn Susser. Available from www.epidemiology.ch/history/papers.
5. Robert B. Wallace, Wallace/Maxcy-Rosenau-Last, Public Health & Preventive Medicine, McGrawHill
Medical, 15TH edition.
6. Oxford Textbook of Global Public Health, Oxford University Press, 6th edition.
7. AM Kadri, IAPSM’S Textbook Of Community Medicine, Jaypee Brothers Medical Publishers,1ST
edition,2019
Thank You

Case control study

  • 1.
  • 2.
  • 3.
    Out line ofpresentation  Epidemiological study cycle  Case control study  History  Definition  Design  Outcomes  Limitations  Advantages  Case crossover Study  Classical Examples
  • 5.
    BRIEF HISTORY  Termwas probably coined by Philip Sartwell.  Concept found in works of Parisian physician P.C.A. Louis.  First explicit description contained in a paper by William Augustus Guy, who reported analysis of relation between prior occupational exposure and occurrence of pulmonary consumption to The Statistical Society of London in 1843.
  • 6.
    Cont.  First modernuse of the method of Case Control Study reported by Lane- Claypon in the study ‘A further report on cancer of the breast.’ in 1926.  The evolution of case control study thereafter has been described by A.M. Lilienfield & D. Lilienfield in The Journal of Chronic Disease in 1979.
  • 7.
    Cont.  1950 -Four studies that implicated cigarette smoking in cancer of the lung published in 1950 in the United States (Levin et al 1950; Wynder & Graham 1950; Schrek et al. 1950) and in Britain (Doll & Hill 1950), have established several features of the modern form of the Case Control study.  Doll & Hill’s study is perhaps the most well known in history.
  • 8.
    DEFINITION The observational epidemiologicstudy of persons with the disease (or other outcome variable) of interest and a suitable control (comparison/ reference) group of persons without the disease. (Dictionary of Epidemiology: 4th ed; John M Last. 2001)
  • 9.
     The pasthistory of exposure to a suspected risk factor is compared between ‘case’ and ‘control’, who resemble the case in such respects as age & sex but do not have the disease.  Case Control Study Synonyms: • Case Comparison Study • Case Compeer Study • Case History Study • Case Referent Study • Retrospective Study
  • 10.
    Design of CaseControl Study The investigator selects Cases with the disease And appropriate Controls without the disease And obtains Data regarding past exposure to possible etiologic factors in both groups. The investigator then compares the frequency of exposure of the two groups.
  • 11.
     Hallmark ofCase Control Study: Begins with people with disease (cases) and compares them to people without disease (controls) and searches for exposure. CASE DISEASE CONTROL NO DISEASE EXPOSED NOT EXPOSED EXPOSED NOT EXPOSED
  • 12.
    FIRST SELECT CASES CONTROLS (WITHDISEASE) (WITHOUT DISEASE) SECOND Measure exposed a b Exposure not exposed c d Total a+c b+d Proportions a b Exposed a+c b+d
  • 13.
    Four Steps 1. Selectionof cases and controls. 2. Matching. 3. Measurement of Exposure. 4. Analysis and Interpretation.
  • 14.
    Important Definitions  CASE:A person in the population or study group identified as having the particular disease, health disorder or condition under investigation.  CONTROL: Person or persons in a comparison group that differs, in disease experience (or other health related outcome) in not having the outcome being studied. (Dictionary of Epidemiology: 4th ed; John M Last. 2001)
  • 15.
    Cont.  MATCHING: Theprocess of selecting controls in a case-control study so that the controls are similar to the cases with regard to certain key characteristics—such as age, sex, race, socioeconomic status and occupation.  BIAS: Any systematic error in the design, conduct, or analysis of a study that results in mistaken estimates of the effect of the exposure on disease.
  • 16.
    Cont.  CONFOUNDING: Whena measure of the effect of an exposure on risk is distorted because of the association of exposure with other factors that influence the outcome. It creates data where it is not possible to separate the contribution that any single causal factor has made an effect.
  • 17.
    Selection of Cases: Two Specification: • Diagnostic criteria- The diagnostic criteria of the disease and the stage of disease, if any (e.g. , breast cancer Stage I) to be included in the study must be specified before the study is undertaken. • Eligibility Criteria- Incident cases are eligible than the Prevalent cases. • Any risk factors we may identify in a study using prevent cases may be related more to the survival with the disease than to the development of the disease (incidence).
  • 18.
    SELECTION OF CASES: SOURCES: • Hospitals, patients in physician’s practice. • General Population.
  • 19.
    Selection of Control casecontrol Total Population Study Base
  • 20.
    Cont.  Similar tothe cases in all respects other than having the disease, i.e. Comparable.  Should represent all non-diseased people in the population from which the cases are selected, i.e. Representative.  Representative in terms of probability of exposure to the risk factor.
  • 21.
    Cont.  Cases emergewithin a study base. Controls should emerge from the same study base, except that they are not cases.  For example, if cases are selected exclusively from hospitalized patients, controls must also be selected from hospitalized patients.  Comparability is more important than representativeness in the selection of controls.
  • 22.
    Sources Source Advantage Disadvantage Hospitalbased Easily identified. Available for interview. More willing to cooperate. Tend to give complete and accurate information ( recall bias). Not typical of general population. Possess more risk factors for disease. Some diseases may share risk factors with disease under study. (Berkesonian bias) Population based (registry cases) Most representative of the general population. Generally healthy. Time, money, energy. Opportunity of exposure may not be same as that of cases. (location, occupation,) Neighborhood controls/ Telephone exchange random dialing Controls and cases similar in residence. Easier than sampling the population. Non cooperation. Security issues. Not representative of general population. Best friend control/ Sibling control Accessible, Cooperative. Similar to cases in most aspects. Overmatching.
  • 23.
     SELECTION OFCONTROLS : NUMBER • Large study: cases: control :: 1:1 • Small study: cases: control :: 1:2, 1:3, 1:4. • Use of multiple controls
  • 24.
    Problems in controlselection–Confounding variables.  Confounding variables are factors associated with the exposure of interest and causally with the disease of interest.  May lead to a spurious/ biased relationship between risk factor and disease.  Common confounding variables are : age, sex, educational status, socioeconomic level, etc.  These can be adjusted by :  Designing the study through- Matching. Randomization. Restricting the variable.
  • 25.
    Matching:  The processof selecting the controls so that they are similar to the cases in certain characteristics, such as age, race, sex, socioeconomic status, and occupation. (Gordis Epidemiology; 6th ed)  Matching may be of two types: (1) group matching and (2) individual matching.
  • 26.
     Group matching/ Frequency matching- Consists of selecting the controls in such a manner that the proportion of controls with a certain characteristic is identical to the proportion of cases with the same characteristic.  E.g. If 25% of the cases are married, the controls will be selected so that 25% of that group is also married.  Individual matching / Matched pairs- In this approach, for each case selected for the study, a control is selected who is similar to the case in terms of the specific variable or variables of concern.
  • 27.
    Problems of Matching: Practical problems with matching: If an attempt is made to match according to too many characteristics, it may prove difficult or impossible to identify an appropriate control.  Conceptual Problems With Matching: once we have matched controls to cases according to a given characteristic, we can not study that characteristic.
  • 28.
    Bias in casecontrol study Any systematic error in the design, conduct, or analysis of a study that results in mistaken estimates of the effect of the exposure on disease.  Types of bias in case control studies:  Selection bias.  Information bias.  Confounding bias.
  • 29.
    Selection Bias: • Maynot be the representative of general population. • Incomplete ascertainment of cases (detection or diagnostic bias). • Inappropriate control group. • Survivorship Bias : Generally takes the patients who are living. Cases who have died are generally not taken and these may be systematically very different from living case as regards the exposure status. • Berksonian Bias : The probability of admission to hospital or detection of the outcome (disease) may be more among the cases simply because of the exposure.
  • 30.
    Information Bias:  Occursdue to - • Imperfect definitions of study variables. • Or • Flawed data collection procedures.  Types- • Recall bias. • Interviewer bias.
  • 31.
    Recall Bias • Alsoknown as rumination bias, termed by Ernst Wynder. • Cases who are aware of their disease status may be more likely to recall exposures than controls. • e.g. congenital malformation with prenatal infections.
  • 32.
    Interviewer bias:  Wheninterviewer is not blinded (knows) case status of subjects there is potential for interviewer bias.  This type of bias can be eliminated by double-blinding.
  • 33.
    Confounding Bias:  Fromconfounder, i.e. to mix together.  When a measure of the effect of a exposure on risk is distorted because of the association of exposure with other factors that influence the outcome.  Not possible to separate the contribution that any single causal factor has made.  E.g.: Alcohol & Esophageal Ca ; confounding factor-smoking.  Solution: Study design : Matching. smoking Ca esophagus alcohol
  • 34.
    Outcomes  On analysisof case control study we find out • Exposure rates: the frequency of exposure to suspected risk factor in cases and in controls. • Estimation of disease risk associated with exposure: (Odds ratio).
  • 35.
     Exposure rates:A case control study provides a direct estimation of the exposure rates (frequency of exposure) to the suspected factor in disease and non-disease groups. Doll R. and Hill AB. (1950) Brit. Med. J.  Exposure rates • Cases = a/ (a + c) = 33/ 35 = 94.2% • Controls = b/ (b + d) = 55/82 = 67.0% Cases (lung cancer) Controls (without lung cancer) Smokers 33 (a) 55 (b) Non Smokers 2 (c) 27 (d) TOTAL 35 (a + c) 82 (b + d)
  • 36.
     Odds Ratio/ Relative Odds (Estimate of Relative Risk). • Odds: Odds of an event is defined as the ratio of the number of ways an event can occur to the number of ways an event cannot occur. • If the probability of event X occurring is P, then odds of it occurring is = P/ 1-P.  Odds ratio: Ratio of the odds that the cases were exposed to the odds that the controls were exposed.
  • 37.
    Odds ratio: Using thefour-fold table – Odds Ratio = 𝑂𝑑𝑑𝑠 𝑡ℎ𝑎𝑡 𝑐𝑎𝑠𝑒 𝑤𝑎𝑠 𝑒𝑥𝑝𝑜𝑠𝑒𝑑 𝑂𝑑𝑑𝑠 𝑡ℎ𝑎𝑡 𝑐𝑜𝑛𝑡𝑟𝑜𝑙 𝑤𝑎𝑠 𝑒𝑥𝑝𝑜𝑠𝑒𝑑 = ( 𝑎 𝑐 ) ( 𝑏 𝑑 ) = ad/bc Diseased/ Cases Not diseased/ Controls Exposed a b Not exposed c d
  • 38.
     Odds ratio( = cross products ratio) can also be viewed as the ratio of the product of the two cells that support the hypothesis of an association (cells a & d – diseased people who were exposed and non diseased people who were not exposed), to the product of the two cells which negate the hypothesis of an association (cells b & c – non diseased people who were exposed and diseased People who were not exposed).
  • 39.
    The derivation ofodds ratio is based on three assumptions : 1.Disease being investigated must be relatively rare. 2. The cases must be representative of those with the disease. 3. The controls must be representative of those without the disease.
  • 40.
    Interpretation of oddsratio:  OR=1; Exposure is not related to disease.  OR>1; Exposure is related to disease.  OR<1; Exposure is protective against disease.
  • 41.
    Limitation / Disadvantages: Not suitable for rare exposure.  Susceptible to bias if not carefully designed.  Especially susceptible to recall bias.  Restricted to single outcome.  Incidence rates not usually calculated.  Cannot assess effects of matching variables.
  • 42.
    Advantages  Only realisticstudy design for uncovering etiology in rare diseases.  Efficient for the study of chronic diseases.  Require comparatively few subjects.  Commonly used in outbreaks investigation.  Tend to require a smaller sample size than other designs.  Relatively inexpensive.
  • 43.
    Case Crossover Design Primarily used for studying the etiology of acute outcomes.  Both case & control information taken from same person; i.e. each case serves as his or her own control.  Also referred as “case only study” .  Exposure is ascertained for short period preceding the event and compared with ‘control’ period more remote to the event.
  • 44.
    Classical Examples:  Adenocarcinomaof vagina • 7 young girls (15-22 years) were treated for adenocarcinoma at the Vincent Memorial Hospital, Boston between 1966 & 1969. • 8th case occurred in 1969 in a 20 year old patient who was treated at another Boston hospital in USA. • Arthur L. Herbst and 2 of his colleagues investigated the cause of this tumor by case control study in 1971.
  • 45.
     As thiswas a rare disease, for each case, four matched controls were put up.  The controls were identified from the birth records from New England hospitals between 1946 & 1951. • Information was collected by personal interviews regarding (a) maternal age (b) maternal smoking (c) antenatal radiology, and (d) diethyl- stilbestrol (DES) exposure in foetal life. • 7 cases were exposed to DES in foetal life • Their mother were given this drug to prevent miscarriage in pregnancy while none of the mothers in control group were given this drug.
  • 46.
     Oral contraceptivesand thromboembolic disease • By August 1965, the British Committee on Safety of Drugs had received 249 reports of adverse reactions and 16 reports of death in women taking oral contraceptives. • In 1968 and 1969; M.P. Vessey and Ricard Doll reported the findings of their case control studies; they interviewed women admitted with venous thrombosis or pulm. embolism without medical cause and compared the history from other women patient from same hospital with other disease.
  • 47.
     They found50% of those with venous thrombosis or pulmonary embolism had been using OCP, compared with 14% of controls.  Concluded that users of Oral contraceptives were about 6 times as likely as non-users to develop thromboembolic disease.
  • 48.
    Thalidomide tragedy  Thalidomidewas used as a safe hypnotic in 1960s.  1961: birth of babies with congenital malformation in UK, previously rare.  Case control study of 46 mothers who delivered deformed babies showed that 41 were found to have thalidomide in their early pregnancy.  Compared to 300 mothers who delivered normal babies but their was no thalidomide exposure.
  • 49.
     Cigarette smokingand Lung cancer: • 1950-RICHARD DOLL and A BRADFORD HILL publish first report on Smoking and Carcinoma of the Lung in the British Medical Journal. • The 1950 study was conducted in London and four other large towns during 1948-52, and It involved interviewing, as potential “cases,” patients younger than 75 years of age in hospital for suspected lung cancer and, as “controls,” age matched patients in hospital with various other diseases.
  • 50.
    Oral contraceptives andLiver Cancer  A case-control study of hepatocellular adenoma (HCA) was conducted by the Center For Disease Control And The Armed Forces Institute of Pathology (AFIP); by JB Rooks and her colleagues.  Of the 79 women with this rare tumor, 72 had used OCs at some time in their lives. In a group of 220 age- and neighborhood-matched control subjects, however, 99 had never taken OCs.  The odds ratio of 12.6 is significantly greater than one.
  • 51.
    References: 1. John MLast, A Dictionary Of Epidemiology, 4th edition. 2. K. Park, Park's Textbook Of Preventive And Social Medicine, M/S Banarsidas Bhanot Publishers,25TH edition,2019. 3. Gordis Epidemiology, Elsevier, 6th edition. 4. Origins and early development of the case-control study: part 1, Early evolution, Nigel Paneth, Ezra Susser, Mervyn Susser. Available from www.epidemiology.ch/history/papers. 5. Robert B. Wallace, Wallace/Maxcy-Rosenau-Last, Public Health & Preventive Medicine, McGrawHill Medical, 15TH edition. 6. Oxford Textbook of Global Public Health, Oxford University Press, 6th edition. 7. AM Kadri, IAPSM’S Textbook Of Community Medicine, Jaypee Brothers Medical Publishers,1ST edition,2019
  • 52.