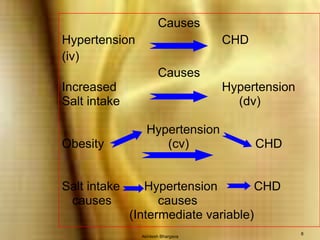
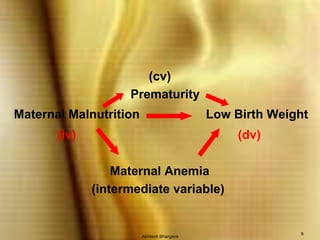
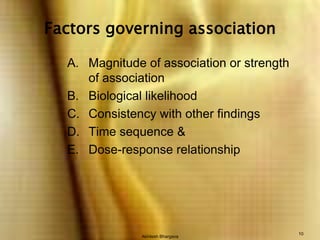
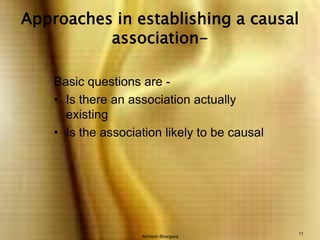
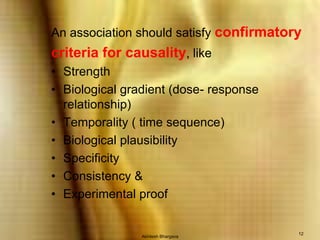
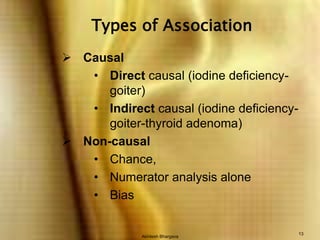
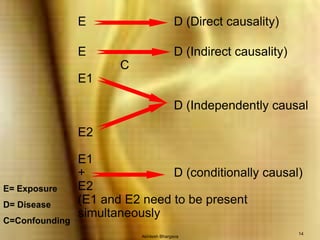
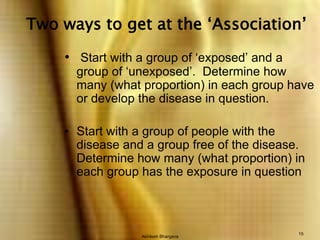
Causal Association : Cause To EffectDr. Akhilesh BhargavaMD, DHA, PGDHRMProf. Community Medicine &Director-SIHFW, Jaipur
Akhilesh Bhargava2Measure of Association-ConceptsIf ‘more’ disease occurs in a group that smokes compared to the group that does not smoke, there is an ‘association’ between the disease and smokingIf ‘more’ disease occurs in Hindus than in Muslims, there is an ‘association’ between the disease and raceIf ‘more’ lung cancer deaths occur in certain occupations than others, there is an ‘association’ between occupational exposure characteristics and lung cancer
Akhilesh Bhargava3Why study association?Is the first step in establishing a hypothesized causal relationshipAssociation by itself does not implicate causation
Akhilesh Bhargava4From Association to CausationDoes the association make biologic sense?An isolated study or, many studies in different populations find a similar association?Does the association support a dose response, i.e., more exposure is associated with more disease?
Akhilesh Bhargava5All epidemiological hypotheses is based on the concept of association between exposure & diseasePrimary objective is to see whether an association is causal or not.  Presence of an association in no way implies that the relationship is that of a cause & effect.The association means a statistical dependence between two variables i.e. when a change in one variable parallels or coincides with the change in other variable
Akhilesh Bhargava6   a relationship between cause & effect may not be always a causal one, for the reason that    Bias,    Chance &    Confounding may under or over play the association
Akhilesh Bhargava7The variable in an association are-Dependent (dv)Independent (iv)Confounding (cv)Intermediate (im.v)
Akhilesh Bhargava8CausesHypertension			CHD(iv)				CausesIncreased				HypertensionSalt intake				     (dv)			      HypertensionObesity 		   (cv)	                   CHDSalt intake       Hypertension		CHD    causes  		causes			 (Intermediate variable)
Akhilesh Bhargava9					  (cv)				      PrematurityMaternal Malnutrition	Low Birth Weight(iv)						(dv)	Maternal Anemia			    (intermediate variable)
Akhilesh Bhargava10Factors governing associationMagnitude of association or strength       of associationB.	Biological likelihood C.	Consistency with other findingsD.	Time sequence &E.	Dose-response relationship
Akhilesh Bhargava11Approaches in establishing a causal association-Basic questions are -Is there an association actually existingIs the association likely to be causal
Akhilesh Bhargava12An association should satisfy confirmatorycriteria for causality, likeStrengthBiological gradient (dose- response relationship)Temporality ( time sequence)Biological plausibilitySpecificityConsistency &Experimental proof
Akhilesh Bhargava13Types of AssociationCausalDirect causal (iodine deficiency-goiter)Indirect causal (iodine deficiency-goiter-thyroid adenoma)Non-causalChance, Numerator analysis alone Bias
Akhilesh Bhargava14E				D (Direct causality)E				D (Indirect causality)		   CE1				D (Independently causalE2E1+				D (conditionally causal)E2(E1 and E2 need to be presentsimultaneouslyE= ExposureD= DiseaseC=Confounding
Akhilesh Bhargava15 Two ways to get at the ‘Association’Start with a group of ‘exposed’ and a group of ‘unexposed’.  Determine how many (what proportion) in each group have or develop the disease in question.Start with a group of people with the disease and a group free of the disease.  Determine how many (what proportion) in each group has the exposure in question
Akhilesh Bhargava16Prospective approach; Comparison of the proportion of those developing disease in the exposed and the unexposed group constitutes a measure of association (relative risk) between the disease and the exposure.Retrospective approach.Comparison of odds (related to proportion) of having exposure in the disease and the disease-free group constitutes a measure of association (odds ratio) between the disease and the exposure.
Akhilesh Bhargava17Measures of AssociationStandardized Morbidity Ratio (SMR)  Standardized Mortality Ratio (SMR)  Relative Risk (RR)  Odds Ratio (OR)  Attributable Risk (AR)
Akhilesh Bhargava18Standardized Morbidity (Mortality) RatioSMR= Ratio of an ‘observed’ to an ‘expected’If ‘observed’ and ‘expected’ are equal, that is, if SMR=1, there is no associationIf SMR is different than 1, there is associationRemember, association does not implicate causation
Akhilesh Bhargava19Examples of SMRObserved= number of cases of lung cancer deaths actually observed in an occupational group.      Expected= number of lung cancer deaths expected in this group based on general population rates.If observed and expected are equal, there is no reason to suspect that the particular occupation carries higher risk of lung cancer.If, on the other hand, observed is different than the expected, one can infer an ‘association’ between the particular occupation and lung cancer.
Akhilesh Bhargava20SMR ExampleIn a city, observed number of deaths by various causes are available by occupation    Expected number of deaths for each occupation are calculated by applying the citywide rates to each occupation.If number of observed and actual deaths are equal for each occupation, one would not suspect a relationship between occupational characteristics and risk of death for a certain cause.If, on the other hand, for a specific cause of death, some occupations exhibit excess while others exhibit a deficit, an association between occupational characteristics and the specific cause of death would be inferred.
Akhilesh Bhargava21Prospective Approach: Relative RiskRelative Risk = (30 / 100) / (10 / 100) = 3.0
Akhilesh Bhargava22Relative Risk (RR)Consider incidence rate of lung cancer in heavy smokers and non-smokersIf the incidence rate is the same for heavy smokers and non-smokers, no association can be inferred between smoking and lung cancerIf the incidence rate is higher among heavy smokers RELATIVE to  non-smokers, an association would be suggested.Incidence rate can be taken as a measure of risk, and the ratio of the two incidence rates would then be the Relative Risk (RR)
Akhilesh Bhargava23Relative Risk (RR) cont…Relative Risk (RR)= Ratio of the risk of disease in ‘exposed’ and ‘unexposed’RR=1 No association between the exposure and the disease.RR>1  There is an association (risk factor)RR<1  There is an association (protective factor)Farther from the null value the RR is, stronger is the associationNo matter how strong the association, it can not in and by itself implicate causation
Akhilesh Bhargava24Retrospective Approach:Odds RatioOdds Ratio = (30 / 10) / (70 / 90) = 3.85If the disease is rare, the odds ratio provides a good approximation of relative risk.However, in the literature, odds ratio and relative risks are (erroneously) considered synonymous.
Akhilesh Bhargava25Attributable Risk (Risk Difference)Incidence in exposed –incidence in unexposed AR is an expression of existence of a cause-effectrelationship.An AR value of 0 (Zero) means no association between cause and effect.AR is basically a Ratio
Akhilesh Bhargava26Ratios are appropriate measures for examining the importance of a given risk factor in the etiology of the disease.  This is because the ratio provides an indication of how many times is the risk of the disease to a person with the exposure to the factor compared to one who is not so exposed.
Akhilesh Bhargava27   But suppose we are interested in finding out to what extent a disease can be prevented in a population if a particular risk factor was eliminated?   Or suppose we are interested in finding out to what extent is the particular risk factor responsible for the disease in an exposed individual?   The first question pertains to what is known as the population attributable risk (AR )   The second question pertains to what is known as the exposure attributable risk (AR% ).
Akhilesh Bhargava28  RR=       a/ a + b       -----------       c/ c + dRR-1   AR= -------   RR   a d   OR = -----b c               Incidence in Total pop. – Incidence in exposedAR p %= ---------------------------------------- ---------- ----x 100      Incidence in total Pop.                 ARIe-IoARp %  =-------- x 100	=  -------  x 100IeIe
Akhilesh Bhargava29a  / a + b       120 / 400RR=     ----------- =   ----------   =  6.0            c/ c + d        30 / 600           RR-1      6-1AR=    ------- = ------  =  0.83           RR           6                   0.83         0.83AR p % =   -------   =  ------ =  3.32               120 / 400     0.25          a d         120 x 570O.R. = ----- =  ------------- =    8.14          b c          280 x 30

Causal Association

  • 1.
    Causal Association :Cause To EffectDr. Akhilesh BhargavaMD, DHA, PGDHRMProf. Community Medicine &Director-SIHFW, Jaipur
  • 2.
    Akhilesh Bhargava2Measure ofAssociation-ConceptsIf ‘more’ disease occurs in a group that smokes compared to the group that does not smoke, there is an ‘association’ between the disease and smokingIf ‘more’ disease occurs in Hindus than in Muslims, there is an ‘association’ between the disease and raceIf ‘more’ lung cancer deaths occur in certain occupations than others, there is an ‘association’ between occupational exposure characteristics and lung cancer
  • 3.
    Akhilesh Bhargava3Why studyassociation?Is the first step in establishing a hypothesized causal relationshipAssociation by itself does not implicate causation
  • 4.
    Akhilesh Bhargava4From Associationto CausationDoes the association make biologic sense?An isolated study or, many studies in different populations find a similar association?Does the association support a dose response, i.e., more exposure is associated with more disease?
  • 5.
    Akhilesh Bhargava5All epidemiologicalhypotheses is based on the concept of association between exposure & diseasePrimary objective is to see whether an association is causal or not. Presence of an association in no way implies that the relationship is that of a cause & effect.The association means a statistical dependence between two variables i.e. when a change in one variable parallels or coincides with the change in other variable
  • 6.
    Akhilesh Bhargava6 a relationship between cause & effect may not be always a causal one, for the reason that Bias, Chance & Confounding may under or over play the association
  • 7.
    Akhilesh Bhargava7The variablein an association are-Dependent (dv)Independent (iv)Confounding (cv)Intermediate (im.v)
  • 8.
    Akhilesh Bhargava8CausesHypertension CHD(iv) CausesIncreased HypertensionSalt intake (dv) HypertensionObesity (cv) CHDSalt intake Hypertension CHD causes causes (Intermediate variable)
  • 9.
    Akhilesh Bhargava9 (cv) PrematurityMaternal Malnutrition Low Birth Weight(iv) (dv) Maternal Anemia (intermediate variable)
  • 10.
    Akhilesh Bhargava10Factors governingassociationMagnitude of association or strength of associationB. Biological likelihood C. Consistency with other findingsD. Time sequence &E. Dose-response relationship
  • 11.
    Akhilesh Bhargava11Approaches inestablishing a causal association-Basic questions are -Is there an association actually existingIs the association likely to be causal
  • 12.
    Akhilesh Bhargava12An associationshould satisfy confirmatorycriteria for causality, likeStrengthBiological gradient (dose- response relationship)Temporality ( time sequence)Biological plausibilitySpecificityConsistency &Experimental proof
  • 13.
    Akhilesh Bhargava13Types ofAssociationCausalDirect causal (iodine deficiency-goiter)Indirect causal (iodine deficiency-goiter-thyroid adenoma)Non-causalChance, Numerator analysis alone Bias
  • 14.
    Akhilesh Bhargava14E D (Directcausality)E D (Indirect causality) CE1 D (Independently causalE2E1+ D (conditionally causal)E2(E1 and E2 need to be presentsimultaneouslyE= ExposureD= DiseaseC=Confounding
  • 15.
    Akhilesh Bhargava15 Twoways to get at the ‘Association’Start with a group of ‘exposed’ and a group of ‘unexposed’. Determine how many (what proportion) in each group have or develop the disease in question.Start with a group of people with the disease and a group free of the disease. Determine how many (what proportion) in each group has the exposure in question
  • 16.
    Akhilesh Bhargava16Prospective approach;Comparison of the proportion of those developing disease in the exposed and the unexposed group constitutes a measure of association (relative risk) between the disease and the exposure.Retrospective approach.Comparison of odds (related to proportion) of having exposure in the disease and the disease-free group constitutes a measure of association (odds ratio) between the disease and the exposure.
  • 17.
    Akhilesh Bhargava17Measures ofAssociationStandardized Morbidity Ratio (SMR) Standardized Mortality Ratio (SMR) Relative Risk (RR) Odds Ratio (OR) Attributable Risk (AR)
  • 18.
    Akhilesh Bhargava18Standardized Morbidity(Mortality) RatioSMR= Ratio of an ‘observed’ to an ‘expected’If ‘observed’ and ‘expected’ are equal, that is, if SMR=1, there is no associationIf SMR is different than 1, there is associationRemember, association does not implicate causation
  • 19.
    Akhilesh Bhargava19Examples ofSMRObserved= number of cases of lung cancer deaths actually observed in an occupational group. Expected= number of lung cancer deaths expected in this group based on general population rates.If observed and expected are equal, there is no reason to suspect that the particular occupation carries higher risk of lung cancer.If, on the other hand, observed is different than the expected, one can infer an ‘association’ between the particular occupation and lung cancer.
  • 20.
    Akhilesh Bhargava20SMR ExampleIna city, observed number of deaths by various causes are available by occupation Expected number of deaths for each occupation are calculated by applying the citywide rates to each occupation.If number of observed and actual deaths are equal for each occupation, one would not suspect a relationship between occupational characteristics and risk of death for a certain cause.If, on the other hand, for a specific cause of death, some occupations exhibit excess while others exhibit a deficit, an association between occupational characteristics and the specific cause of death would be inferred.
  • 21.
    Akhilesh Bhargava21Prospective Approach:Relative RiskRelative Risk = (30 / 100) / (10 / 100) = 3.0
  • 22.
    Akhilesh Bhargava22Relative Risk(RR)Consider incidence rate of lung cancer in heavy smokers and non-smokersIf the incidence rate is the same for heavy smokers and non-smokers, no association can be inferred between smoking and lung cancerIf the incidence rate is higher among heavy smokers RELATIVE to non-smokers, an association would be suggested.Incidence rate can be taken as a measure of risk, and the ratio of the two incidence rates would then be the Relative Risk (RR)
  • 23.
    Akhilesh Bhargava23Relative Risk(RR) cont…Relative Risk (RR)= Ratio of the risk of disease in ‘exposed’ and ‘unexposed’RR=1 No association between the exposure and the disease.RR>1  There is an association (risk factor)RR<1  There is an association (protective factor)Farther from the null value the RR is, stronger is the associationNo matter how strong the association, it can not in and by itself implicate causation
  • 24.
    Akhilesh Bhargava24Retrospective Approach:OddsRatioOdds Ratio = (30 / 10) / (70 / 90) = 3.85If the disease is rare, the odds ratio provides a good approximation of relative risk.However, in the literature, odds ratio and relative risks are (erroneously) considered synonymous.
  • 25.
    Akhilesh Bhargava25Attributable Risk(Risk Difference)Incidence in exposed –incidence in unexposed AR is an expression of existence of a cause-effectrelationship.An AR value of 0 (Zero) means no association between cause and effect.AR is basically a Ratio
  • 26.
    Akhilesh Bhargava26Ratios areappropriate measures for examining the importance of a given risk factor in the etiology of the disease. This is because the ratio provides an indication of how many times is the risk of the disease to a person with the exposure to the factor compared to one who is not so exposed.
  • 27.
    Akhilesh Bhargava27 But suppose we are interested in finding out to what extent a disease can be prevented in a population if a particular risk factor was eliminated? Or suppose we are interested in finding out to what extent is the particular risk factor responsible for the disease in an exposed individual? The first question pertains to what is known as the population attributable risk (AR ) The second question pertains to what is known as the exposure attributable risk (AR% ).
  • 28.
    Akhilesh Bhargava28 RR= a/ a + b ----------- c/ c + dRR-1 AR= ------- RR a d OR = -----b c Incidence in Total pop. – Incidence in exposedAR p %= ---------------------------------------- ---------- ----x 100 Incidence in total Pop. ARIe-IoARp % =-------- x 100 = ------- x 100IeIe
  • 29.
    Akhilesh Bhargava29a / a + b 120 / 400RR= ----------- = ---------- = 6.0 c/ c + d 30 / 600 RR-1 6-1AR= ------- = ------ = 0.83 RR 6 0.83 0.83AR p % = ------- = ------ = 3.32 120 / 400 0.25 a d 120 x 570O.R. = ----- = ------------- = 8.14 b c 280 x 30