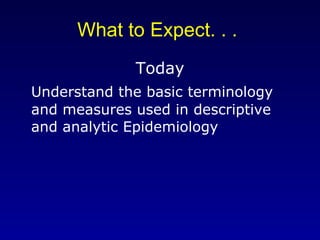
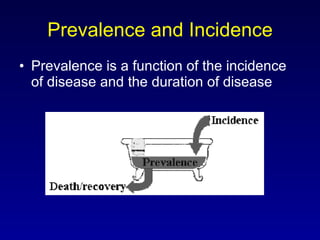
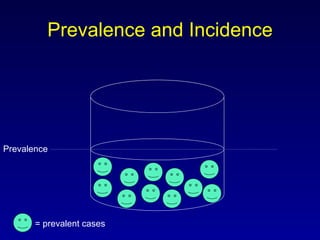
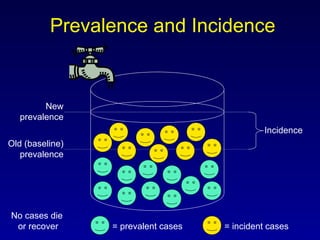
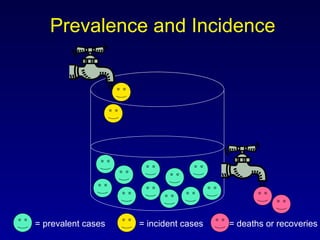
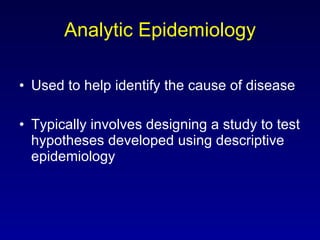
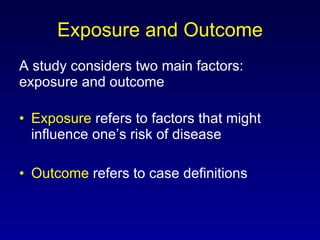
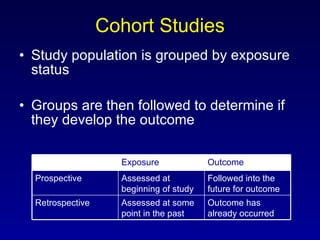
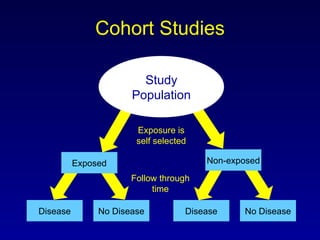
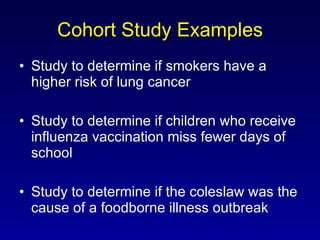
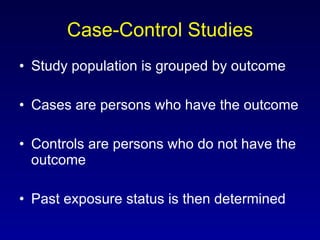
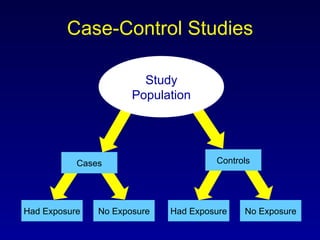
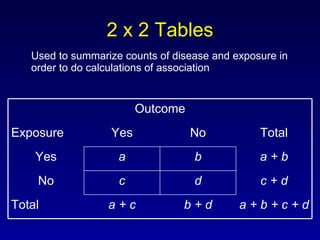
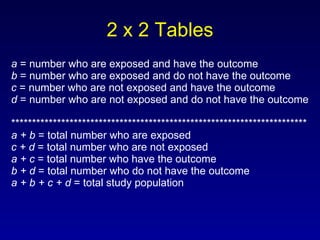
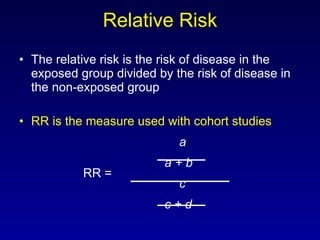
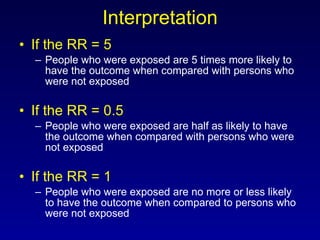
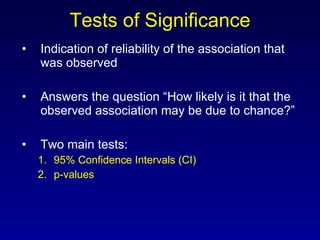
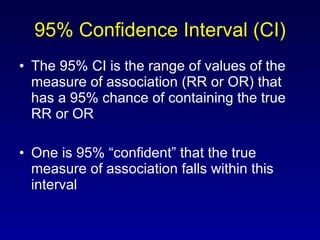
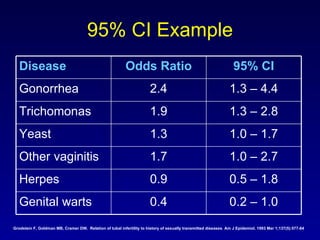
Public Health  Information Network (PHIN) Series I is for Epi Epidemiology basics  for non-epidemiologists
 
Series Overview Introduction to: The history of Epidemiology Specialties in the field Key terminology, measures, and resources Application of Epidemiological methods
Series I Sessions May 5 “ Epidemiology Specialties Applied” April 7 “ Surveillance” March 3 “ Descriptive and Analytic Epidemiology” February 3 “ An Epidemiologist’s Tool Kit” January 12 “ Epidemiology in the Context of Public Health” Date Title
What to Expect. . .  Today Understand the basic terminology and measures used in descriptive and analytic Epidemiology
Session I – V Slides VDH will post PHIN series slides on the following Web site:  http://www.vdh.virginia.gov/EPR/Training.asp NCCPHP Training Web site: http://www.sph.unc.edu/nccphp/training
Site Sign-in Sheet Please submit your site sign-in sheet to: Suzi Silverstein Director, Education and Training Emergency Preparedness & Response Programs FAX:  (804) 225 - 3888
Series I Session III “ Descriptive and Analytic Epidemiology”
Today’s Presenter Kim Brunette, MPH Epidemiologist North Carolina Center for Public Health Preparedness, Institute for Public Health, UNC Chapel Hill
Session Overview Define descriptive epidemiology Define incidence and prevalence Discuss examples of the use of descriptive data Define analytic epidemiology Discuss different study designs Discuss measures of association Discuss tests of significance
Today’s Learning Objectives Understand the distinction between descriptive and analytic Epidemiology, and their utility in surveillance and outbreak investigations Recognize descriptive and analytic measures used in the Epidemiological literature Know how to interpret data analysis output for measures of association and common statistical tests
Descriptive Epidemiology Prevalence and Incidence
What is Epidemiology? Study of the distribution and determinants of states or events in specified populations, and the application of this study to the control of health problems Study risk associated with exposures Identify and control epidemics Monitor population rates of disease and exposure
What is Epidemiology? Looking to answer the questions: Who? What? When? Where? Why? How?
Case Definition A case definition is a set of standard diagnostic criteria that must be fulfilled in order to identify a person as a case of a particular disease Ensures that all persons who are counted as cases actually have the same disease Typically includes clinical criteria (lab results, symptoms, signs) and sometimes restrictions on time, place, and person
Descriptive vs. Analytic Epidemiology Descriptive  Epidemiology deals with the questions: Who, What, When, and Where Analytic  Epidemiology deals with the remaining questions: Why and How
Descriptive Epidemiology Provides a systematic method for characterizing a health problem Ensures understanding of the basic dimensions of a health problem Helps identify populations at higher risk for the health problem Provides information used for allocation of resources Enables development of testable hypotheses
Descriptive Epidemiology What? Addresses the question “How much?” Most basic is a simple count of cases Good for looking at the burden of disease Not useful for comparing to other groups or populations http://www.vdh.virginia.gov/epi/Data/race03t.pdf 5,342,532 497 White 1,450,675 119 Black Pop. size # of  Salmonella  cases Race
Prevalence The number of affected persons present in the population divided by the number of people in the population   # of cases Prevalence = ----------------------------------------- # of people in the population
Prevalence Example In 1999, Virginia reported an estimated 253,040 residents over 20 years of age with diabetes.  The US Census Bureau estimated that the 1999 Virginia population over 20 was 5,008,863.   253,040 Prevalence=   =  0.051 5,008,863 In 1999, the prevalence of diabetes in Virginia was 5.1% Can also be expressed as 51 cases per 1,000 residents over 20 years of age
Prevalence Useful for assessing the burden of disease within a population Valuable for planning Not  useful for determining what caused disease
Incidence The number of new cases of a disease that occur during a specified period of time divided by the number of persons at risk of developing the disease during that period of time   # of new cases of disease over    a specific period of time Incidence = -------------------------------------------   # of persons at risk of disease    over that specific period of time
Incidence Example A study in 2002 examined depression among persons with dementia.  The study recruited 201 adults with dementia admitted to a long-term care facility.  Of the 201, 91 had a prior diagnosis of depression.  Over the first year, 7 adults developed depression.   7 Incidence =    = 0.0636   110 The one year incidence of depression among adults with dementia is 6.36% Can also be expressed as 63.6 (64) cases per 1,000 persons with dementia
Incidence High incidence represents diseases with high occurrence; low incidence represents diseases with low occurrence Can be used to help determine the causes of disease Can be used to determine the likelihood of developing disease
Prevalence and Incidence Prevalence is a function of the incidence of disease and the duration of disease
Prevalence and Incidence Prevalence = prevalent cases
Prevalence and Incidence Old (baseline) prevalence = prevalent cases = incident cases New prevalence Incidence No cases die  or recover
Prevalence and Incidence = prevalent cases = incident cases = deaths or recoveries
Time for you to try it!!!
Descriptive Epidemiology Person, Place, Time
Descriptive Epidemiology Who?  When?  Where? Related to Person, Place, and Time Person May be characterized by age, race, sex, education, occupation, or other personal variables Place May include information on home, workplace, school Time May look at time of illness onset, when exposure to risk factors occurred
Person Data Age and Sex are almost always used in looking at data Age data are usually grouped – intervals will depend on what type of disease / event is being looked at May be shown in tables or graphs May look at more than one type of person data at once
Data Characterized by Person http://www.vahealth.org/civp/Injury%20in%20Virginia_Report_2004.pdf
Data Characterized by Person http://www.vdh.virginia.gov/std/AnnualReport2003.pdf
Data Characterized by Person http://www.vdh.virginia.gov/epi/cancer/Report99.pdf
Data Characterized by Person http://www.vahealth.org/chronic/Data_Report_Part_3.pdf
Time Data Usually shown as a graph Number / rate of cases on vertical (y) axis Time periods on horizontal (x) axis Time period will depend on what is being described Used to show trends, seasonality, day of week / time of day, epidemic period
Data Characterized by Time http://www.dhhs.state.nc.us/docs/ecoli.htm
Data Characterized by Time http://www.vdh.virginia.gov/std/HIVSTDTrends.pdf
Data Characterized by Time http://www.cdc.gov/mmwr/preview/mmwrhtml/mm5153a1.htm
Data Characterized by Time http://www.health.qld.gov.au/phs/Documents/cdu/12776.pdf
Place Data Can be shown in a table; usually better presented pictorially in a map Two main types of maps used:  choropleth and spot Choropleth  maps use different shadings/colors to indicate the count / rate of cases in an area Spot  maps show location of individual cases
Data Characterized by Place http://www.vdh.virginia.gov/epi/Data/region03t.pdf
Data Characterized by Place http://www.vdh.virginia.gov/epi/Data/Maps2002.pdf
Data Characterized by Place http://www.vahealth.org/civp/preventsuicideva/epiplan%202004.pdf
Data Characterized by Place Source: Olsen, S.J. et al.  N Engl J Med. 2003 Dec 18; 349(25):2381-2.
5 Minute Break
Analytic Epidemiology Hypotheses and Study Designs
Descriptive vs. Analytic Epidemiology Descriptive  Epidemiology deals with the questions: Who, What, When, and Where Analytic  Epidemiology deals with the remaining questions: Why and How
Analytic Epidemiology Used to help identify the cause of disease Typically involves designing a study to test hypotheses developed using descriptive epidemiology
Borgman, J (1997).  The Cincinnati Enquirer.  King Features Syndicate.
Exposure and Outcome A study considers two main factors:  exposure and outcome Exposure  refers to factors that might influence one’s risk of disease Outcome  refers to case definitions
Case Definition A set of standard diagnostic criteria that must be fulfilled in order to identify a person as a case of a particular disease Ensures that all persons who are counted as cases actually have the same disease Typically includes clinical criteria (lab results, symptoms, signs) and sometimes restrictions on time, place, and person
Developing Hypotheses A hypothesis is an educated guess about an association that is testable in a scientific investigation Descriptive data provide information to develop hypotheses Hypotheses tend to be broad initially and are then refined to have a narrower focus
Example Hypothesis : People who ate at the church picnic were more likely to become ill Exposure  is eating at the church picnic Outcome  is illness – this would need to be defined, for example, ill persons are those who have diarrhea and fever Hypothesis : People who ate the egg salad at the church picnic were more likely to have laboratory-confirmed  Salmonella Exposure  is eating egg salad at the church picnic Outcome  is laboratory confirmation of  Salmonella
 
Types of Studies Two main categories: Experimental Observational Experimental  studies – exposure status is assigned Observational  studies – exposure status is not assigned
Experimental Studies Can involve individuals or communities Assignment of exposure status can be random or non-random The non-exposed group can be untreated (placebo) or given a standard treatment Most common is a randomized clinical trial
Experimental Study Examples Randomized clinical trial to determine if giving magnesium sulfate to pregnant women in preterm labor decreases the risk of their babies developing cerebral palsy Randomized community trial to determine if fluoridation of the public water supply decreases dental cavities
Observational Studies Three main types: Cross-sectional study Cohort study Case-control study
Cross-Sectional Studies Exposure and outcome status are determined at the same time Examples include: Behavioral Risk Factor Surveillance System (BRFSS) -  http://www.cdc.gov/brfss/   National Health and Nutrition Surveys (NHANES) -  http://www.cdc.gov/nchs/nhanes.htm   Also include most opinion and political polls
Cohort Studies Study population is grouped by exposure status Groups are then followed to determine if they develop the outcome Outcome has already occurred Assessed at some point in the past Retrospective Followed into the future for outcome Assessed at beginning of study Prospective Outcome Exposure
Cohort Studies Disease No Disease Study Population Exposed Non-exposed No Disease Disease Exposure is self selected Follow through time
Cohort Study Examples Study to determine if smokers have a higher risk of lung cancer Study to determine if children who receive influenza vaccination miss fewer days of school Study to determine if the coleslaw was the cause of a foodborne illness outbreak
Case-Control Studies Study population is grouped by outcome Cases are persons who have the outcome Controls are persons who do not have the outcome Past exposure status is then determined
Case-Control Studies Had Exposure No Exposure Study Population Cases Controls No Exposure Had Exposure
Case-Control Study Examples Study to determine an association between autism and vaccination Study to determine an association between lung cancer and radon exposure Study to determine an association between salmonella infection and eating at a fast food restaurant
Cohort versus Case-Control Study
Classification of Study Designs Source: Grimes DA, Schulz KF.  Lancet 2002; 359: 58
Time for you to try it!!!
5 Minute Break
Analytic Epidemiology Measures of Association and Statistical Tests
Measures of Association Assess the strength of an association between an exposure and the outcome of interest Indicate how more or less likely one is to develop disease as compared to another Two widely used measures: Relative risk  (a.k.a. risk ratio,  RR ) Odds ratio  (a.k.a.  OR )
2 x 2 Tables Used to summarize counts of disease and exposure in order to do calculations of association a + b + c + d b + d a + c Total c + d d c No a + b b a Yes Total No Yes Exposure Outcome
2 x 2 Tables a  = number who are exposed and have the outcome b  = number who are exposed and do not have the outcome c  = number who are not exposed and have the outcome d  = number who are not exposed and do not have the outcome *********************************************************************** a + b  = total number who are exposed c + d  = total number who are not exposed a + c  = total number who have the outcome b + d  = total number who do not have the outcome a + b + c + d  = total study population
Relative Risk The relative risk is the risk of disease in the exposed group divided by the risk of disease in the non-exposed group RR is the measure used with cohort studies a   a + b RR = c   c + d
Relative Risk Example   a  / ( a + c )   23 / 33 RR  =    = =  6.67   c  / ( c+ d )   7 / 67 100 70 30 Total 67 60 7 No 33 10 23 Yes Total No Yes Pink hamburger Escherichia coli ?
Odds Ratio In a case-control study, the risk of disease cannot be directly calculated because the population at risk is not known OR is the measure used with case-control studies     a  x  d OR =    b  x  c
Odds Ratio Example   a x d   130 x 135 OR  =  = =  1.27   b x c   115 x 120 500 250 250 Total 255 135 120 No 245 115 130 Yes Total No Yes MMR Vaccine? Autism
Interpretation Both the RR and OR are interpreted as follows: = 1   -  indicates no association > 1   -  indicates a positive association < 1   -  indicates a negative association
Interpretation If the RR = 5 People who were exposed are 5 times more likely to have the outcome when compared with persons who were not exposed If the RR = 0.5 People who were exposed are half as likely to have the outcome when compared with persons who were not exposed If the RR = 1 People who were exposed are no more or less likely to have the outcome when compared to persons who were not exposed
Tests of Significance Indication of reliability of the association that was observed Answers the question “How likely is it that the observed association may be due to chance?” Two main tests: 95% Confidence Intervals (CI) p-values
95% Confidence Interval (CI) The 95% CI is the range of values of the measure of association (RR or OR) that has a 95% chance of containing the true RR or OR One is 95% “confident” that the true measure of association falls within this interval
95% CI Example Grodstein F, Goldman MB, Cramer DW.  Relation of tubal infertility to history of sexually transmitted diseases .  Am J Epidemiol. 1993 Mar 1;137(5):577-84   0.2 – 1.0 0.4 Genital warts 0.5 – 1.8 0.9 Herpes 1.0 – 2.7 1.7 Other vaginitis 1.0 – 1.7 1.3 Yeast 1.3 – 2.8 1.9 Trichomonas 1.3 – 4.4 2.4 Gonorrhea 95% CI Odds Ratio Disease
Interpreting 95% Confidence Intervals To have a significant association between exposure and outcome, the 95% CI  should not  include 1.0 A 95% CI range below 1 suggests less risk of the outcome in the exposed population A 95% CI range above 1 suggests a higher risk of the outcome in the exposed population
p-values The p-value is a measure of how likely the observed association would be to occur by chance alone, in the absence of a true association A very small p-value means that you are very unlikely to observe such a RR or OR if there was no true association A p-value of 0.05 indicates only a 5% chance that the RR or OR was observed by chance alone
p-value Example Grodstein F, Goldman MB, Cramer DW.  Relation of tubal infertility to history of sexually transmitted diseases .  Am J Epidemiol. 1993 Mar 1;137(5):577-84   0.05 0.2 – 1.0 0.4 Genital warts 0.80 0.5 – 1.8 0.9 Herpes 0.04 1.0 – 2.7 1.7 Other vaginitis 0.04 1.0 – 1.7 1.3 Yeast 0.001 1.3 – 2.8 1.9 Trichomonas 0.004 1.3 – 4.4 2.4 Gonorrhea p-value 95% CI Odds Ratio Disease
Time for you to try it!!!
Questions???
Epidemiology Pocket Guide: Quick Review Any Time!  Measures of Disease Frequency Classification of Study Designs 2 x 2 Tables Measures of Association Tests of Significance http://www.vdh.virginia.gov/EPR/Training.asp
Session III Slides Following this program, please visit the Web site below to access and download a copy of today’s slides: http://www.vdh.virginia.gov/EPR/Training.asp
Site Sign-in Sheet Please submit your site sign-in sheet to: Suzi Silverstein Director, Education and Training Emergency Preparedness & Response Programs FAX:  (804) 225 - 3888
References and Resources Centers for Disease Control and Prevention (1992).  Principles of Epidemiology: 2 nd  Edition.  Public Health Practice Program Office: Atlanta, GA. Gordis, L. (2000).  Epidemiology: 2 nd  Edition.  W.B. Saunders Company: Philadelphia, PA. Gregg, M.B. (2002).  Field Epidemiology: 2 nd  Edition.  Oxford University Press: New York. Hennekens, C.H. and Buring, J.E. (1987).  Epidemiology in Medicine.  Little, Brown and Company: Boston/Toronto.
References and Resources Last, J.M. (2001).  A Dictionary of Epidemiology: 4 th  Edition.  Oxford University Press: New York. McNeill, A. (January 2002).  Measuring the Occurrence of Disease:  Prevalence and Incidence.  Epid 160 lecture series, UNC Chapel Hill School of Public Health, Department of Epidemiology. Morton, R.F, Hebel, J.R., McCarter, R.J. (2001).  A Study Guide to Epidemiology and Biostatistics: 5 th  Edition.  Aspen Publishers, Inc.: Gaithersburg, MD. University of North Carolina at Chapel Hill School of Public Health, Department of Epidemiology, and the Epidemiologic Research & Information Center (June 1999).  ERIC Notebook .  Issue 2.  http://www.sph.unc.edu/courses/eric/eric_notebooks.htm
References and Resources University of North Carolina at Chapel Hill School of Public Health, Department of Epidemiology, and the Epidemiologic Research & Information Center (July 1999).  ERIC Notebook .  Issue 3.  http://www.sph.unc.edu/courses/eric/eric_notebooks.htm University of North Carolina at Chapel Hill School of Public Health, Department of Epidemiology, and the Epidemiologic Research & Information Center (September 1999).  ERIC Notebook .  Issue 5.  http://www.sph.unc.edu/courses/eric/eric_notebooks.htm University of North Carolina at Chapel Hill School of Public Health, Department of Epidemiology (August 2000). Laboratory Instructor’s Guide:  Analytic Study Designs. Epid 168 lecture series.  http://www.epidemiolog.net/epid168/labs/AnalyticStudExerInstGuid2000.pdf
2005 PHIN Training Development Team Pia MacDonald, PhD, MPH   Director, NCCPHP Jennifer Horney, MPH Director, Training and Education, NCCPHP Kim Brunette, MPH Epidemiologist, NCCPHP Anjum Hajat, MPH Epidemiologist, NCCPHP Sarah Pfau, MPH  Consultant

Descriptive and Analytical Epidemiology

  • 1.
    Public Health Information Network (PHIN) Series I is for Epi Epidemiology basics for non-epidemiologists
  • 2.
  • 3.
    Series Overview Introductionto: The history of Epidemiology Specialties in the field Key terminology, measures, and resources Application of Epidemiological methods
  • 4.
    Series I SessionsMay 5 “ Epidemiology Specialties Applied” April 7 “ Surveillance” March 3 “ Descriptive and Analytic Epidemiology” February 3 “ An Epidemiologist’s Tool Kit” January 12 “ Epidemiology in the Context of Public Health” Date Title
  • 5.
    What to Expect.. . Today Understand the basic terminology and measures used in descriptive and analytic Epidemiology
  • 6.
    Session I –V Slides VDH will post PHIN series slides on the following Web site: http://www.vdh.virginia.gov/EPR/Training.asp NCCPHP Training Web site: http://www.sph.unc.edu/nccphp/training
  • 7.
    Site Sign-in SheetPlease submit your site sign-in sheet to: Suzi Silverstein Director, Education and Training Emergency Preparedness & Response Programs FAX: (804) 225 - 3888
  • 8.
    Series I SessionIII “ Descriptive and Analytic Epidemiology”
  • 9.
    Today’s Presenter KimBrunette, MPH Epidemiologist North Carolina Center for Public Health Preparedness, Institute for Public Health, UNC Chapel Hill
  • 10.
    Session Overview Definedescriptive epidemiology Define incidence and prevalence Discuss examples of the use of descriptive data Define analytic epidemiology Discuss different study designs Discuss measures of association Discuss tests of significance
  • 11.
    Today’s Learning ObjectivesUnderstand the distinction between descriptive and analytic Epidemiology, and their utility in surveillance and outbreak investigations Recognize descriptive and analytic measures used in the Epidemiological literature Know how to interpret data analysis output for measures of association and common statistical tests
  • 12.
  • 13.
    What is Epidemiology?Study of the distribution and determinants of states or events in specified populations, and the application of this study to the control of health problems Study risk associated with exposures Identify and control epidemics Monitor population rates of disease and exposure
  • 14.
    What is Epidemiology?Looking to answer the questions: Who? What? When? Where? Why? How?
  • 15.
    Case Definition Acase definition is a set of standard diagnostic criteria that must be fulfilled in order to identify a person as a case of a particular disease Ensures that all persons who are counted as cases actually have the same disease Typically includes clinical criteria (lab results, symptoms, signs) and sometimes restrictions on time, place, and person
  • 16.
    Descriptive vs. AnalyticEpidemiology Descriptive Epidemiology deals with the questions: Who, What, When, and Where Analytic Epidemiology deals with the remaining questions: Why and How
  • 17.
    Descriptive Epidemiology Providesa systematic method for characterizing a health problem Ensures understanding of the basic dimensions of a health problem Helps identify populations at higher risk for the health problem Provides information used for allocation of resources Enables development of testable hypotheses
  • 18.
    Descriptive Epidemiology What?Addresses the question “How much?” Most basic is a simple count of cases Good for looking at the burden of disease Not useful for comparing to other groups or populations http://www.vdh.virginia.gov/epi/Data/race03t.pdf 5,342,532 497 White 1,450,675 119 Black Pop. size # of Salmonella cases Race
  • 19.
    Prevalence The numberof affected persons present in the population divided by the number of people in the population # of cases Prevalence = ----------------------------------------- # of people in the population
  • 20.
    Prevalence Example In1999, Virginia reported an estimated 253,040 residents over 20 years of age with diabetes. The US Census Bureau estimated that the 1999 Virginia population over 20 was 5,008,863. 253,040 Prevalence= = 0.051 5,008,863 In 1999, the prevalence of diabetes in Virginia was 5.1% Can also be expressed as 51 cases per 1,000 residents over 20 years of age
  • 21.
    Prevalence Useful forassessing the burden of disease within a population Valuable for planning Not useful for determining what caused disease
  • 22.
    Incidence The numberof new cases of a disease that occur during a specified period of time divided by the number of persons at risk of developing the disease during that period of time # of new cases of disease over a specific period of time Incidence = ------------------------------------------- # of persons at risk of disease over that specific period of time
  • 23.
    Incidence Example Astudy in 2002 examined depression among persons with dementia. The study recruited 201 adults with dementia admitted to a long-term care facility. Of the 201, 91 had a prior diagnosis of depression. Over the first year, 7 adults developed depression. 7 Incidence = = 0.0636 110 The one year incidence of depression among adults with dementia is 6.36% Can also be expressed as 63.6 (64) cases per 1,000 persons with dementia
  • 24.
    Incidence High incidencerepresents diseases with high occurrence; low incidence represents diseases with low occurrence Can be used to help determine the causes of disease Can be used to determine the likelihood of developing disease
  • 25.
    Prevalence and IncidencePrevalence is a function of the incidence of disease and the duration of disease
  • 26.
    Prevalence and IncidencePrevalence = prevalent cases
  • 27.
    Prevalence and IncidenceOld (baseline) prevalence = prevalent cases = incident cases New prevalence Incidence No cases die or recover
  • 28.
    Prevalence and Incidence= prevalent cases = incident cases = deaths or recoveries
  • 29.
    Time for youto try it!!!
  • 30.
  • 31.
    Descriptive Epidemiology Who? When? Where? Related to Person, Place, and Time Person May be characterized by age, race, sex, education, occupation, or other personal variables Place May include information on home, workplace, school Time May look at time of illness onset, when exposure to risk factors occurred
  • 32.
    Person Data Ageand Sex are almost always used in looking at data Age data are usually grouped – intervals will depend on what type of disease / event is being looked at May be shown in tables or graphs May look at more than one type of person data at once
  • 33.
    Data Characterized byPerson http://www.vahealth.org/civp/Injury%20in%20Virginia_Report_2004.pdf
  • 34.
    Data Characterized byPerson http://www.vdh.virginia.gov/std/AnnualReport2003.pdf
  • 35.
    Data Characterized byPerson http://www.vdh.virginia.gov/epi/cancer/Report99.pdf
  • 36.
    Data Characterized byPerson http://www.vahealth.org/chronic/Data_Report_Part_3.pdf
  • 37.
    Time Data Usuallyshown as a graph Number / rate of cases on vertical (y) axis Time periods on horizontal (x) axis Time period will depend on what is being described Used to show trends, seasonality, day of week / time of day, epidemic period
  • 38.
    Data Characterized byTime http://www.dhhs.state.nc.us/docs/ecoli.htm
  • 39.
    Data Characterized byTime http://www.vdh.virginia.gov/std/HIVSTDTrends.pdf
  • 40.
    Data Characterized byTime http://www.cdc.gov/mmwr/preview/mmwrhtml/mm5153a1.htm
  • 41.
    Data Characterized byTime http://www.health.qld.gov.au/phs/Documents/cdu/12776.pdf
  • 42.
    Place Data Canbe shown in a table; usually better presented pictorially in a map Two main types of maps used: choropleth and spot Choropleth maps use different shadings/colors to indicate the count / rate of cases in an area Spot maps show location of individual cases
  • 43.
    Data Characterized byPlace http://www.vdh.virginia.gov/epi/Data/region03t.pdf
  • 44.
    Data Characterized byPlace http://www.vdh.virginia.gov/epi/Data/Maps2002.pdf
  • 45.
    Data Characterized byPlace http://www.vahealth.org/civp/preventsuicideva/epiplan%202004.pdf
  • 46.
    Data Characterized byPlace http://www.vahealth.org/civp/preventsuicideva/epiplan%202004.pdf
  • 47.
    Data Characterized byPlace Source: Olsen, S.J. et al. N Engl J Med. 2003 Dec 18; 349(25):2381-2.
  • 48.
  • 49.
  • 50.
    Descriptive vs. AnalyticEpidemiology Descriptive Epidemiology deals with the questions: Who, What, When, and Where Analytic Epidemiology deals with the remaining questions: Why and How
  • 51.
    Analytic Epidemiology Usedto help identify the cause of disease Typically involves designing a study to test hypotheses developed using descriptive epidemiology
  • 52.
    Borgman, J (1997). The Cincinnati Enquirer. King Features Syndicate.
  • 53.
    Exposure and OutcomeA study considers two main factors: exposure and outcome Exposure refers to factors that might influence one’s risk of disease Outcome refers to case definitions
  • 54.
    Case Definition Aset of standard diagnostic criteria that must be fulfilled in order to identify a person as a case of a particular disease Ensures that all persons who are counted as cases actually have the same disease Typically includes clinical criteria (lab results, symptoms, signs) and sometimes restrictions on time, place, and person
  • 55.
    Developing Hypotheses Ahypothesis is an educated guess about an association that is testable in a scientific investigation Descriptive data provide information to develop hypotheses Hypotheses tend to be broad initially and are then refined to have a narrower focus
  • 56.
    Example Hypothesis :People who ate at the church picnic were more likely to become ill Exposure is eating at the church picnic Outcome is illness – this would need to be defined, for example, ill persons are those who have diarrhea and fever Hypothesis : People who ate the egg salad at the church picnic were more likely to have laboratory-confirmed Salmonella Exposure is eating egg salad at the church picnic Outcome is laboratory confirmation of Salmonella
  • 57.
  • 58.
    Types of StudiesTwo main categories: Experimental Observational Experimental studies – exposure status is assigned Observational studies – exposure status is not assigned
  • 59.
    Experimental Studies Caninvolve individuals or communities Assignment of exposure status can be random or non-random The non-exposed group can be untreated (placebo) or given a standard treatment Most common is a randomized clinical trial
  • 60.
    Experimental Study ExamplesRandomized clinical trial to determine if giving magnesium sulfate to pregnant women in preterm labor decreases the risk of their babies developing cerebral palsy Randomized community trial to determine if fluoridation of the public water supply decreases dental cavities
  • 61.
    Observational Studies Threemain types: Cross-sectional study Cohort study Case-control study
  • 62.
    Cross-Sectional Studies Exposureand outcome status are determined at the same time Examples include: Behavioral Risk Factor Surveillance System (BRFSS) - http://www.cdc.gov/brfss/ National Health and Nutrition Surveys (NHANES) - http://www.cdc.gov/nchs/nhanes.htm Also include most opinion and political polls
  • 63.
    Cohort Studies Studypopulation is grouped by exposure status Groups are then followed to determine if they develop the outcome Outcome has already occurred Assessed at some point in the past Retrospective Followed into the future for outcome Assessed at beginning of study Prospective Outcome Exposure
  • 64.
    Cohort Studies DiseaseNo Disease Study Population Exposed Non-exposed No Disease Disease Exposure is self selected Follow through time
  • 65.
    Cohort Study ExamplesStudy to determine if smokers have a higher risk of lung cancer Study to determine if children who receive influenza vaccination miss fewer days of school Study to determine if the coleslaw was the cause of a foodborne illness outbreak
  • 66.
    Case-Control Studies Studypopulation is grouped by outcome Cases are persons who have the outcome Controls are persons who do not have the outcome Past exposure status is then determined
  • 67.
    Case-Control Studies HadExposure No Exposure Study Population Cases Controls No Exposure Had Exposure
  • 68.
    Case-Control Study ExamplesStudy to determine an association between autism and vaccination Study to determine an association between lung cancer and radon exposure Study to determine an association between salmonella infection and eating at a fast food restaurant
  • 69.
  • 70.
    Classification of StudyDesigns Source: Grimes DA, Schulz KF. Lancet 2002; 359: 58
  • 71.
    Time for youto try it!!!
  • 72.
  • 73.
    Analytic Epidemiology Measuresof Association and Statistical Tests
  • 74.
    Measures of AssociationAssess the strength of an association between an exposure and the outcome of interest Indicate how more or less likely one is to develop disease as compared to another Two widely used measures: Relative risk (a.k.a. risk ratio, RR ) Odds ratio (a.k.a. OR )
  • 75.
    2 x 2Tables Used to summarize counts of disease and exposure in order to do calculations of association a + b + c + d b + d a + c Total c + d d c No a + b b a Yes Total No Yes Exposure Outcome
  • 76.
    2 x 2Tables a = number who are exposed and have the outcome b = number who are exposed and do not have the outcome c = number who are not exposed and have the outcome d = number who are not exposed and do not have the outcome *********************************************************************** a + b = total number who are exposed c + d = total number who are not exposed a + c = total number who have the outcome b + d = total number who do not have the outcome a + b + c + d = total study population
  • 77.
    Relative Risk Therelative risk is the risk of disease in the exposed group divided by the risk of disease in the non-exposed group RR is the measure used with cohort studies a a + b RR = c c + d
  • 78.
    Relative Risk Example a / ( a + c ) 23 / 33 RR = = = 6.67 c / ( c+ d ) 7 / 67 100 70 30 Total 67 60 7 No 33 10 23 Yes Total No Yes Pink hamburger Escherichia coli ?
  • 79.
    Odds Ratio Ina case-control study, the risk of disease cannot be directly calculated because the population at risk is not known OR is the measure used with case-control studies a x d OR = b x c
  • 80.
    Odds Ratio Example a x d 130 x 135 OR = = = 1.27 b x c 115 x 120 500 250 250 Total 255 135 120 No 245 115 130 Yes Total No Yes MMR Vaccine? Autism
  • 81.
    Interpretation Both theRR and OR are interpreted as follows: = 1 - indicates no association > 1 - indicates a positive association < 1 - indicates a negative association
  • 82.
    Interpretation If theRR = 5 People who were exposed are 5 times more likely to have the outcome when compared with persons who were not exposed If the RR = 0.5 People who were exposed are half as likely to have the outcome when compared with persons who were not exposed If the RR = 1 People who were exposed are no more or less likely to have the outcome when compared to persons who were not exposed
  • 83.
    Tests of SignificanceIndication of reliability of the association that was observed Answers the question “How likely is it that the observed association may be due to chance?” Two main tests: 95% Confidence Intervals (CI) p-values
  • 84.
    95% Confidence Interval(CI) The 95% CI is the range of values of the measure of association (RR or OR) that has a 95% chance of containing the true RR or OR One is 95% “confident” that the true measure of association falls within this interval
  • 85.
    95% CI ExampleGrodstein F, Goldman MB, Cramer DW. Relation of tubal infertility to history of sexually transmitted diseases . Am J Epidemiol. 1993 Mar 1;137(5):577-84 0.2 – 1.0 0.4 Genital warts 0.5 – 1.8 0.9 Herpes 1.0 – 2.7 1.7 Other vaginitis 1.0 – 1.7 1.3 Yeast 1.3 – 2.8 1.9 Trichomonas 1.3 – 4.4 2.4 Gonorrhea 95% CI Odds Ratio Disease
  • 86.
    Interpreting 95% ConfidenceIntervals To have a significant association between exposure and outcome, the 95% CI should not include 1.0 A 95% CI range below 1 suggests less risk of the outcome in the exposed population A 95% CI range above 1 suggests a higher risk of the outcome in the exposed population
  • 87.
    p-values The p-valueis a measure of how likely the observed association would be to occur by chance alone, in the absence of a true association A very small p-value means that you are very unlikely to observe such a RR or OR if there was no true association A p-value of 0.05 indicates only a 5% chance that the RR or OR was observed by chance alone
  • 88.
    p-value Example GrodsteinF, Goldman MB, Cramer DW. Relation of tubal infertility to history of sexually transmitted diseases . Am J Epidemiol. 1993 Mar 1;137(5):577-84 0.05 0.2 – 1.0 0.4 Genital warts 0.80 0.5 – 1.8 0.9 Herpes 0.04 1.0 – 2.7 1.7 Other vaginitis 0.04 1.0 – 1.7 1.3 Yeast 0.001 1.3 – 2.8 1.9 Trichomonas 0.004 1.3 – 4.4 2.4 Gonorrhea p-value 95% CI Odds Ratio Disease
  • 89.
    Time for youto try it!!!
  • 90.
  • 91.
    Epidemiology Pocket Guide:Quick Review Any Time! Measures of Disease Frequency Classification of Study Designs 2 x 2 Tables Measures of Association Tests of Significance http://www.vdh.virginia.gov/EPR/Training.asp
  • 92.
    Session III SlidesFollowing this program, please visit the Web site below to access and download a copy of today’s slides: http://www.vdh.virginia.gov/EPR/Training.asp
  • 93.
    Site Sign-in SheetPlease submit your site sign-in sheet to: Suzi Silverstein Director, Education and Training Emergency Preparedness & Response Programs FAX: (804) 225 - 3888
  • 94.
    References and ResourcesCenters for Disease Control and Prevention (1992). Principles of Epidemiology: 2 nd Edition. Public Health Practice Program Office: Atlanta, GA. Gordis, L. (2000). Epidemiology: 2 nd Edition. W.B. Saunders Company: Philadelphia, PA. Gregg, M.B. (2002). Field Epidemiology: 2 nd Edition. Oxford University Press: New York. Hennekens, C.H. and Buring, J.E. (1987). Epidemiology in Medicine. Little, Brown and Company: Boston/Toronto.
  • 95.
    References and ResourcesLast, J.M. (2001). A Dictionary of Epidemiology: 4 th Edition. Oxford University Press: New York. McNeill, A. (January 2002). Measuring the Occurrence of Disease: Prevalence and Incidence. Epid 160 lecture series, UNC Chapel Hill School of Public Health, Department of Epidemiology. Morton, R.F, Hebel, J.R., McCarter, R.J. (2001). A Study Guide to Epidemiology and Biostatistics: 5 th Edition. Aspen Publishers, Inc.: Gaithersburg, MD. University of North Carolina at Chapel Hill School of Public Health, Department of Epidemiology, and the Epidemiologic Research & Information Center (June 1999). ERIC Notebook . Issue 2. http://www.sph.unc.edu/courses/eric/eric_notebooks.htm
  • 96.
    References and ResourcesUniversity of North Carolina at Chapel Hill School of Public Health, Department of Epidemiology, and the Epidemiologic Research & Information Center (July 1999). ERIC Notebook . Issue 3. http://www.sph.unc.edu/courses/eric/eric_notebooks.htm University of North Carolina at Chapel Hill School of Public Health, Department of Epidemiology, and the Epidemiologic Research & Information Center (September 1999). ERIC Notebook . Issue 5. http://www.sph.unc.edu/courses/eric/eric_notebooks.htm University of North Carolina at Chapel Hill School of Public Health, Department of Epidemiology (August 2000). Laboratory Instructor’s Guide: Analytic Study Designs. Epid 168 lecture series. http://www.epidemiolog.net/epid168/labs/AnalyticStudExerInstGuid2000.pdf
  • 97.
    2005 PHIN TrainingDevelopment Team Pia MacDonald, PhD, MPH Director, NCCPHP Jennifer Horney, MPH Director, Training and Education, NCCPHP Kim Brunette, MPH Epidemiologist, NCCPHP Anjum Hajat, MPH Epidemiologist, NCCPHP Sarah Pfau, MPH Consultant