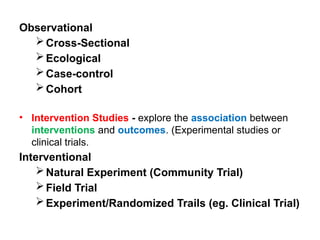
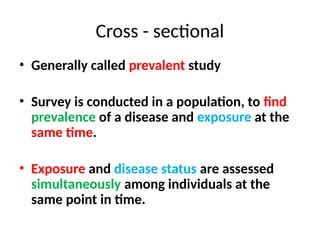
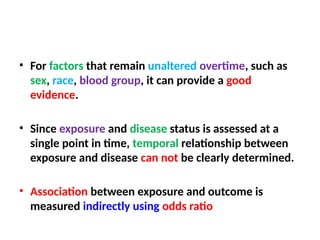
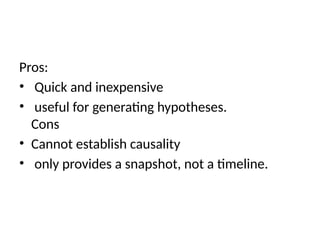
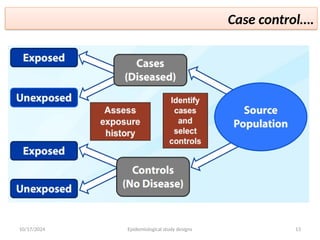
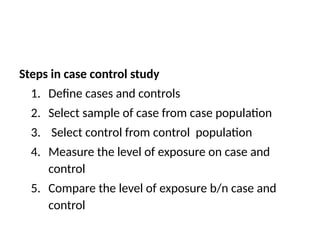
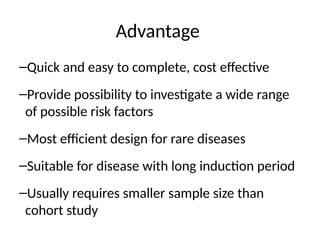
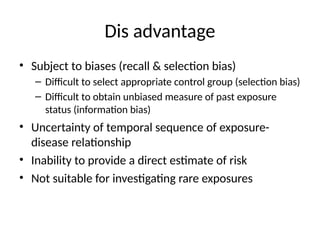
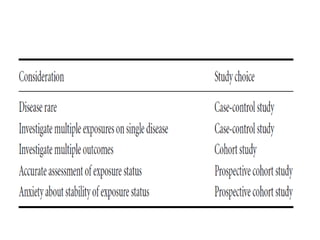
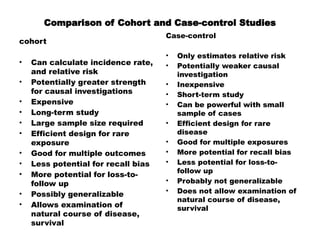
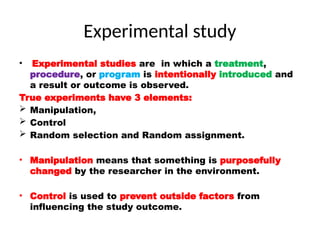
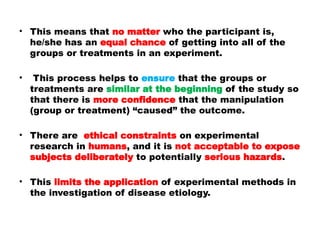
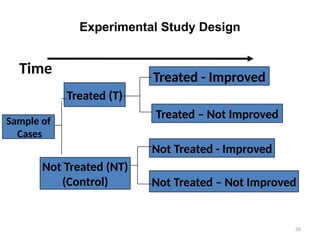
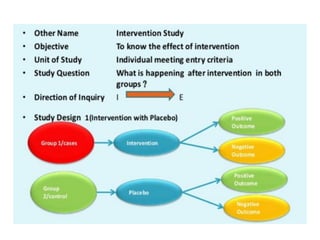
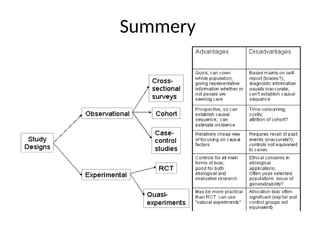
Types of epidemiological
studies, their use and limitation.
Martha S.(MPH)
• Epidemiological studies: are research
investigations that explore the distribution,
patterns, and determinants of health and
disease condition in defined populations.
• They are crucial for identifying risk factors,
understanding disease mechanisms, and
informing public health interventions.
Types of epidemiological studies
• Observational Studies - examine associations between risk factors
and outcomes.
 they are classified as
Analytical - determinants and risk of disease.
Purpose/ Aim
 Search for cause and effect.
Why?? How??
 Quantify the association between exposure and outcome
 Measure of association
 Test hypothesis about causal relationship
• Proof Vs Sufficient evidence
descriptive - patterns and frequency of disease.
• Describes the general characteristics of the
distribution of a disease in relation to person, place
and time.
Who? Where? When?
• It provides valuable information to allocate resources
efficiently and plan effective prevention or
education programs.
• It provides the first important clues about possible
determinants of a disease (formulation of hypothesis).
Observational
Cross-Sectional
Ecological
Case-control
Cohort
• Intervention Studies - explore the association between
interventions and outcomes. (Experimental studies or
clinical trials.
Interventional
Natural Experiment (Community Trial)
Field Trial
Experiment/Randomized Trails (eg. Clinical Trial)
Cross - sectional
• Generally called prevalent study
• Survey is conducted in a population, to find
prevalence of a disease and exposure at the
same time.
• Exposure and disease status are assessed
simultaneously among individuals at the
same point in time.
• For factors that remain unaltered overtime, such as
sex, race, blood group, it can provide a good
evidence.
• Since exposure and disease status is assessed at a
single point in time, temporal relationship between
exposure and disease can not be clearly determined.
• Association between exposure and outcome is
measured indirectly using odds ratio
Pros:
• Quick and inexpensive
• useful for generating hypotheses.
Cons
• Cannot establish causality
• only provides a snapshot, not a timeline.
Ecological studies
• The characteristic of ecological studies is that exposure and
outcome are measured on populations/groups, rather than on
individuals.
• The units of observation may be populations defined by:
 Place of residence (counties, regions, districts, etc),
 Personal characteristics, such as race, religion, or socio-
economic status, or by
 Time (birth cohorts).
• Usually, these studies are descriptive, in that they exploit
preexisting sources of information, rather than data collected to
investigate a specific hypothesis.
Pros:
• Useful for generating hypotheses and
• examining trends over time.
Cons:
• Ecological fallacy: associations may not hold at
the individual level.
Case-control studies
• Involves identification of individuals with
(case) and without (controls) a particular
disease or outcome of interest, then measure
level of exposure to the factor in each group.
– Case-subjects have outcome of interest
– Control-subjects do not have outcome of interest
• Both cases and controls must be chosen
independently of their exposure status
• The investigator then compares the frequency
of exposure of the two groups.
10/17/2024 Epidemiological study designs 13
Case control….
Steps in case control study
1. Define cases and controls
2. Select sample of case from case population
3. Select control from control population
4. Measure the level of exposure on case and
control
5. Compare the level of exposure b/n case and
control
Advantage
–Quick and easy to complete, cost effective
–Provide possibility to investigate a wide range
of possible risk factors
–Most efficient design for rare diseases
–Suitable for disease with long induction period
–Usually requires smaller sample size than
cohort study
Dis advantage
• Subject to biases (recall & selection bias)
– Difficult to select appropriate control group (selection bias)
– Difficult to obtain unbiased measure of past exposure
status (information bias)
• Uncertainty of temporal sequence of exposure-
disease relationship
• Inability to provide a direct estimate of risk
• Not suitable for investigating rare exposures
Cohort study
• A cohort study involves one or more groups of subjects,
defined by their exposure status, being followed through
time to identify an outcome of interest (usually disease onset).
• The aim is to determine whether initial exposure status
influences risk of subsequent disease.
• Two particular types of cohort study are the prospective
cohort study and the retrospective cohort study.
• The only difference between these approaches is with
respect to the timing of collecting exposure and disease
information
• In the prospective approach cohort(s) are identified by their
exposure status presently and are followed up to determine
any future disease onset.
• The retrospective approach identifies the exposure status of
cohort(s) in the past and in a parallel sense they are ‘followed-up’
until the present time, when their disease status is determined.
• The latter approach will undoubtedly be quicker and less
expensive but may not always be appropriate.
• The major advantages of a prospective study are that it can be
determined which exposure is measured and how; if and when change
in exposure status is measured.
• The cohort approach is suitable when the
disease outcome is common, and is
particularly suited to determine the
effects of exposure on a variety of
disease outcomes.
Comparison of Cohort and Case-control Studies
Case-control
• Only estimates relative risk
• Potentially weaker causal
investigation
• Inexpensive
• Short-term study
• Can be powerful with small
sample of cases
• Efficient design for rare
disease
• Good for multiple exposures
• More potential for recall bias
• Less potential for loss-to-
follow up
• Probably not generalizable
• Does not allow examination of
natural course of disease,
survival
cohort
• Can calculate incidence rate,
and relative risk
• Potentially greater strength
for causal investigations
• Expensive
• Long-term study
• Large sample size required
• Efficient design for rare
exposure
• Good for multiple outcomes
• Less potential for recall bias
• More potential for loss-to-
follow up
• Possibly generalizable
• Allows examination of
natural course of disease,
survival
Experimental study
• Experimental studies are in which a treatment,
procedure, or program is intentionally introduced and
a result or outcome is observed.
True experiments have 3 elements:
 Manipulation,
 Control
 Random selection and Random assignment.
• Manipulation means that something is purposefully
changed by the researcher in the environment.
• Control is used to prevent outside factors from
influencing the study outcome.
• When something is manipulated and controlled and then
the outcome happens, it makes us more confident that
the manipulation “caused” the outcome.
• In addition, experiments involve highly controlled
and systematic procedures in an effort to
minimize error and bias which also increases our
confidence that the manipulation “caused” the outcome.
• Another key element of a true experiment is random
assignment.
• Random assignment means that if there are groups or
treatments in the experiment, participants are assigned
to these groups or treatments, randomly (like the flip of
a coin).
• This means that no matter who the participant is,
he/she has an equal chance of getting into all of the
groups or treatments in an experiment.
• This process helps to ensure that the groups or
treatments are similar at the beginning of the study so
that there is more confidence that the manipulation
(group or treatment) “caused” the outcome.
• There are ethical constraints on experimental
research in humans, and it is not acceptable to expose
subjects deliberately to potentially serious hazards.
• This limits the application of experimental methods in
the investigation of disease etiology.
Experimental Study Design
Time
Sample of
Cases
Treated (T)
Not Treated (NT)
(Control)
Treated - Improved
Treated – Not Improved
Not Treated - Improved
Not Treated – Not Improved
26
Summery
Measuring disease
frequency
Measuring disease frequency
Measuring disease frequency is essential in
epidemiology to understand how often a disease
occurs in a population.
1. Incidence
2. Prevalence
Incidence
The incidence rate is a measure used to determine the frequency of new
cases of a disease in a specific population over a defined time period.
It is typically expressed as the number of new cases per unit of
population (e.g., per 1,000 or 100,000 people) per year.
Calculation:
The formula for the incidence rate is:
{Incidence Rate} = {Number of New Cases{Total Population at Risk}}
*{Multiplier}
• Number of New Cases: New instances of the disease during the specified
time period.
Total Population at Risk: The population that is at risk of developing the
disease during that time.
Multiplier: Commonly 1,000 or 100,000 to make the rate more interpretable.
Example:
If a population of 100,000 people experiences 50 new cases of a disease in
one year, the incidence rate would be:
{Incidence Rate} = {50}/{100,000} *100,000 = 50 cases per 100,000 people
per year}
Importance:
Public Health Planning: Helps identify outbreaks and allocate
resources.
Understanding Risk: Aids in identifying populations at greater
risk and understanding the dynamics of disease spread.
Comparative Studies: Allows comparisons across different
populations or time periods.
Understanding the incidence rate is crucial for effective disease
surveillance and intervention strategies.
Prevalence
• Prevalence is a measure that indicates how widespread a disease is within
a specific population at a given point in time or over a specified period.
• It includes both new and existing cases.
Types of Prevalence:
1. Point Prevalence: Refers to the proportion of a population that has the
disease at a specific point in time. For example, if you measure the number
of cases on a particular day, that is point prevalence.
2. Period Prevalence: Refers to the proportion of the population that has
the disease during a specified period (e.g., a month or a year).
Calculation:
The formula for prevalence is:
{Prevalence} = {Total Number of Cases (new and existing)}{Total
Population}} * 100%
Example:
If a community of 1,000 people has 100 individuals living with a
certain disease at a given time, the prevalence would be:
{Prevalence} = {100}/{1,000} * 100% = 10%
• Importance:
Resource Allocation: Helps public health officials allocate
resources effectively.
Health Planning: Assists in identifying health needs within a
population.
Epidemiological Studies: Useful in studying the burden of
diseases and informing policies.
Understanding prevalence is crucial for assessing public
health issues and planning interventions effectively.
Using HIS to measure health and
disease
 Using a health information system (HIS) to measure health and
disease involves several processes and methodologies that
facilitate the collection, analysis, and dissemination of health-
related data.
 Components of HIS for Measuring Health and Disease:
1. Data Collection:
Sources: HIS collects data from hospitals, clinics, laboratories, and
community health surveys.
Data types include demographic information, clinical records, lab
results, and patient-reported outcomes.
Methods: Surveys, electronic health records (EHRs), health registries,
and mobile health applications can be used to gather data.
2. Data Management:
Storage: Data is stored in secure databases, ensuring confidentiality
and compliance with regulations.
Data Quality Assurance: Regular checks are conducted to ensure
accuracy, completeness, and consistency of data.
3. Data Analysis:
Statistical Methods: Tools are employed to calculate incidence,
prevalence, mortality rates, and other health indicators.
Advanced analytics can reveal trends and patterns.
Predictive Modeling: Helps forecast disease outbreaks and health
trends, aiding in proactive health planning.
4. Reporting and Visualization:
Dashboards: HIS can create real-time dashboards that display key health
metrics for quick reference by healthcare providers and policymakers.
Reports: Regular reports summarize findings and provide insights into public
health issues, guiding resource allocation and intervention strategies.
5. Feedback and Improvement:
Stakeholder Engagement: HIS allows for the integration of feedback from
healthcare providers and patients, facilitating continuous improvement in
health services.
Quality Improvement Initiatives: Data insights drive initiatives aimed at
improving patient care and health outcomes.
Benefits of HIS in Measuring Health and Disease:
1. Comprehensive Health Insights: HIS provides a holistic view of population
health, including morbidity, mortality, and health service utilization.
2. Evidence-Based Decision-Making: Access to reliable data supports
informed decisions regarding public health policies and healthcare practices.
3. Efficient Resource Allocation: Identifying high-burden diseases helps
allocate resources effectively to areas of greatest need.
4. Enhanced Public Health Surveillance: HIS enables real-time monitoring of
disease outbreaks and trends, allowing for rapid public health responses.
5. Facilitation of Research: Researchers can utilize aggregated health data to
study disease patterns, risk factors, and treatment outcomes.
Challenges
Data Privacy and Security: Ensuring the protection
of sensitive health information is paramount.
Integration of Systems: Combining data from
various sources and systems can be complex.
Data Completeness and Quality: Incomplete data
can lead to misleading conclusions.
Conclusion
• Health information systems are crucial for
effectively measuring health and disease
within populations.
• By leveraging these systems, healthcare
organizations and public health authorities can
enhance their understanding of health
dynamics, improve service delivery.
Thank you

Observational and experimental study designs part 1.pptx

  • 1.
    Types of epidemiological studies,their use and limitation. Martha S.(MPH)
  • 2.
    • Epidemiological studies:are research investigations that explore the distribution, patterns, and determinants of health and disease condition in defined populations. • They are crucial for identifying risk factors, understanding disease mechanisms, and informing public health interventions.
  • 3.
    Types of epidemiologicalstudies • Observational Studies - examine associations between risk factors and outcomes.  they are classified as Analytical - determinants and risk of disease. Purpose/ Aim  Search for cause and effect. Why?? How??  Quantify the association between exposure and outcome  Measure of association  Test hypothesis about causal relationship • Proof Vs Sufficient evidence
  • 4.
    descriptive - patternsand frequency of disease. • Describes the general characteristics of the distribution of a disease in relation to person, place and time. Who? Where? When? • It provides valuable information to allocate resources efficiently and plan effective prevention or education programs. • It provides the first important clues about possible determinants of a disease (formulation of hypothesis).
  • 5.
    Observational Cross-Sectional Ecological Case-control Cohort • Intervention Studies- explore the association between interventions and outcomes. (Experimental studies or clinical trials. Interventional Natural Experiment (Community Trial) Field Trial Experiment/Randomized Trails (eg. Clinical Trial)
  • 6.
    Cross - sectional •Generally called prevalent study • Survey is conducted in a population, to find prevalence of a disease and exposure at the same time. • Exposure and disease status are assessed simultaneously among individuals at the same point in time.
  • 7.
    • For factorsthat remain unaltered overtime, such as sex, race, blood group, it can provide a good evidence. • Since exposure and disease status is assessed at a single point in time, temporal relationship between exposure and disease can not be clearly determined. • Association between exposure and outcome is measured indirectly using odds ratio
  • 8.
    Pros: • Quick andinexpensive • useful for generating hypotheses. Cons • Cannot establish causality • only provides a snapshot, not a timeline.
  • 9.
    Ecological studies • Thecharacteristic of ecological studies is that exposure and outcome are measured on populations/groups, rather than on individuals. • The units of observation may be populations defined by:  Place of residence (counties, regions, districts, etc),  Personal characteristics, such as race, religion, or socio- economic status, or by  Time (birth cohorts). • Usually, these studies are descriptive, in that they exploit preexisting sources of information, rather than data collected to investigate a specific hypothesis.
  • 10.
    Pros: • Useful forgenerating hypotheses and • examining trends over time. Cons: • Ecological fallacy: associations may not hold at the individual level.
  • 11.
    Case-control studies • Involvesidentification of individuals with (case) and without (controls) a particular disease or outcome of interest, then measure level of exposure to the factor in each group. – Case-subjects have outcome of interest – Control-subjects do not have outcome of interest
  • 12.
    • Both casesand controls must be chosen independently of their exposure status • The investigator then compares the frequency of exposure of the two groups.
  • 13.
    10/17/2024 Epidemiological studydesigns 13 Case control….
  • 14.
    Steps in casecontrol study 1. Define cases and controls 2. Select sample of case from case population 3. Select control from control population 4. Measure the level of exposure on case and control 5. Compare the level of exposure b/n case and control
  • 15.
    Advantage –Quick and easyto complete, cost effective –Provide possibility to investigate a wide range of possible risk factors –Most efficient design for rare diseases –Suitable for disease with long induction period –Usually requires smaller sample size than cohort study
  • 16.
    Dis advantage • Subjectto biases (recall & selection bias) – Difficult to select appropriate control group (selection bias) – Difficult to obtain unbiased measure of past exposure status (information bias) • Uncertainty of temporal sequence of exposure- disease relationship • Inability to provide a direct estimate of risk • Not suitable for investigating rare exposures
  • 17.
    Cohort study • Acohort study involves one or more groups of subjects, defined by their exposure status, being followed through time to identify an outcome of interest (usually disease onset). • The aim is to determine whether initial exposure status influences risk of subsequent disease. • Two particular types of cohort study are the prospective cohort study and the retrospective cohort study. • The only difference between these approaches is with respect to the timing of collecting exposure and disease information
  • 18.
    • In theprospective approach cohort(s) are identified by their exposure status presently and are followed up to determine any future disease onset. • The retrospective approach identifies the exposure status of cohort(s) in the past and in a parallel sense they are ‘followed-up’ until the present time, when their disease status is determined. • The latter approach will undoubtedly be quicker and less expensive but may not always be appropriate. • The major advantages of a prospective study are that it can be determined which exposure is measured and how; if and when change in exposure status is measured.
  • 20.
    • The cohortapproach is suitable when the disease outcome is common, and is particularly suited to determine the effects of exposure on a variety of disease outcomes.
  • 22.
    Comparison of Cohortand Case-control Studies Case-control • Only estimates relative risk • Potentially weaker causal investigation • Inexpensive • Short-term study • Can be powerful with small sample of cases • Efficient design for rare disease • Good for multiple exposures • More potential for recall bias • Less potential for loss-to- follow up • Probably not generalizable • Does not allow examination of natural course of disease, survival cohort • Can calculate incidence rate, and relative risk • Potentially greater strength for causal investigations • Expensive • Long-term study • Large sample size required • Efficient design for rare exposure • Good for multiple outcomes • Less potential for recall bias • More potential for loss-to- follow up • Possibly generalizable • Allows examination of natural course of disease, survival
  • 23.
    Experimental study • Experimentalstudies are in which a treatment, procedure, or program is intentionally introduced and a result or outcome is observed. True experiments have 3 elements:  Manipulation,  Control  Random selection and Random assignment. • Manipulation means that something is purposefully changed by the researcher in the environment. • Control is used to prevent outside factors from influencing the study outcome.
  • 24.
    • When somethingis manipulated and controlled and then the outcome happens, it makes us more confident that the manipulation “caused” the outcome. • In addition, experiments involve highly controlled and systematic procedures in an effort to minimize error and bias which also increases our confidence that the manipulation “caused” the outcome. • Another key element of a true experiment is random assignment. • Random assignment means that if there are groups or treatments in the experiment, participants are assigned to these groups or treatments, randomly (like the flip of a coin).
  • 25.
    • This meansthat no matter who the participant is, he/she has an equal chance of getting into all of the groups or treatments in an experiment. • This process helps to ensure that the groups or treatments are similar at the beginning of the study so that there is more confidence that the manipulation (group or treatment) “caused” the outcome. • There are ethical constraints on experimental research in humans, and it is not acceptable to expose subjects deliberately to potentially serious hazards. • This limits the application of experimental methods in the investigation of disease etiology.
  • 26.
    Experimental Study Design Time Sampleof Cases Treated (T) Not Treated (NT) (Control) Treated - Improved Treated – Not Improved Not Treated - Improved Not Treated – Not Improved 26
  • 28.
  • 29.
  • 30.
    Measuring disease frequency Measuringdisease frequency is essential in epidemiology to understand how often a disease occurs in a population. 1. Incidence 2. Prevalence
  • 31.
    Incidence The incidence rateis a measure used to determine the frequency of new cases of a disease in a specific population over a defined time period. It is typically expressed as the number of new cases per unit of population (e.g., per 1,000 or 100,000 people) per year. Calculation: The formula for the incidence rate is: {Incidence Rate} = {Number of New Cases{Total Population at Risk}} *{Multiplier}
  • 32.
    • Number ofNew Cases: New instances of the disease during the specified time period. Total Population at Risk: The population that is at risk of developing the disease during that time. Multiplier: Commonly 1,000 or 100,000 to make the rate more interpretable. Example: If a population of 100,000 people experiences 50 new cases of a disease in one year, the incidence rate would be: {Incidence Rate} = {50}/{100,000} *100,000 = 50 cases per 100,000 people per year}
  • 33.
    Importance: Public Health Planning:Helps identify outbreaks and allocate resources. Understanding Risk: Aids in identifying populations at greater risk and understanding the dynamics of disease spread. Comparative Studies: Allows comparisons across different populations or time periods. Understanding the incidence rate is crucial for effective disease surveillance and intervention strategies.
  • 34.
    Prevalence • Prevalence isa measure that indicates how widespread a disease is within a specific population at a given point in time or over a specified period. • It includes both new and existing cases. Types of Prevalence: 1. Point Prevalence: Refers to the proportion of a population that has the disease at a specific point in time. For example, if you measure the number of cases on a particular day, that is point prevalence. 2. Period Prevalence: Refers to the proportion of the population that has the disease during a specified period (e.g., a month or a year).
  • 35.
    Calculation: The formula forprevalence is: {Prevalence} = {Total Number of Cases (new and existing)}{Total Population}} * 100% Example: If a community of 1,000 people has 100 individuals living with a certain disease at a given time, the prevalence would be: {Prevalence} = {100}/{1,000} * 100% = 10%
  • 36.
    • Importance: Resource Allocation:Helps public health officials allocate resources effectively. Health Planning: Assists in identifying health needs within a population. Epidemiological Studies: Useful in studying the burden of diseases and informing policies. Understanding prevalence is crucial for assessing public health issues and planning interventions effectively.
  • 37.
    Using HIS tomeasure health and disease
  • 38.
     Using ahealth information system (HIS) to measure health and disease involves several processes and methodologies that facilitate the collection, analysis, and dissemination of health- related data.  Components of HIS for Measuring Health and Disease: 1. Data Collection: Sources: HIS collects data from hospitals, clinics, laboratories, and community health surveys. Data types include demographic information, clinical records, lab results, and patient-reported outcomes. Methods: Surveys, electronic health records (EHRs), health registries, and mobile health applications can be used to gather data.
  • 39.
    2. Data Management: Storage:Data is stored in secure databases, ensuring confidentiality and compliance with regulations. Data Quality Assurance: Regular checks are conducted to ensure accuracy, completeness, and consistency of data. 3. Data Analysis: Statistical Methods: Tools are employed to calculate incidence, prevalence, mortality rates, and other health indicators. Advanced analytics can reveal trends and patterns. Predictive Modeling: Helps forecast disease outbreaks and health trends, aiding in proactive health planning.
  • 40.
    4. Reporting andVisualization: Dashboards: HIS can create real-time dashboards that display key health metrics for quick reference by healthcare providers and policymakers. Reports: Regular reports summarize findings and provide insights into public health issues, guiding resource allocation and intervention strategies. 5. Feedback and Improvement: Stakeholder Engagement: HIS allows for the integration of feedback from healthcare providers and patients, facilitating continuous improvement in health services. Quality Improvement Initiatives: Data insights drive initiatives aimed at improving patient care and health outcomes.
  • 41.
    Benefits of HISin Measuring Health and Disease: 1. Comprehensive Health Insights: HIS provides a holistic view of population health, including morbidity, mortality, and health service utilization. 2. Evidence-Based Decision-Making: Access to reliable data supports informed decisions regarding public health policies and healthcare practices. 3. Efficient Resource Allocation: Identifying high-burden diseases helps allocate resources effectively to areas of greatest need. 4. Enhanced Public Health Surveillance: HIS enables real-time monitoring of disease outbreaks and trends, allowing for rapid public health responses. 5. Facilitation of Research: Researchers can utilize aggregated health data to study disease patterns, risk factors, and treatment outcomes.
  • 42.
    Challenges Data Privacy andSecurity: Ensuring the protection of sensitive health information is paramount. Integration of Systems: Combining data from various sources and systems can be complex. Data Completeness and Quality: Incomplete data can lead to misleading conclusions.
  • 43.
    Conclusion • Health informationsystems are crucial for effectively measuring health and disease within populations. • By leveraging these systems, healthcare organizations and public health authorities can enhance their understanding of health dynamics, improve service delivery.
  • 44.