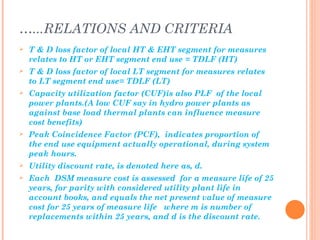
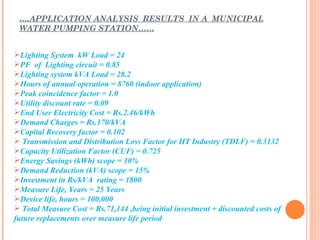
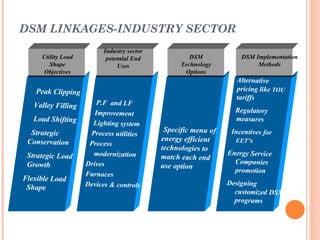
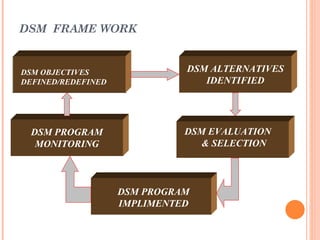
This document discusses electricity demand side management and end use efficiency. It outlines the benefits of demand side management (DSM) programs for electric utilities, including optimizing generation and network utilization and meeting regulator efficiency mandates. It describes traditional utility planning tools like load forecasting and least cost planning, which consider both supply side and demand side alternatives. The document then provides details on DSM, including definitions, frameworks, program implementation methods, technologies and options for the industrial sector. Barriers to DSM programs and ways to enable greater DSM markets are also discussed. In conclusion, the document advocates for customized DSM programs targeting specific end users as a cost-effective alternative to supply side management.


![RELATIONS AND CRITERIA…..
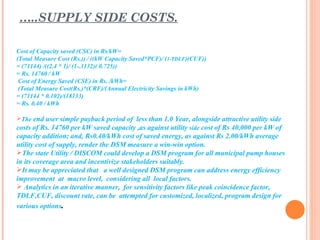
» Capital recovery factor (CRF)
= d × (1 + d)n / [(1 + d)n - 1]
where d = utility discount rate & n = measure life
» Total DSM measure cost
= initial cost × [ 1 + (1/(1+d/100)m) + (1/(1+d/100)2m+
…...)
where d = utility discount rate & m = device life &
the series includes all terms where exponent is less than
the measure life
» Cost of saved capacity (CSC) Rs/kW or Rs/kVA=
(Total measure cost (Rs))
((Saved capacity kVA or kW × PCF) / (1-TDLF) (CUF))
» Cost of saved energy (CSE) Rs/kWh=
(Total measure cost (Rs) × CRF)
(Annual Energy Savings (kWh))](https://image.slidesharecdn.com/electricitydemandsidemanagementandenduseefficiency-120615072923-phpapp01/85/Electricity-demand-side-management-and-end-use-efficiency-10-320.jpg)