Downloaded 200 times
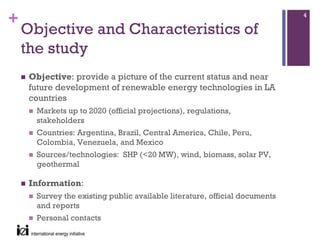

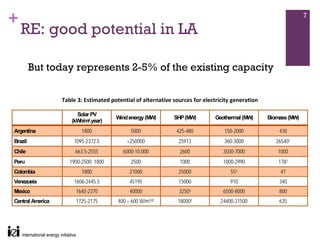
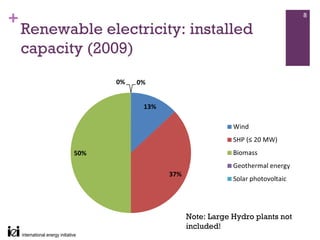
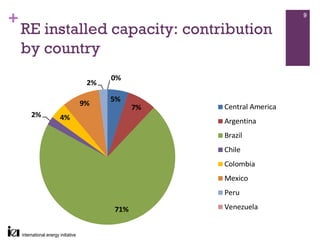
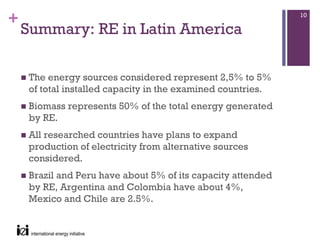

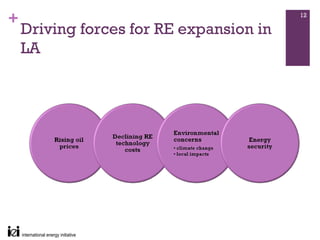
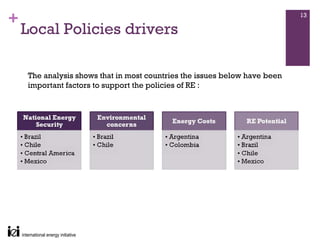

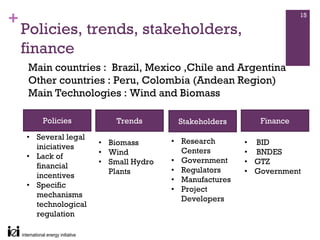


The report analyzes the status and outlook of renewable energy (RE) in Latin America, projecting that renewable sources will contribute 2.5% to 5% of total installed electricity capacity by 2020. It identifies wind and biomass as the most promising technologies for growth, with Brazil and Argentina leading in potential expansion. The study highlights the importance of local policies and stakeholder engagement in fostering RE development across various countries.


![[Smart Grid Market Research] South Korea: Smart Grid Revolution, Zpryme Smart...](https://cdn.slidesharecdn.com/ss_thumbnails/southkoreasmartgridrevolutionjuly2011zprymeresearch-110718093047-phpapp01-thumbnail.jpg?width=640&height=640&fit=bounds)


