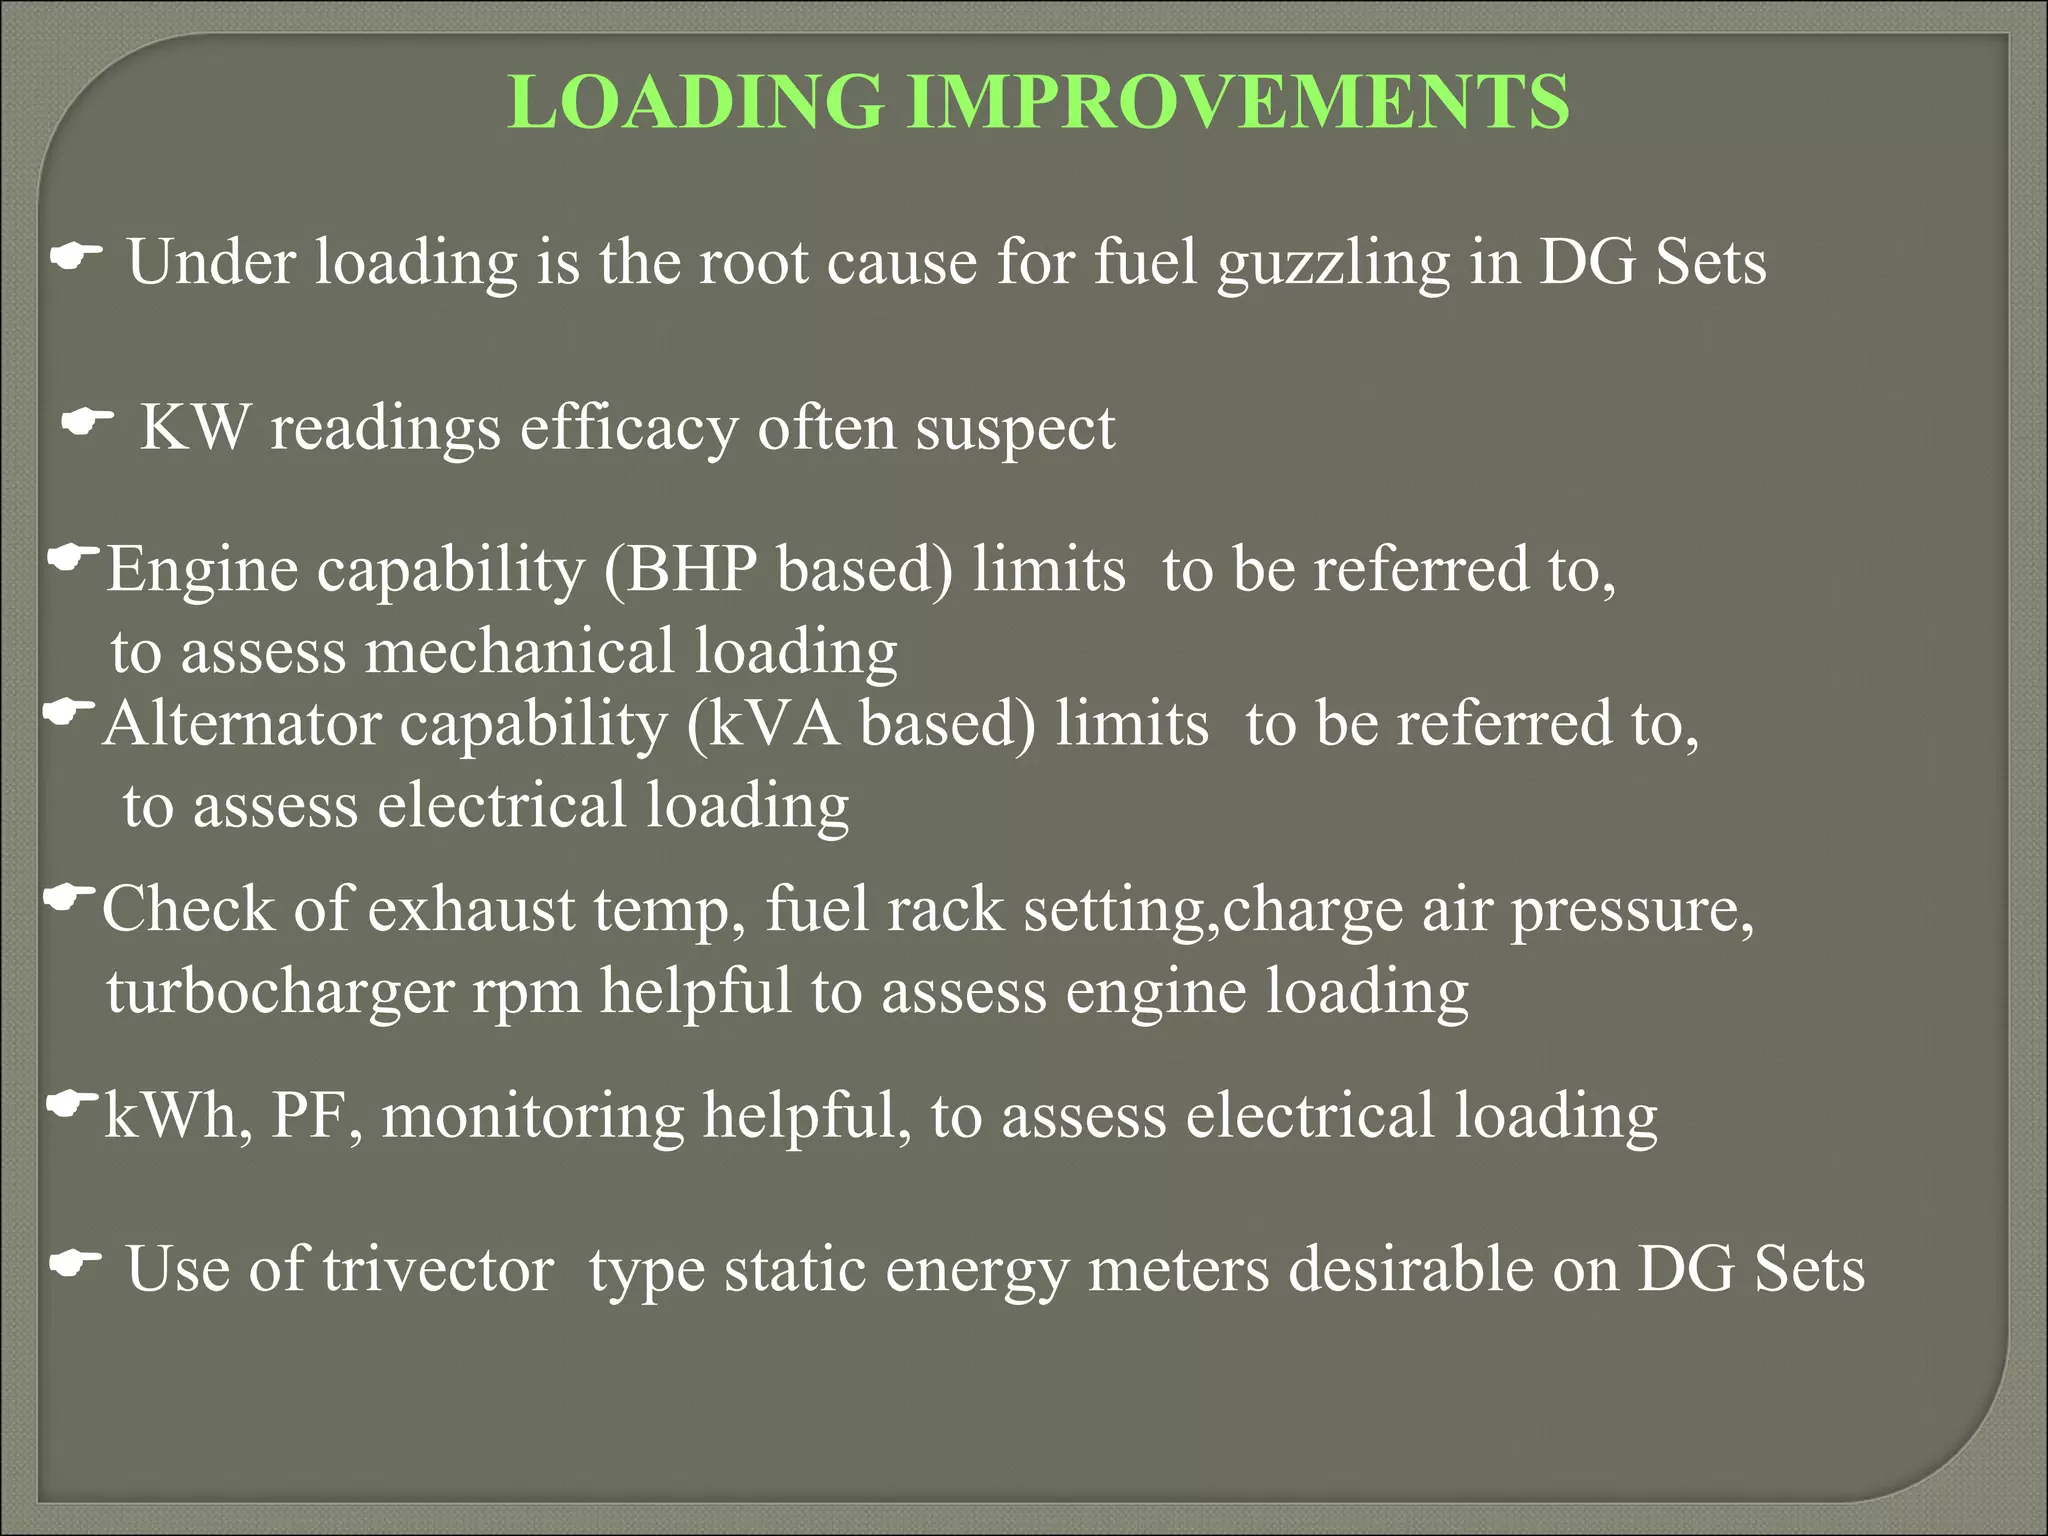
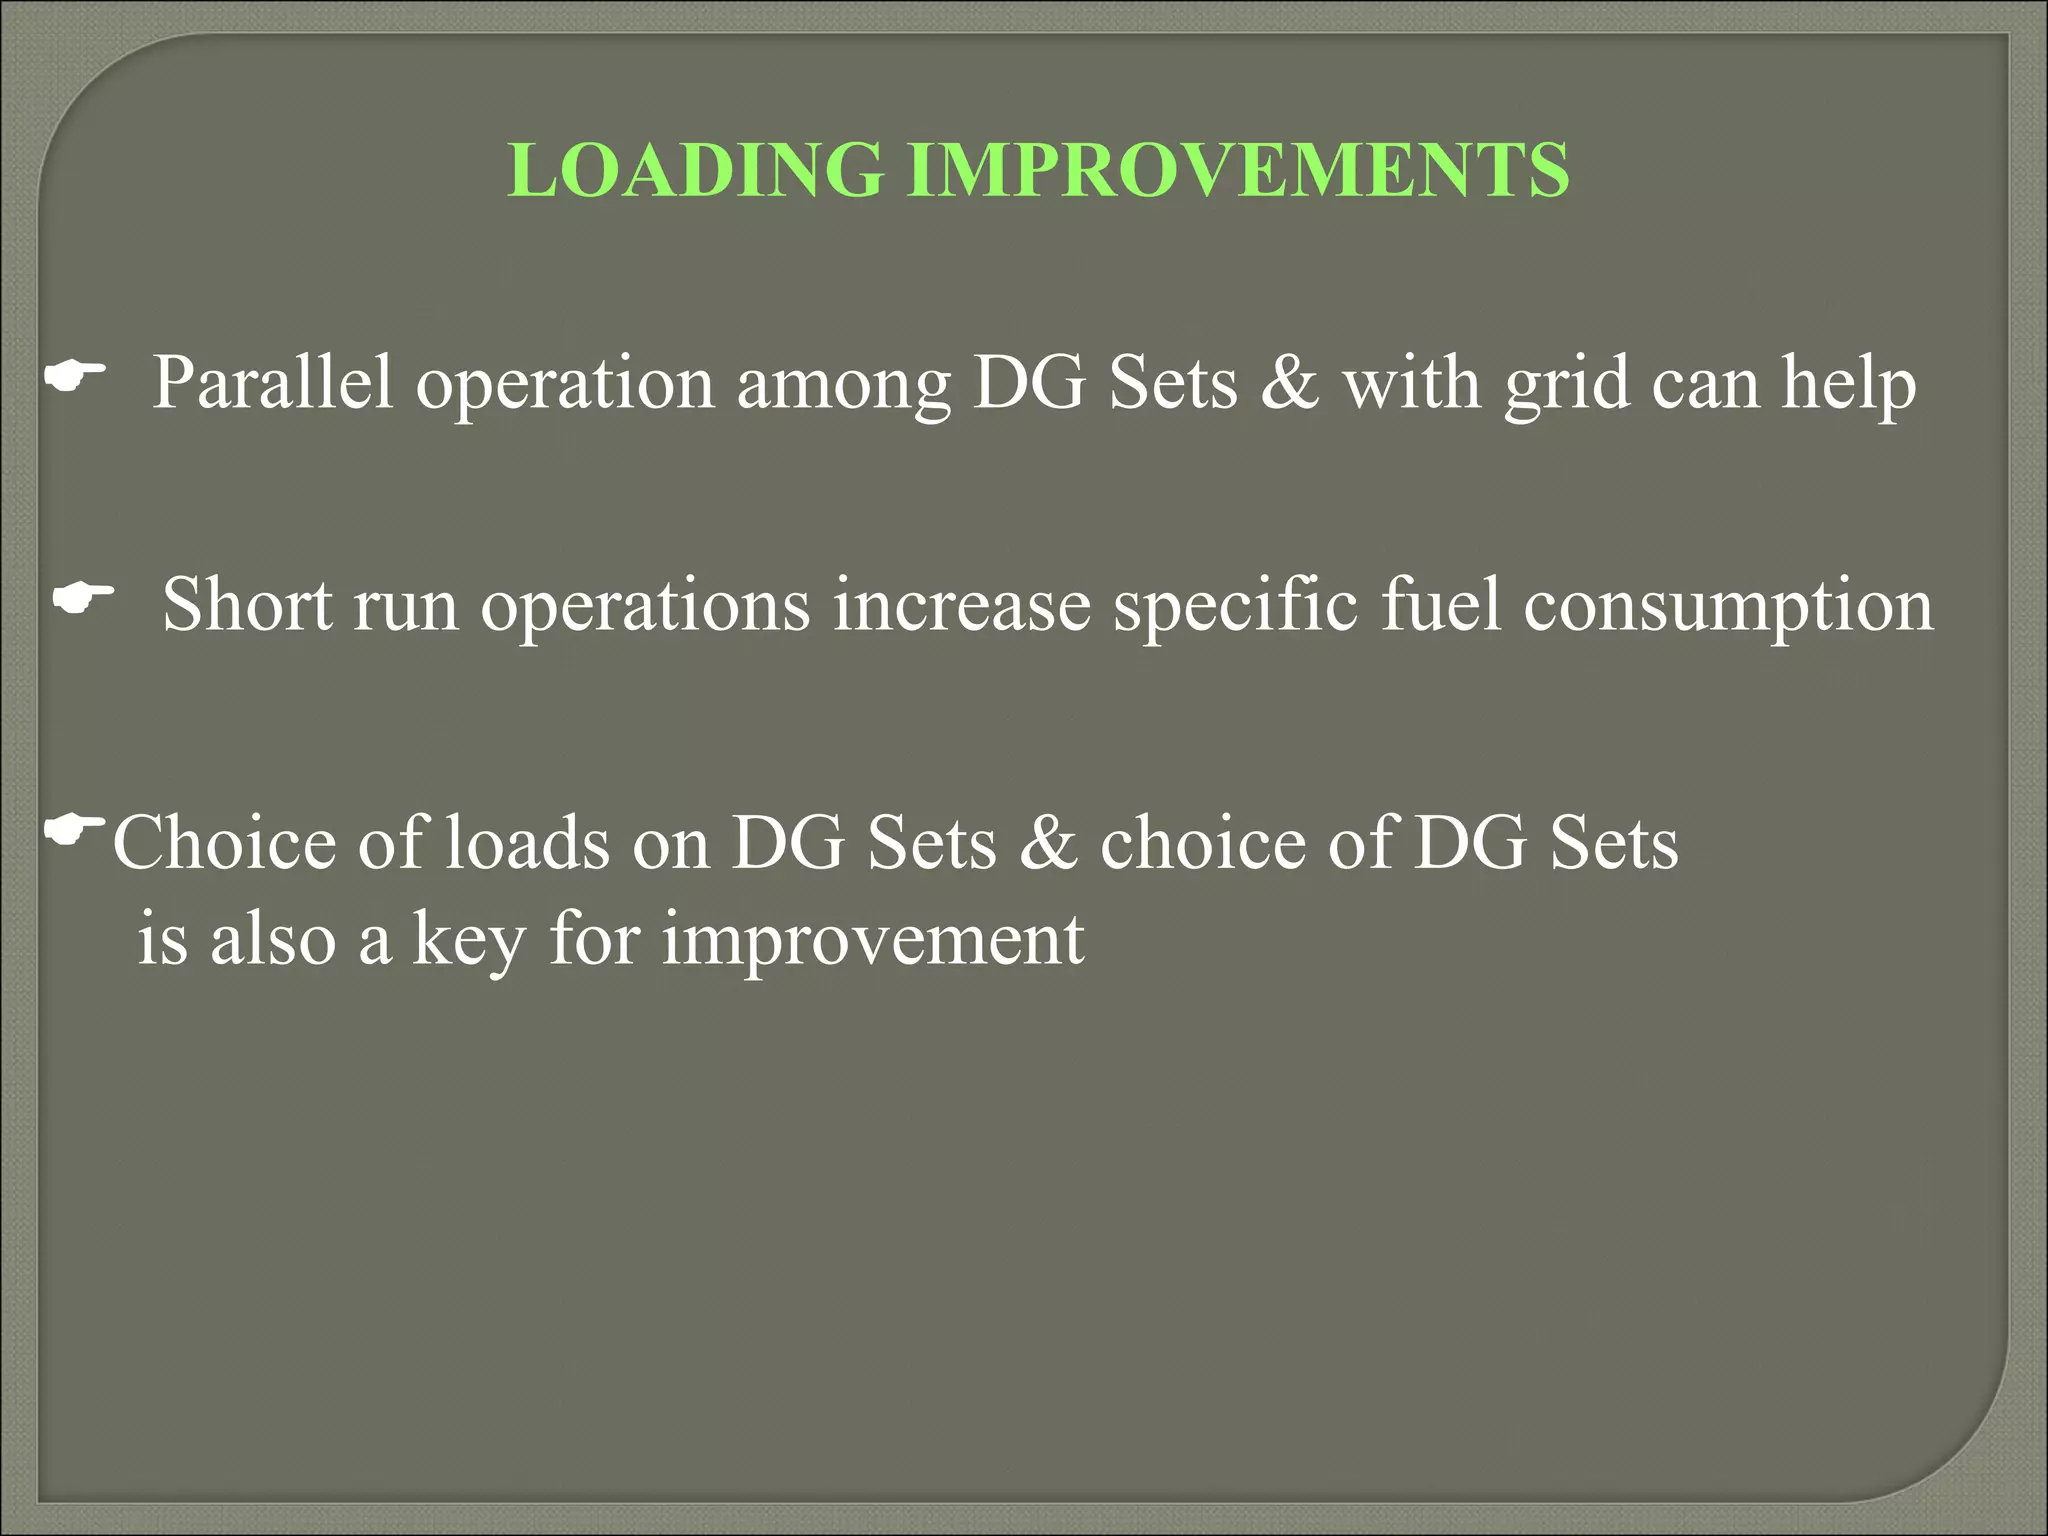
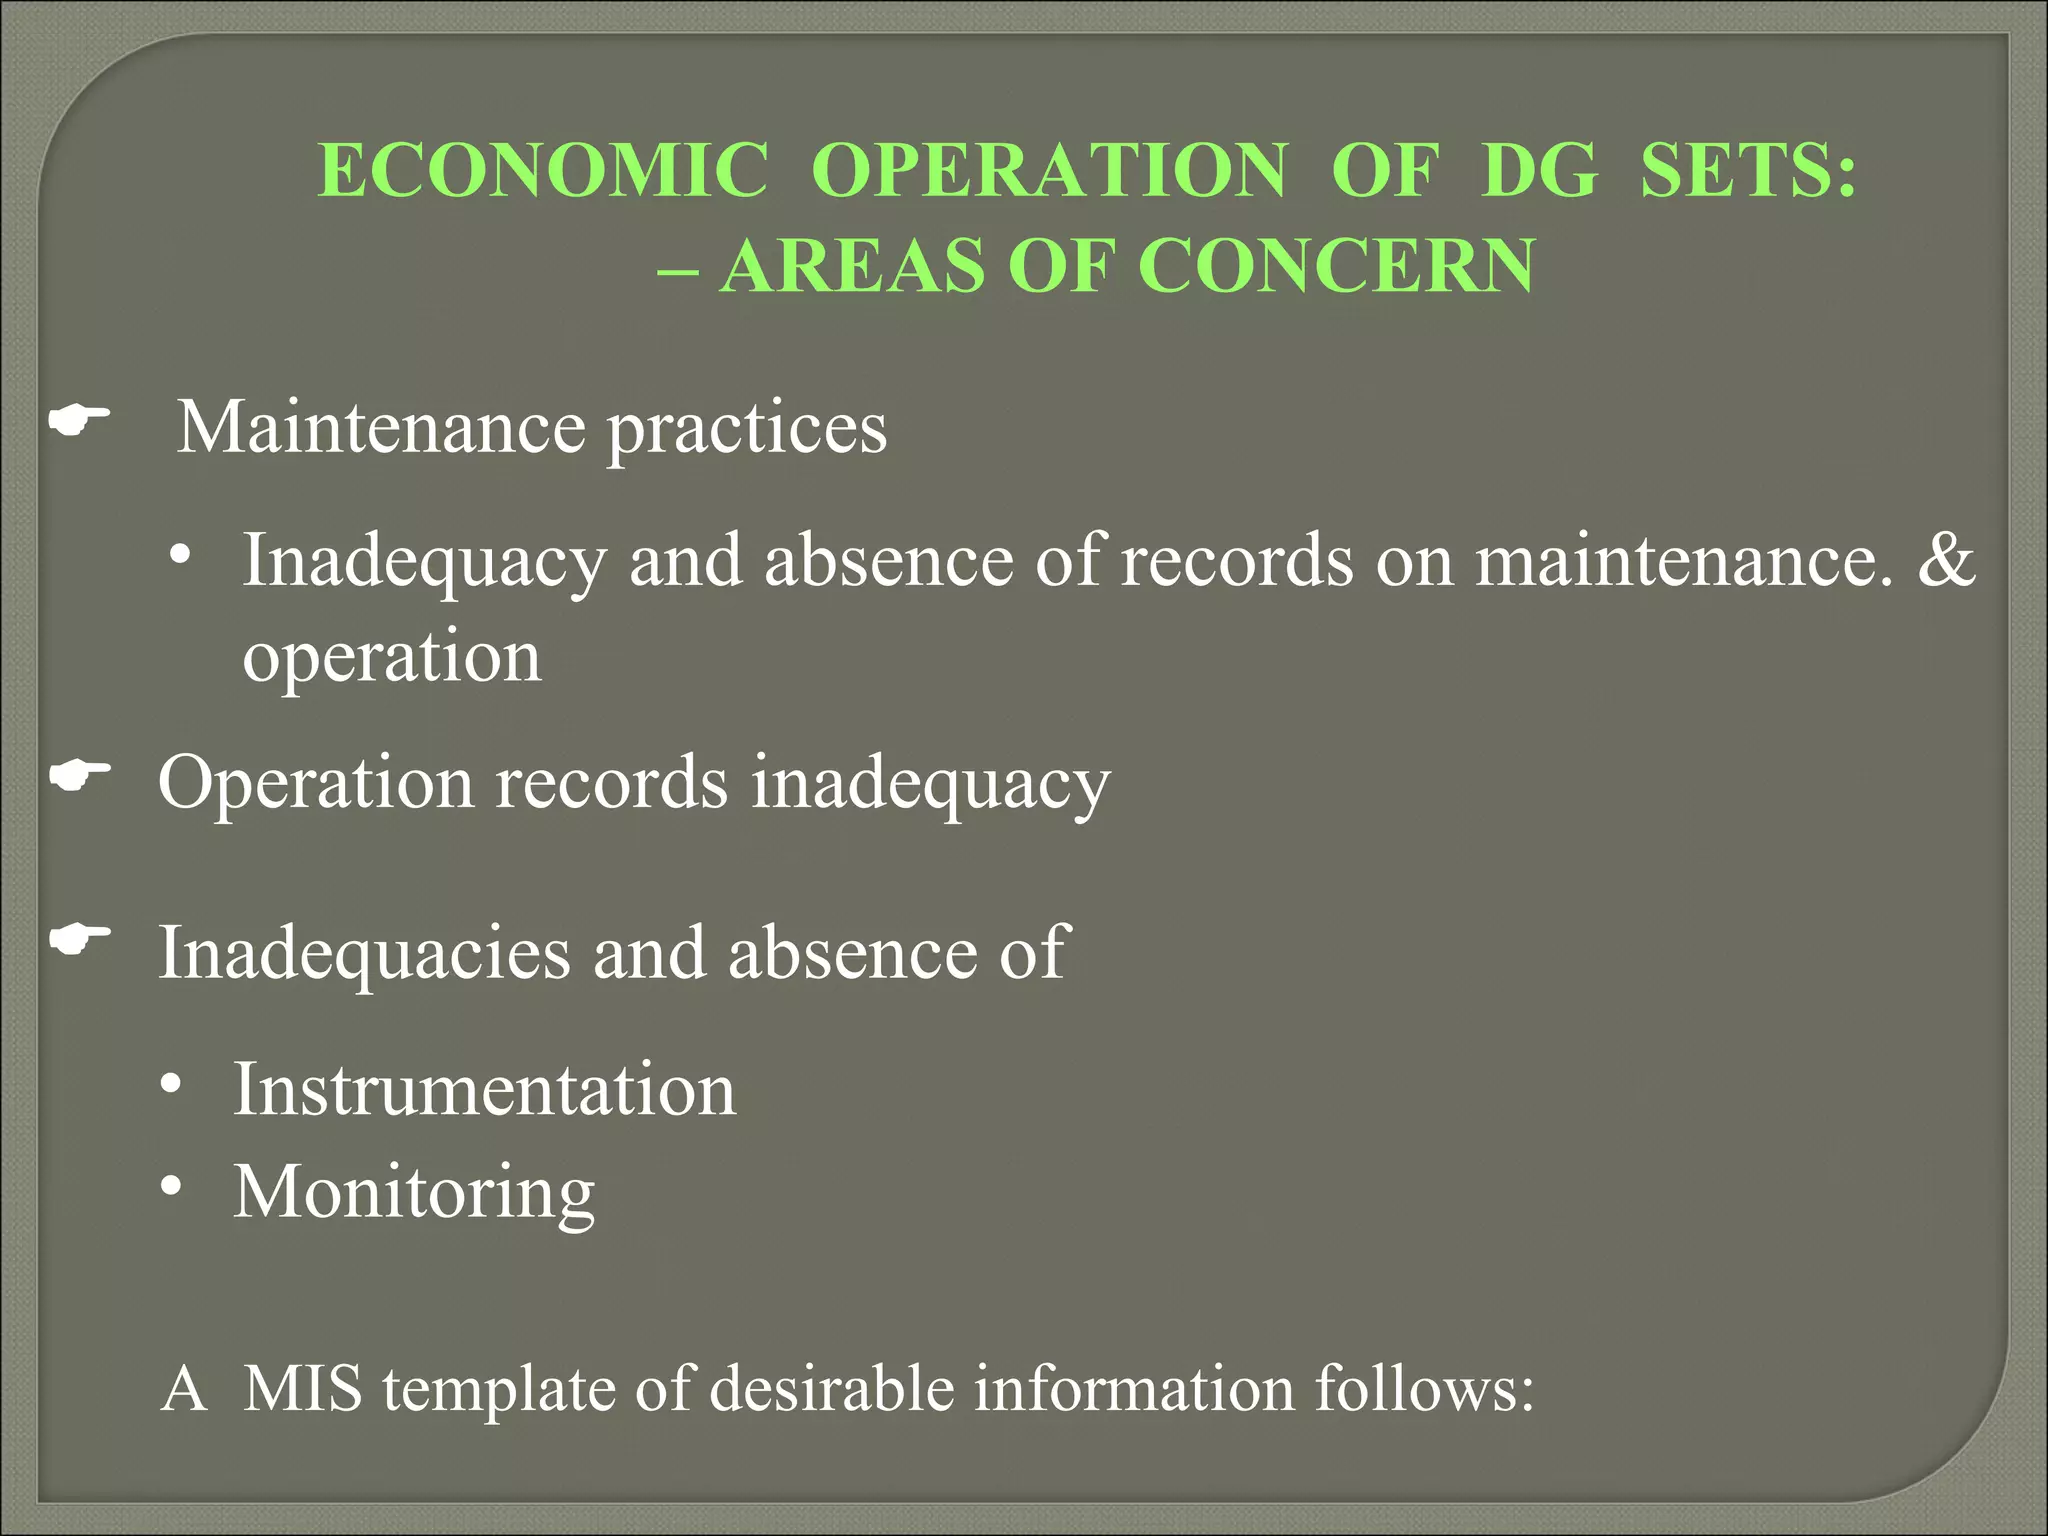
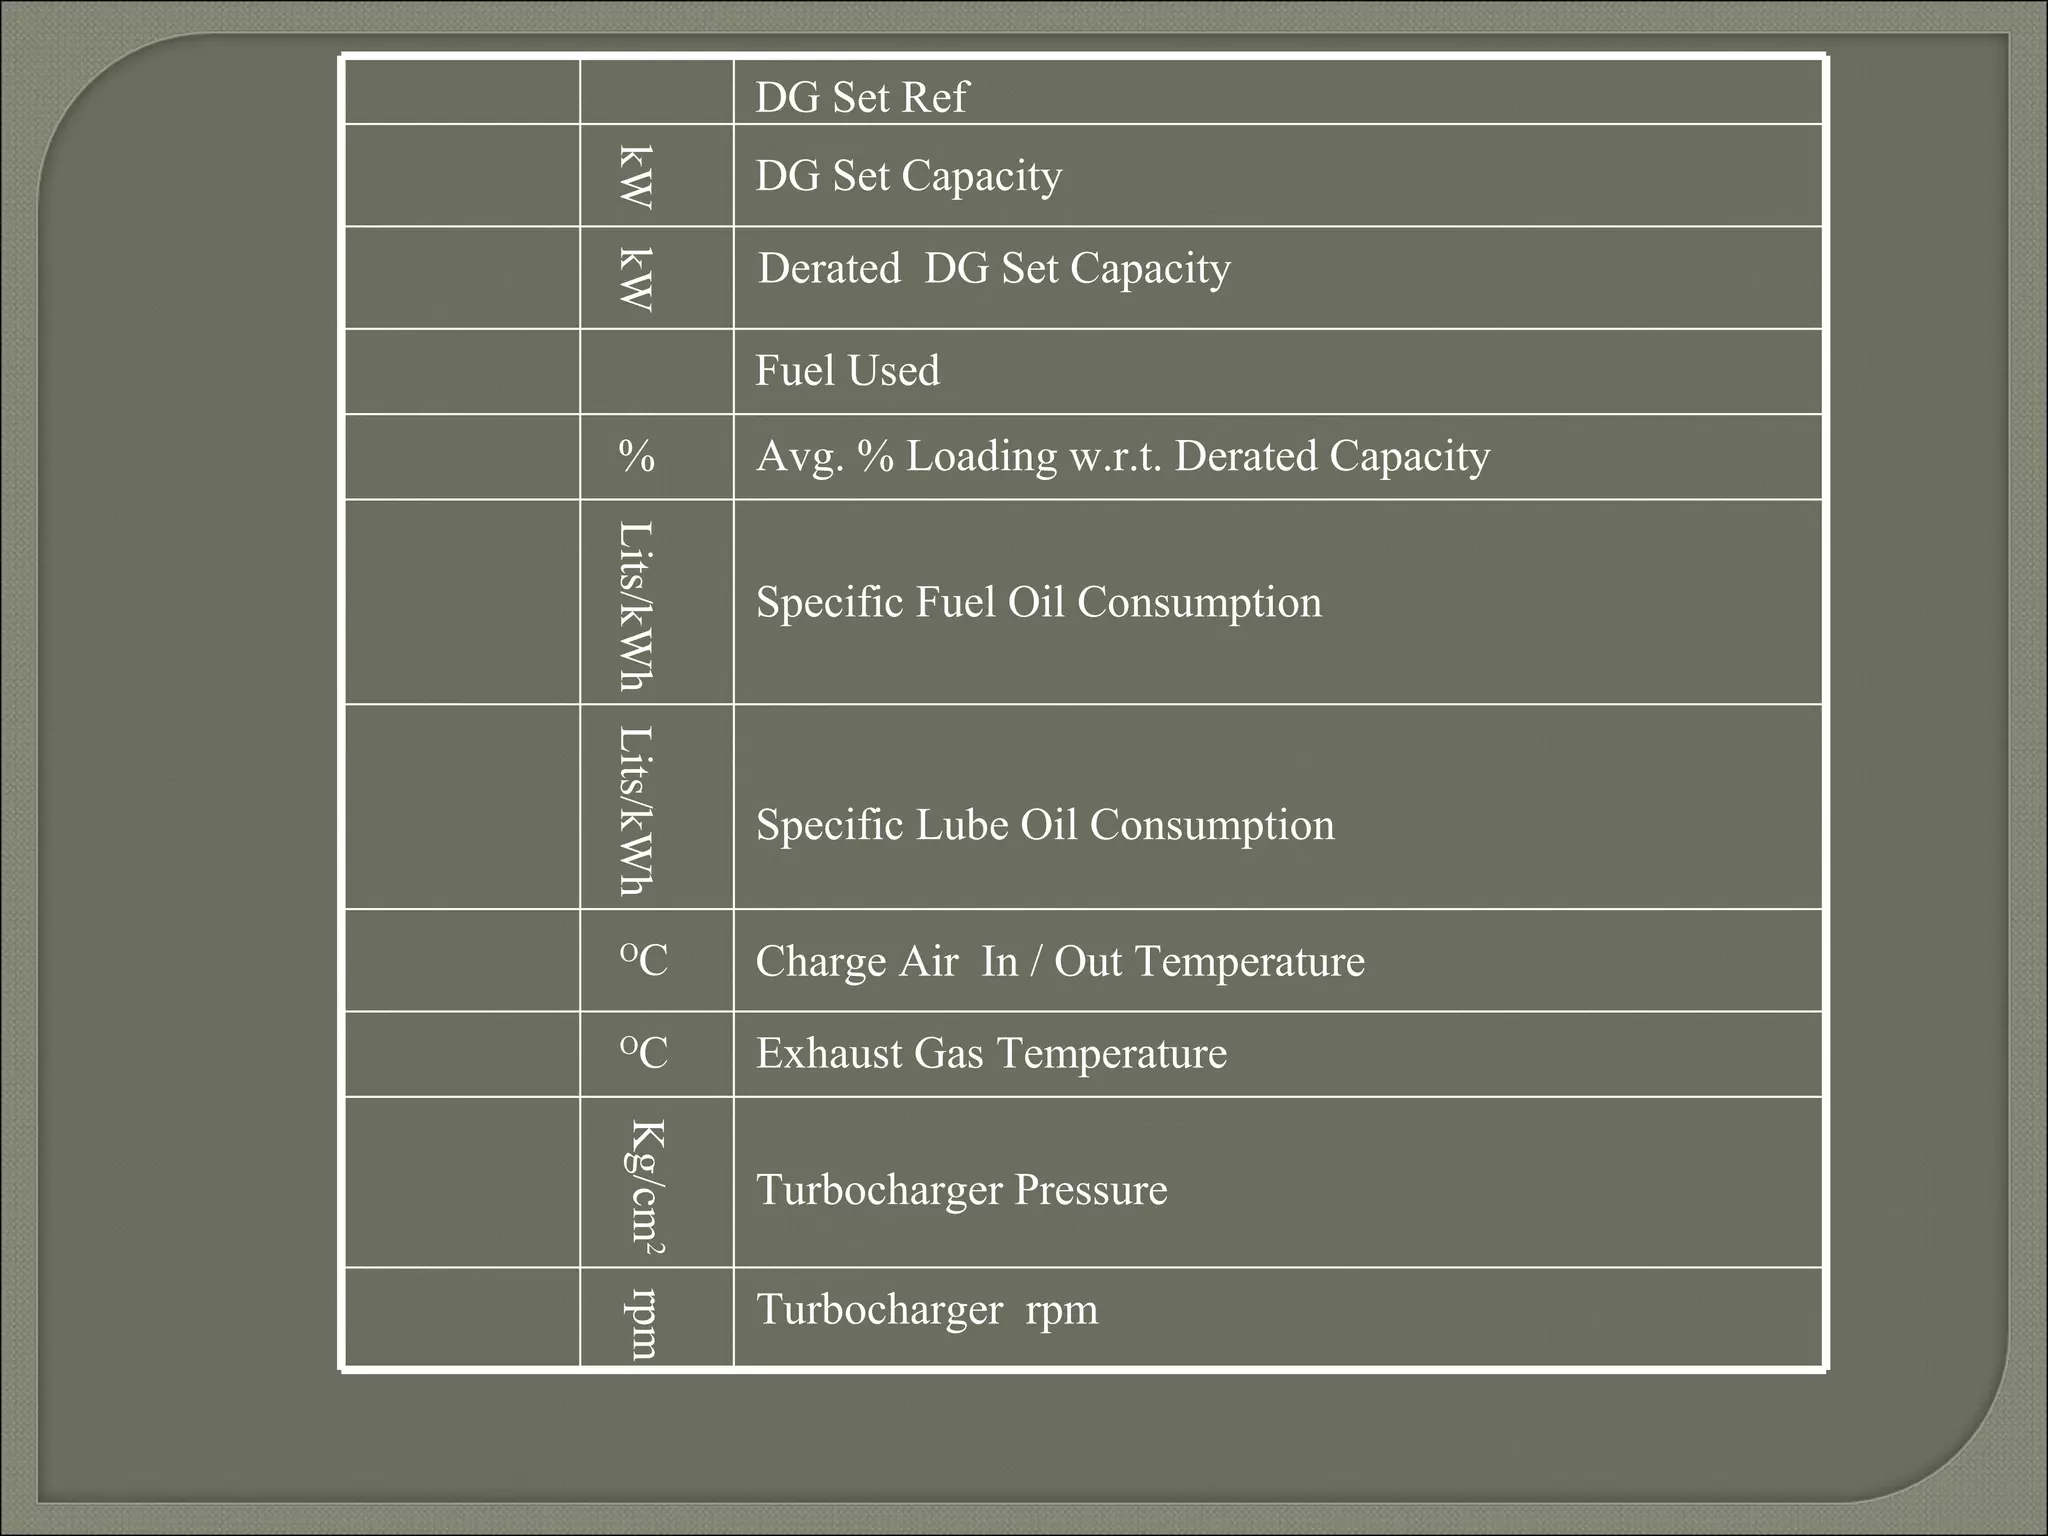
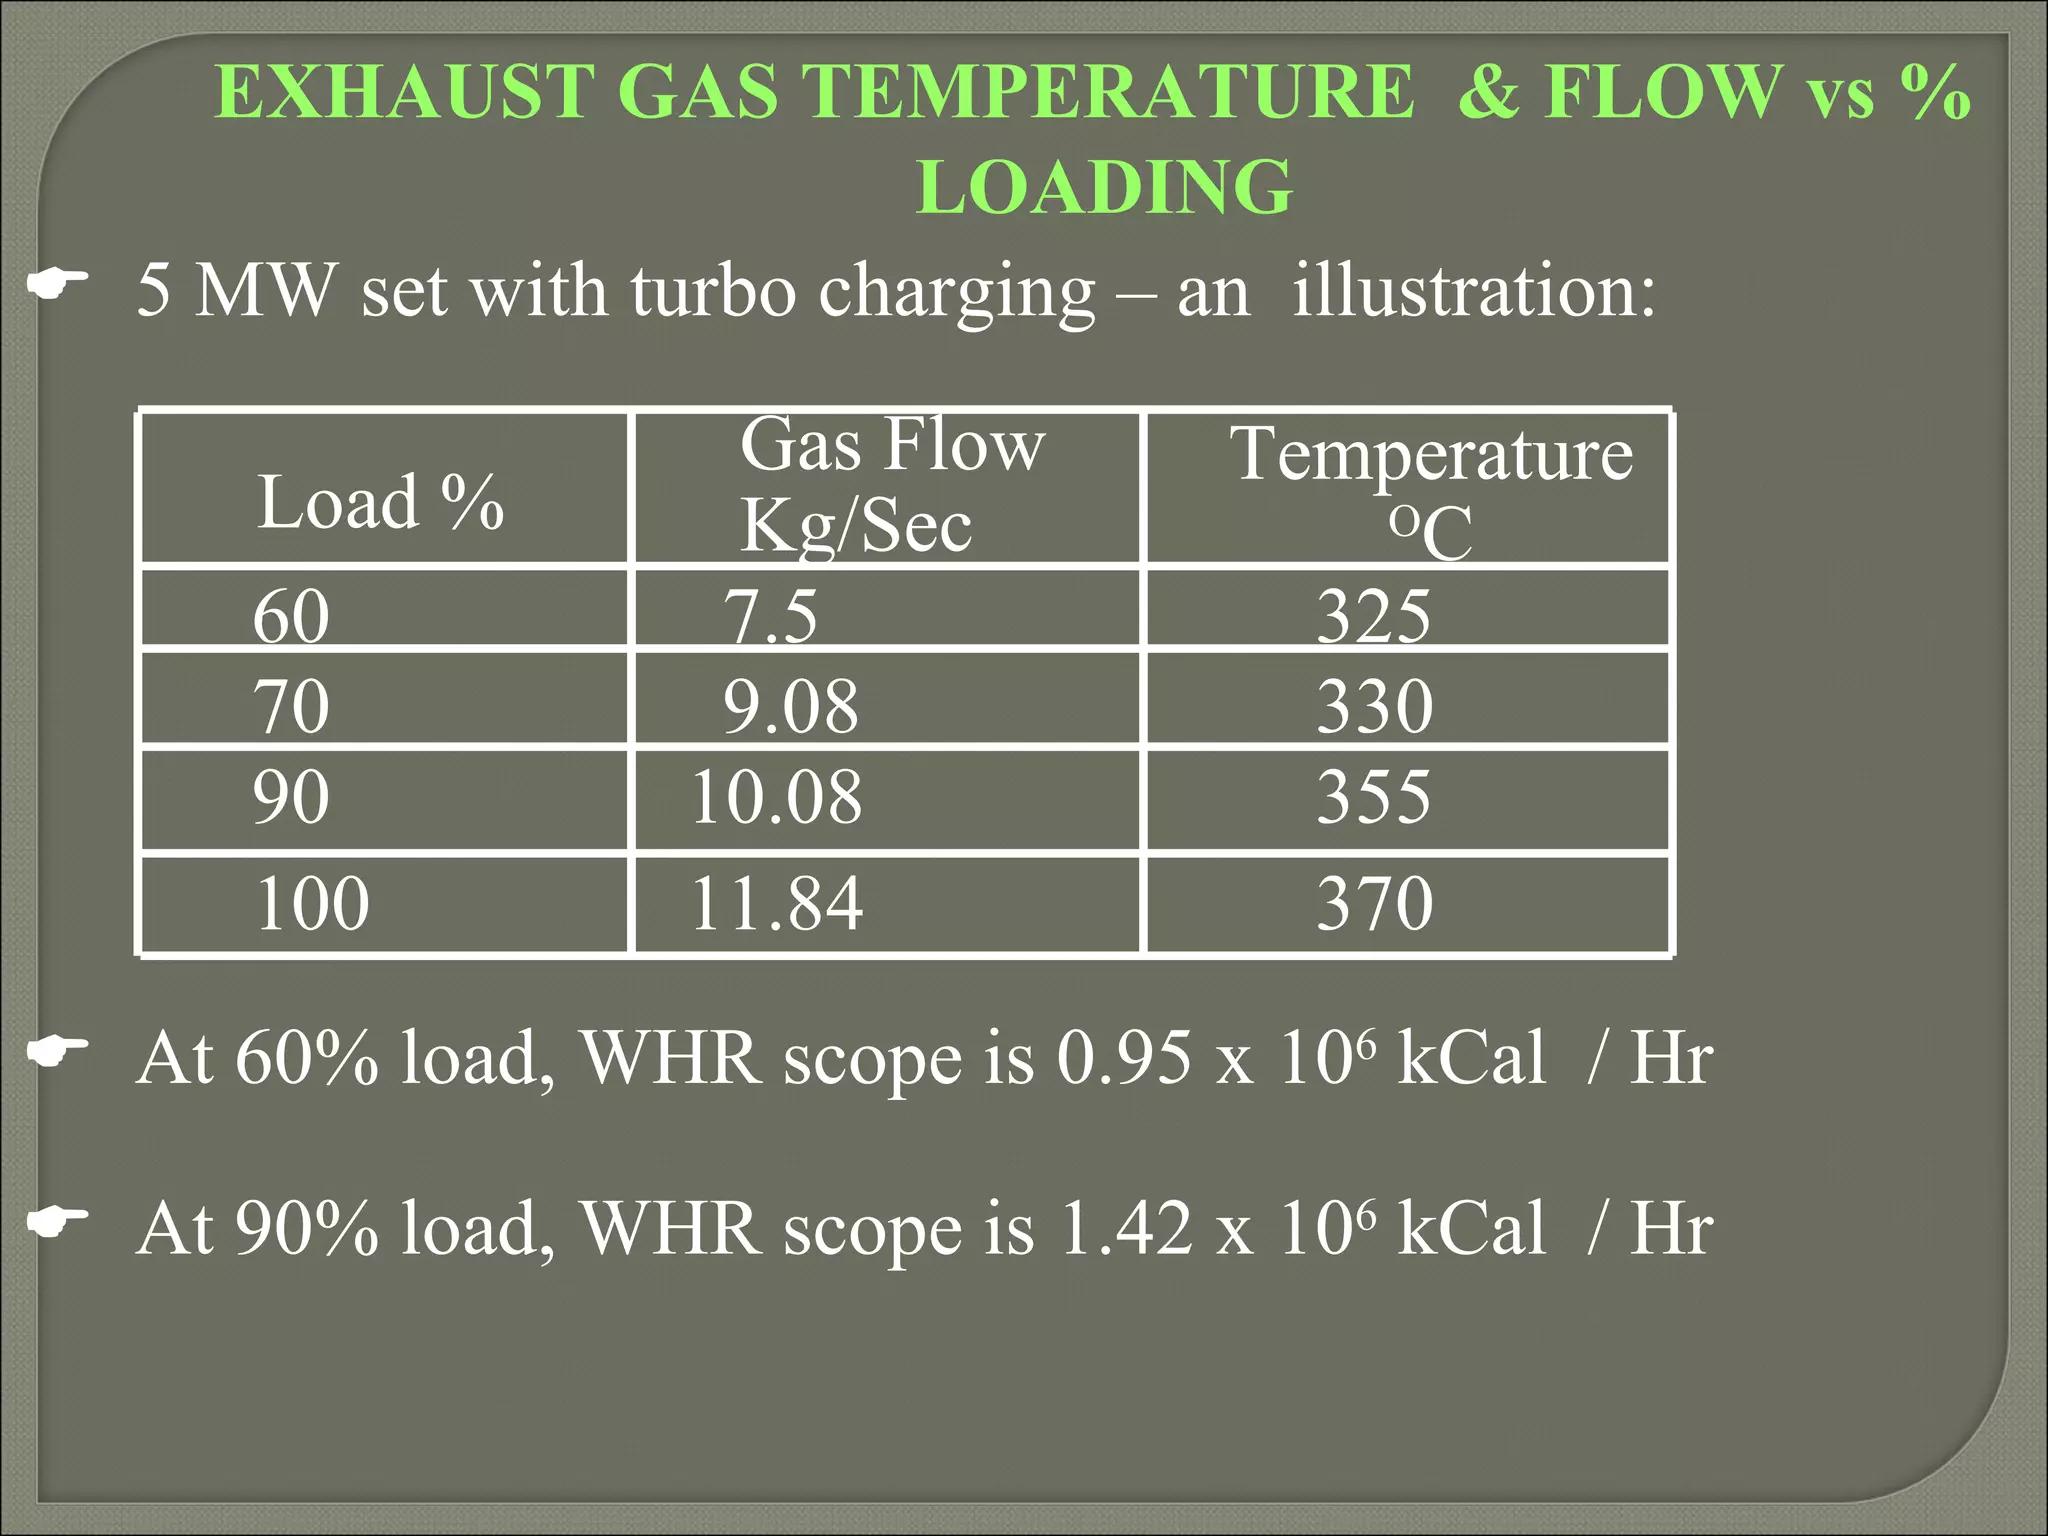
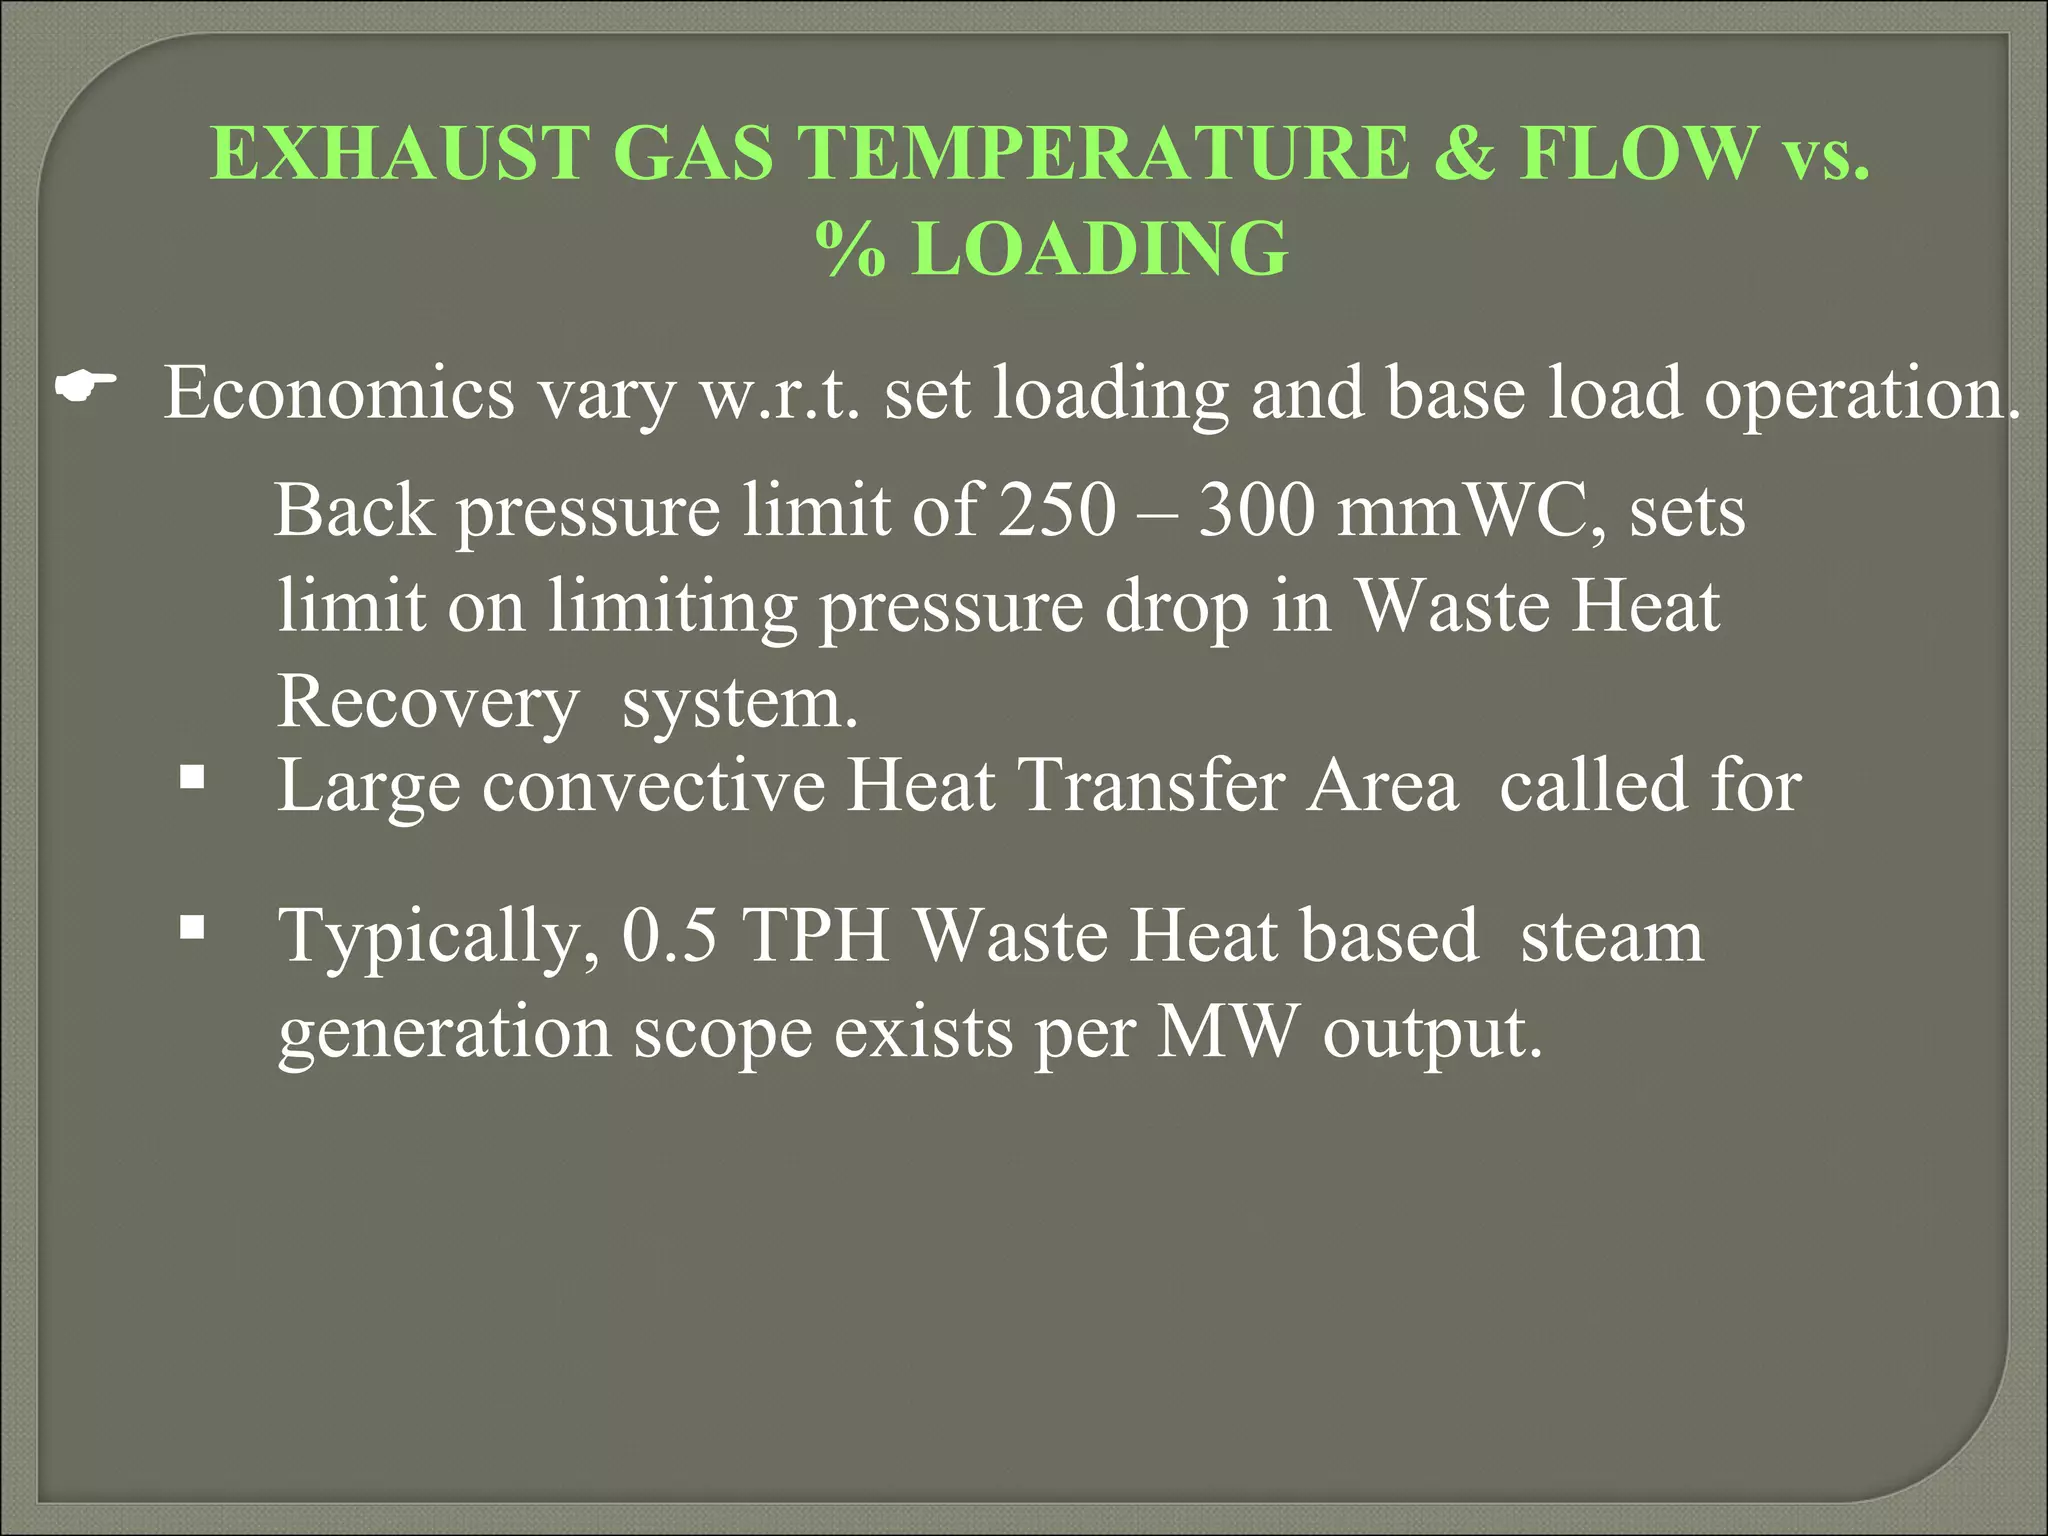
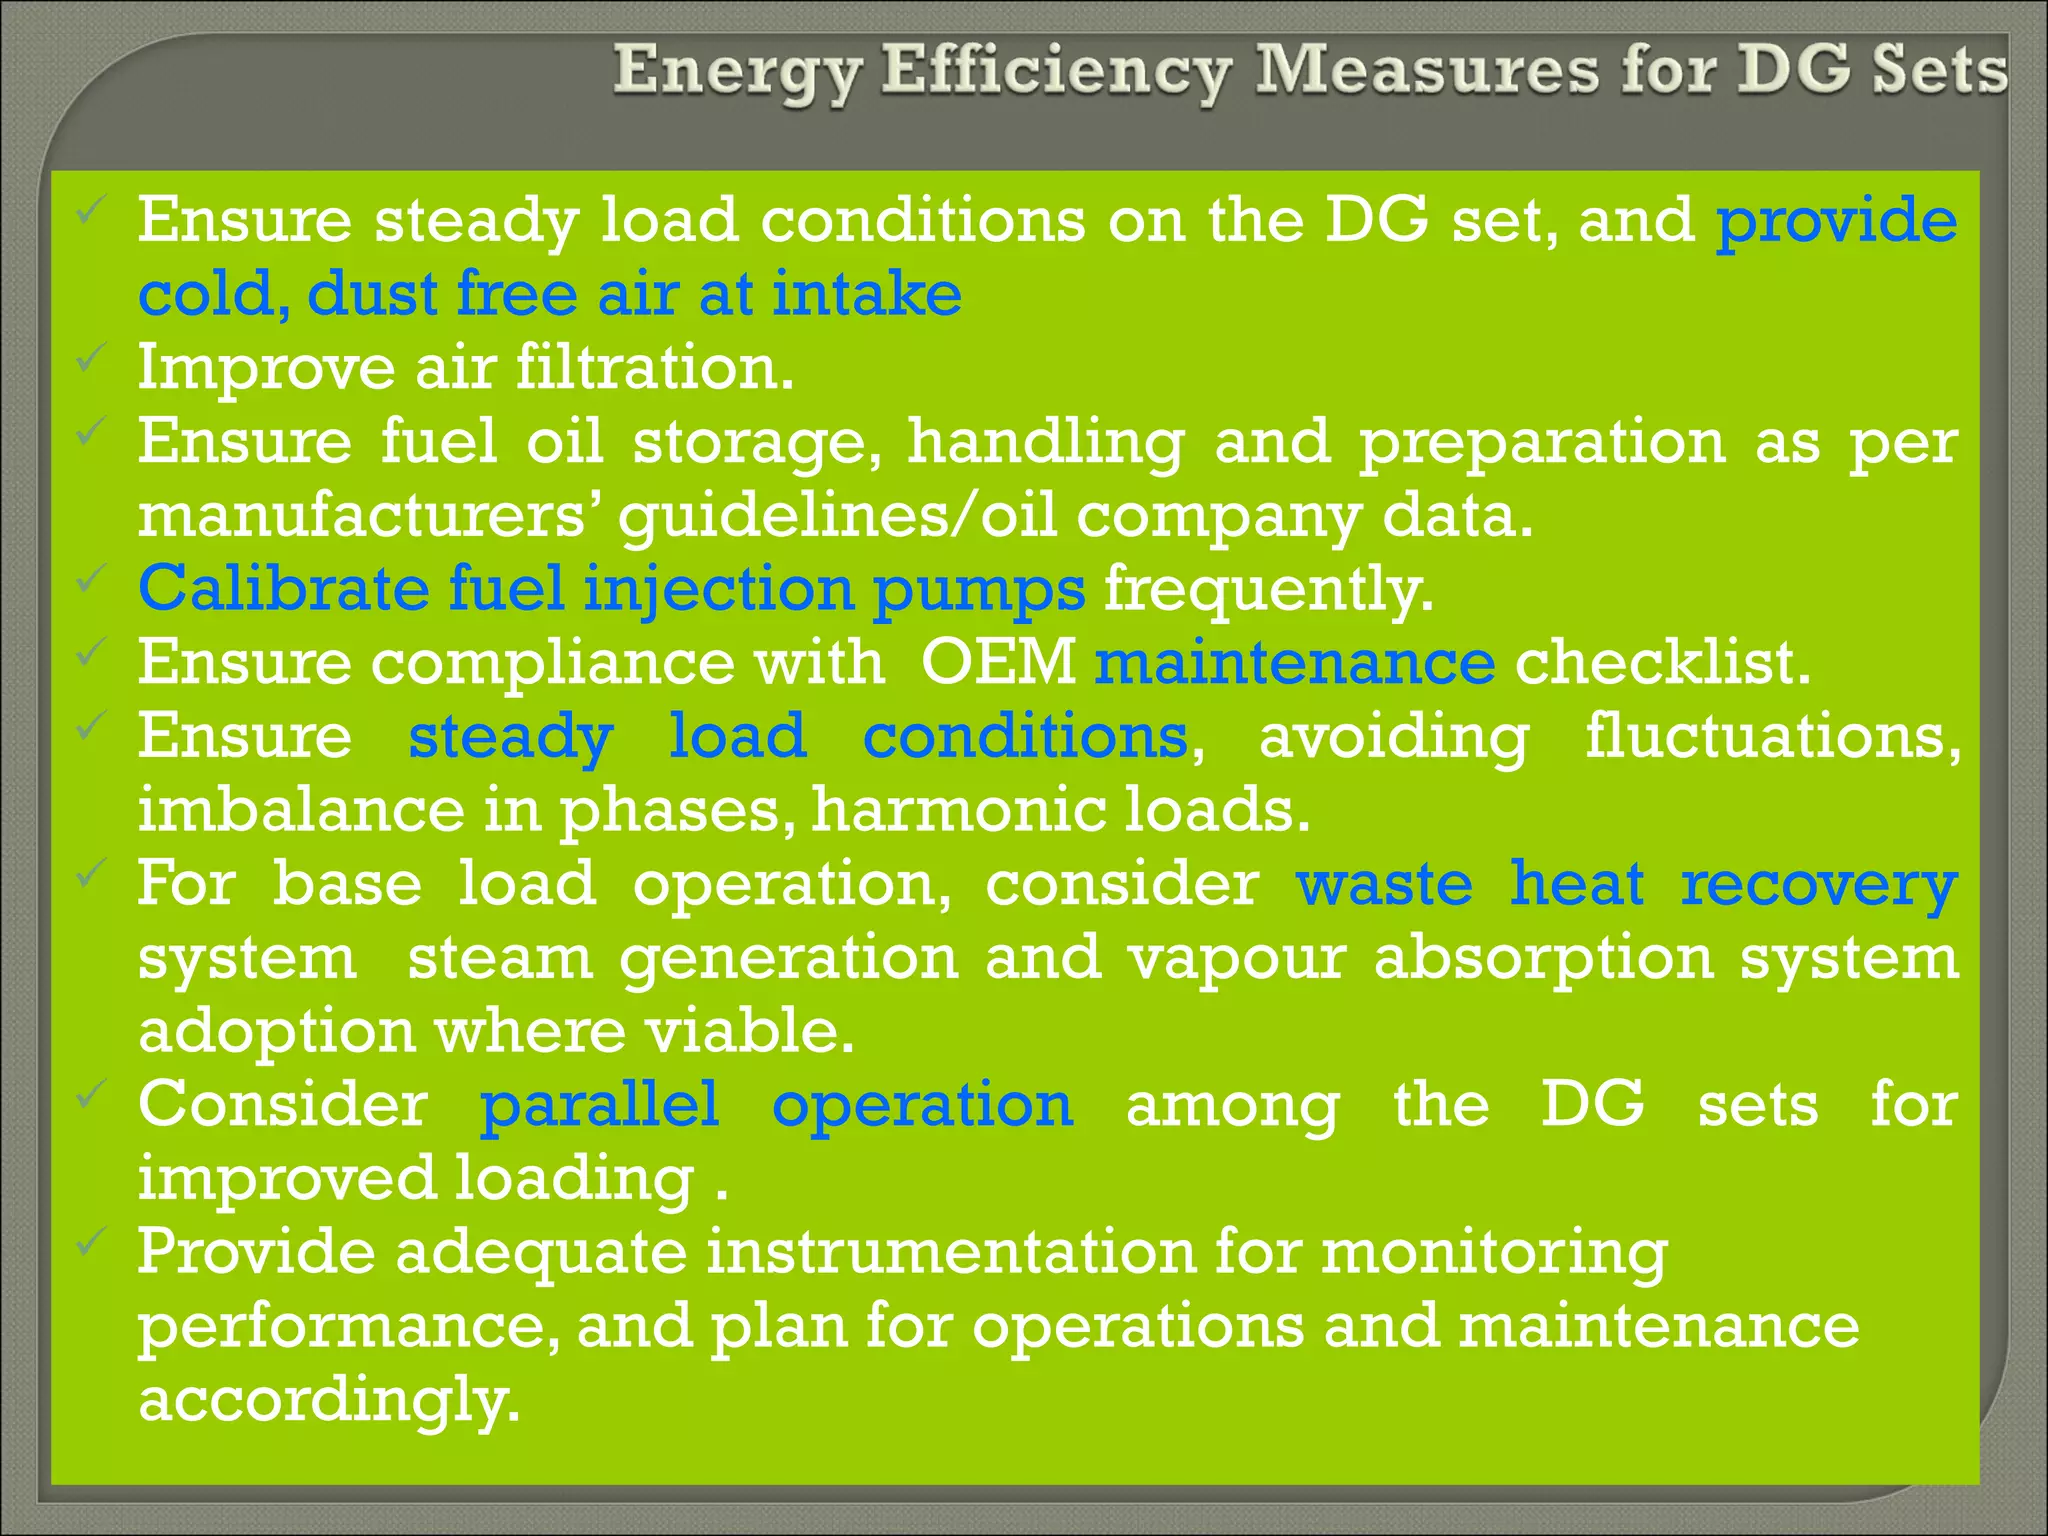
FOCUS AREAS

           FOR

ECONOMIC DG SET OPERATION

        D. PAWAN KUMAR
TYPICAL GRID POWER SCENARIO FEATURES

   Frequent power trippings
   Power cuts

   Low voltage problems
   Low frequency problems
   Captive power generation has become a necessity
ADVANTAGES
 In the context of utility sector short falls, it augurs well in the
   national perspective to encourage captive generation.


 Offsets large capital investment for utility side
   Capacity addition

 T & D loss component literally vanishes

 Power quality ensured (V, f)
TYPES OF CAPTIVE POWER OPTIONS AVAILABLE

 Purely power generation mode or:

 • Coal/oil based thermal cogen (boiler-turbine-generators)
       Fully
       condensingcondensing
       Extraction
       Back pressure
TYPES OF CAPTIVE POWER OPTIONS AVAILABLE
   Gas based / oil based GT route
   Combined cycle
    • Open cycle (GT only)
    • Closed cycle
    • GT, HRSG, ST
   DG Sets
    • Diesel based
    • Heavy fuel oil based
DG OPTION FROM THE COMMON USER STAND
      POINT – ATTRACTIVE FEATURES


    Low project payback period 2-3 years
    Low space requirements (Even a shed will do)
    Good conversion efficiency
    Easy fuel to handle
    Quality of Power ensured (V, f)
AMONGST CAPTIVE GENERATION OPTIONS

     Diesel generation attributes are:

      •     Efficiency 43 – 45%
      •     Very compact
      •     Investments lower
      •      Gestation period lowest (1 – 1.75 years)
      •     Low auxiliary power needs
DG OPTION FROM COMMON USERS STAND
        POINT – ATTRACTIVE FEATURES
    Low project implementation period (Less than 1year)
    Low space requirements
    Good conversion efficiency
    Easy fuel to handle
    Quality of power ensured (V, f)
    Investments lower than utility generation
    Waste Heat Recovery possible to reduce
     operational expenses
DG SYSTEM OPTIONS INCLUDE:
Individual user end installations

Co-operative ventures/centralized generation
for economy of scale

Group of industries generate by funds pooled
Companies promoted to set up and to
operate power stations
Power generated is distributed to participating
industries through utility distribution system
(wheeling route)
IMPACT OF INDUSTRIAL DIESEL POWER GENERATION

       Effect on foreign exchange reserves, energy security
     • Oil import bill constitutes good part of export
       earnings in many developing countries
     • Real cost of oil is much different from the
       administered cost

     • Highest operational efficiency of diesel
       power generation makes economic sense for
       industry & has a much larger impact in national
       economy
IMPACT OF INDUSTRIAL DIESEL POWER GENERATION

  A good share of DG Set population is old/second hand
  with low efficiencies & high SFC on account of factors
  like
 • Ageing
 • Inadequacies in maintenance
 • Low capacity utilisation
 • Fluctuating load characteristics
 • Inefficient operational practices
 • Derating effects
 • Wrong sizing and selection issues
IMPACT OF INDUSTRIAL DG POWER GENERATION

 Regular energy audit and performance monitoring would
   help to identify appropriate rectification measures
   retrofits & judicious replacement policies


 Compared to stand alone operation, parallel operations help
   to raise the operational economy of DG Sets on account
   of higher loading, with the options including:


   • Parallel operation of captive DG sets

   • Paralleling captive DG sets with grid
EXPERIENCES INDICATE 5 to 10%
FUEL SAVINGS POTENTIAL THROUGH
   INCORPORATION OF VARIOUS
           MEASURES
LOADING IMPROVEMENTS
 Under loading is the root cause for fuel guzzling in DG Sets

 KW readings efficacy often suspect
Engine capability (BHP based) limits to be referred to,
 to assess mechanical loading
Alternator capability (kVA based) limits to be referred to,
  to assess electrical loading
Check of exhaust temp, fuel rack setting,charge air pressure,
 turbocharger rpm helpful to assess engine loading
kWh, PF, monitoring helpful, to assess electrical loading

 Use of trivector type static energy meters desirable on DG Sets
LOADING IMPROVEMENTS

 Parallel operation among DG Sets & with grid can help

 Short run operations increase specific fuel consumption

Choice of loads on DG Sets & choice of DG Sets
 is also a key for improvement
ECONOMIC OPERATION OF DG SETS:
              – AREAS OF CONCERN

 Maintenance practices
   • Inadequacy and absence of records on maintenance. &
     operation
 Operation records inadequacy

 Inadequacies and absence of
   • Instrumentation
   • Monitoring

   A MIS template of desirable information follows:
DG Set Ref


kW kW
                    DG Set Capacity

                    Derated DG Set Capacity

                    Fuel Used
  %                 Avg. % Loading w.r.t. Derated Capacity


Lits/kWh Lits/kWh   Specific Fuel Oil Consumption


                    Specific Lube Oil Consumption

  O
         C          Charge Air In / Out Temperature
  O
         C          Exhaust Gas Temperature
    Kg/cm2 rpm


                    Turbocharger Pressure

                    Turbocharger rpm
MAINTENANCE COST RECORDS


 Break-up of cost also help in budgeting, maintenance planning


 An illustrative DG set Maintenance cost break-up follows:
DG Set Reference : ABC
                                         % Total Maintenance
S.No.      Failure Type                          Cost
 1.     Fuel Injection & Supply                   9.7
 2.     V/V, V/V System & Seats                   3.6
 3.     Cooling System & Water Leakage            0.4
 4.     Controls & Electricals                    0.0
 5.     Governers                                 0.0
 6.     Pistons                                   43
 7.     Lubrication System                        6.2
 8.     Bearings                                 17.9
 9.     Turbocharger                              1.3
 10.    Gears & Drives                            0.0
 11.    Miscellaneous                             7.2
                                                  100
CONDITION MONITORING RECORDS
 While OEM Guidelines are often conservative, condition
    monitoring is a powerful technique for cost control

    • Typical examples
   Lub Oil Tests
    • Color / visual observations
    • Kin. Viscosity at 40OC/100OC
    • Viscosity index
    • Flash point (OC)
    • Total base number
    • Cracking test
VIBRATION ANALYSIS
 Desirable for bearings, Gears, Turbochargers, Pumps
 Illustrative observations on DG Sets in a plant
                                        Displacement   Velocity
    Location         Orientation          Range (µ)   Range (µ)
   Turbo             Horizontal            60 – 130     8 – 13
   Charger           Vertical              68 – 140     4 – 8.4
   Suction           Axial                 90 – 180   7.2 – 16

    Turbo           Horizontal          80 – 130          8 – 8.4
    Charger         Vertical            58 – 150        4.6 – 14
    Discharge       Axial              100 – 190        7.8 – 16

    Alternator      Horizontal          18 – 40           2–4
    Bearing         Vertical            25 – 50         2.8 – 6.4
                    Axial               28 – 60         3.2 – 14

 Such observations can help improve preventive maintenance function
  and availability of DG Sets
DESIRABLE ON-LINE PARAMETERS TO TRACK:

 Suction air temperature
 Charge air pressure
 Charge air temperature (before and after Cooler)
 Turbocharger (T.C) RPM
 Gas Temperature at cylinder exhaust
 Gas temperature, at T.C. In and Out
 Fuel rack / rocker arm setting
 Alternator V, A, PF, kW, & Hz.
 Fuel flow indicator
 Ambient air DBT / WBT indicator
 Conductivity meter for CW system
TYPICAL FAULTS TO LOOK OUT FOR:
 Based on OEM Guidelines & as run observations, diagnosis of
   faults is called for:
    Typical concern areas include:
        • Choked fuel valves
        • Leaky piston rings
        • Leaky exhaust valves
        • After burning
        • Early firing
 Record of overhauls
         Historical data before / after each overhaul helps to
        • Check efficacy of overhaul carried out
        • Establishing in-situ parameter limits
WASTE HEAT RECOVERY IN DG SETS

 Close to 35% of energy exhausted through stack
 Exhaust temperature 350OC to 500OC
 Scope for waste heat recovery
 Indicative recovery potential in kCal per hour would be:

    m x 0.25 x (tg – 180) where m, is gas quantity in Kg
     / Hr ( typically 8 Kg / kWh ) and tg is exhaust gas
     temperature,180 being the safe exit gas temperature
     limit, after, heat recovery.
WASTE HEAT RECOVERY (WHR) IN DG SETS

 Factors affecting WHR

      Set loading, temperature of gases
      Hours of continuous operation
      Back pressure of set
      End use options available for Steam / waste heat


 Refrigeration capacity feasible through vapor absorption system option:

      About 100 TR per MW output, based on 500KG waste heat steam
       /MW and 5KG/TR steam required for a double effect VAR system.
       Water Lithium Bromide VAR schemes for 8OC chilled water available
EXHAUST GAS TEMPERATURE & FLOW vs %
                         LOADING
 5 MW set with turbo charging – an illustration:
                   Gas Flow       Temperature
      Load %       Kg/Sec             O
                                        C
      60           7.5              325
      70           9.08             330
      90          10.08             355
      100         11.84             370
 At 60% load, WHR scope is 0.95 x 10⁶ kCal / Hr

 At 90% load, WHR scope is 1.42 x 10⁶ kCal / Hr
EXHAUST GAS TEMPERATURE & FLOW vs.
                % LOADING
 Economics vary w.r.t. set loading and base load operation.
     Back pressure limit of 250 – 300 mmWC, sets
     limit on limiting pressure drop in Waste Heat
     Recovery system.
   Large convective Heat Transfer Area called for
    Typically, 0.5 TPH Waste Heat based steam
     generation scope exists per MW output.
EMERGING AREAS OF INTEREST

 Suction air cooling schemes for increasing capacity

 Fuel additives / treatment systems for better efficiency

 High efficiency turbochargers

 Improved Noise control
  systems
 Harmonics filtration

 Tri-generation adoption
   Ensure steady load conditions on the DG set, and provide
    cold, dust free air at intake
   Improve air filtration.
   Ensure fuel oil storage, handling and preparation as per
    manufacturers’ guidelines/oil company data.
   Calibrate fuel injection pumps frequently.
   Ensure compliance with OEM maintenance checklist.
   Ensure steady load conditions, avoiding fluctuations,
    imbalance in phases, harmonic loads.
   For base load operation, consider waste heat recovery
    system steam generation and vapour absorption system
    adoption where viable.
   Consider parallel operation among the DG sets for
    improved loading .
   Provide adequate instrumentation for monitoring
    performance, and plan for operations and maintenance
    accordingly.
THANK YOU

Focus areas in economic operation of DG sets

  • 1.
    FOCUS AREAS FOR ECONOMIC DG SET OPERATION D. PAWAN KUMAR
  • 2.
    TYPICAL GRID POWERSCENARIO FEATURES  Frequent power trippings  Power cuts  Low voltage problems  Low frequency problems  Captive power generation has become a necessity
  • 3.
    ADVANTAGES  In thecontext of utility sector short falls, it augurs well in the national perspective to encourage captive generation.  Offsets large capital investment for utility side Capacity addition  T & D loss component literally vanishes  Power quality ensured (V, f)
  • 4.
    TYPES OF CAPTIVEPOWER OPTIONS AVAILABLE  Purely power generation mode or: • Coal/oil based thermal cogen (boiler-turbine-generators) Fully condensingcondensing Extraction Back pressure
  • 5.
    TYPES OF CAPTIVEPOWER OPTIONS AVAILABLE  Gas based / oil based GT route  Combined cycle • Open cycle (GT only) • Closed cycle • GT, HRSG, ST  DG Sets • Diesel based • Heavy fuel oil based
  • 6.
    DG OPTION FROMTHE COMMON USER STAND POINT – ATTRACTIVE FEATURES  Low project payback period 2-3 years  Low space requirements (Even a shed will do)  Good conversion efficiency  Easy fuel to handle  Quality of Power ensured (V, f)
  • 7.
    AMONGST CAPTIVE GENERATIONOPTIONS  Diesel generation attributes are: • Efficiency 43 – 45% • Very compact • Investments lower • Gestation period lowest (1 – 1.75 years) • Low auxiliary power needs
  • 8.
    DG OPTION FROMCOMMON USERS STAND POINT – ATTRACTIVE FEATURES  Low project implementation period (Less than 1year)  Low space requirements  Good conversion efficiency  Easy fuel to handle  Quality of power ensured (V, f)  Investments lower than utility generation  Waste Heat Recovery possible to reduce operational expenses
  • 9.
    DG SYSTEM OPTIONSINCLUDE: Individual user end installations Co-operative ventures/centralized generation for economy of scale Group of industries generate by funds pooled Companies promoted to set up and to operate power stations Power generated is distributed to participating industries through utility distribution system (wheeling route)
  • 10.
    IMPACT OF INDUSTRIALDIESEL POWER GENERATION Effect on foreign exchange reserves, energy security • Oil import bill constitutes good part of export earnings in many developing countries • Real cost of oil is much different from the administered cost • Highest operational efficiency of diesel power generation makes economic sense for industry & has a much larger impact in national economy
  • 11.
    IMPACT OF INDUSTRIALDIESEL POWER GENERATION A good share of DG Set population is old/second hand with low efficiencies & high SFC on account of factors like • Ageing • Inadequacies in maintenance • Low capacity utilisation • Fluctuating load characteristics • Inefficient operational practices • Derating effects • Wrong sizing and selection issues
  • 12.
    IMPACT OF INDUSTRIALDG POWER GENERATION  Regular energy audit and performance monitoring would help to identify appropriate rectification measures retrofits & judicious replacement policies  Compared to stand alone operation, parallel operations help to raise the operational economy of DG Sets on account of higher loading, with the options including: • Parallel operation of captive DG sets • Paralleling captive DG sets with grid
  • 13.
    EXPERIENCES INDICATE 5to 10% FUEL SAVINGS POTENTIAL THROUGH INCORPORATION OF VARIOUS MEASURES
  • 14.
    LOADING IMPROVEMENTS  Underloading is the root cause for fuel guzzling in DG Sets  KW readings efficacy often suspect Engine capability (BHP based) limits to be referred to, to assess mechanical loading Alternator capability (kVA based) limits to be referred to, to assess electrical loading Check of exhaust temp, fuel rack setting,charge air pressure, turbocharger rpm helpful to assess engine loading kWh, PF, monitoring helpful, to assess electrical loading  Use of trivector type static energy meters desirable on DG Sets
  • 15.
    LOADING IMPROVEMENTS  Paralleloperation among DG Sets & with grid can help  Short run operations increase specific fuel consumption Choice of loads on DG Sets & choice of DG Sets is also a key for improvement
  • 16.
    ECONOMIC OPERATION OFDG SETS: – AREAS OF CONCERN  Maintenance practices • Inadequacy and absence of records on maintenance. & operation  Operation records inadequacy  Inadequacies and absence of • Instrumentation • Monitoring A MIS template of desirable information follows:
  • 17.
    DG Set Ref kWkW DG Set Capacity Derated DG Set Capacity Fuel Used % Avg. % Loading w.r.t. Derated Capacity Lits/kWh Lits/kWh Specific Fuel Oil Consumption Specific Lube Oil Consumption O C Charge Air In / Out Temperature O C Exhaust Gas Temperature Kg/cm2 rpm Turbocharger Pressure Turbocharger rpm
  • 18.
    MAINTENANCE COST RECORDS Break-up of cost also help in budgeting, maintenance planning  An illustrative DG set Maintenance cost break-up follows:
  • 19.
    DG Set Reference: ABC % Total Maintenance S.No. Failure Type Cost 1. Fuel Injection & Supply 9.7 2. V/V, V/V System & Seats 3.6 3. Cooling System & Water Leakage 0.4 4. Controls & Electricals 0.0 5. Governers 0.0 6. Pistons 43 7. Lubrication System 6.2 8. Bearings 17.9 9. Turbocharger 1.3 10. Gears & Drives 0.0 11. Miscellaneous 7.2 100
  • 20.
    CONDITION MONITORING RECORDS While OEM Guidelines are often conservative, condition monitoring is a powerful technique for cost control • Typical examples  Lub Oil Tests • Color / visual observations • Kin. Viscosity at 40OC/100OC • Viscosity index • Flash point (OC) • Total base number • Cracking test
  • 21.
    VIBRATION ANALYSIS  Desirablefor bearings, Gears, Turbochargers, Pumps  Illustrative observations on DG Sets in a plant Displacement Velocity Location Orientation Range (µ) Range (µ) Turbo Horizontal 60 – 130 8 – 13 Charger Vertical 68 – 140 4 – 8.4 Suction Axial 90 – 180 7.2 – 16 Turbo Horizontal 80 – 130 8 – 8.4 Charger Vertical 58 – 150 4.6 – 14 Discharge Axial 100 – 190 7.8 – 16 Alternator Horizontal 18 – 40 2–4 Bearing Vertical 25 – 50 2.8 – 6.4 Axial 28 – 60 3.2 – 14  Such observations can help improve preventive maintenance function and availability of DG Sets
  • 22.
    DESIRABLE ON-LINE PARAMETERSTO TRACK:  Suction air temperature  Charge air pressure  Charge air temperature (before and after Cooler)  Turbocharger (T.C) RPM  Gas Temperature at cylinder exhaust  Gas temperature, at T.C. In and Out  Fuel rack / rocker arm setting  Alternator V, A, PF, kW, & Hz.  Fuel flow indicator  Ambient air DBT / WBT indicator  Conductivity meter for CW system
  • 23.
    TYPICAL FAULTS TOLOOK OUT FOR:  Based on OEM Guidelines & as run observations, diagnosis of faults is called for:  Typical concern areas include: • Choked fuel valves • Leaky piston rings • Leaky exhaust valves • After burning • Early firing  Record of overhauls  Historical data before / after each overhaul helps to • Check efficacy of overhaul carried out • Establishing in-situ parameter limits
  • 24.
    WASTE HEAT RECOVERYIN DG SETS  Close to 35% of energy exhausted through stack  Exhaust temperature 350OC to 500OC  Scope for waste heat recovery  Indicative recovery potential in kCal per hour would be:  m x 0.25 x (tg – 180) where m, is gas quantity in Kg / Hr ( typically 8 Kg / kWh ) and tg is exhaust gas temperature,180 being the safe exit gas temperature limit, after, heat recovery.
  • 25.
    WASTE HEAT RECOVERY(WHR) IN DG SETS  Factors affecting WHR  Set loading, temperature of gases  Hours of continuous operation  Back pressure of set  End use options available for Steam / waste heat  Refrigeration capacity feasible through vapor absorption system option:  About 100 TR per MW output, based on 500KG waste heat steam /MW and 5KG/TR steam required for a double effect VAR system. Water Lithium Bromide VAR schemes for 8OC chilled water available
  • 26.
    EXHAUST GAS TEMPERATURE& FLOW vs % LOADING  5 MW set with turbo charging – an illustration: Gas Flow Temperature Load % Kg/Sec O C 60 7.5 325 70 9.08 330 90 10.08 355 100 11.84 370  At 60% load, WHR scope is 0.95 x 10⁶ kCal / Hr  At 90% load, WHR scope is 1.42 x 10⁶ kCal / Hr
  • 27.
    EXHAUST GAS TEMPERATURE& FLOW vs. % LOADING  Economics vary w.r.t. set loading and base load operation. Back pressure limit of 250 – 300 mmWC, sets limit on limiting pressure drop in Waste Heat Recovery system.  Large convective Heat Transfer Area called for  Typically, 0.5 TPH Waste Heat based steam generation scope exists per MW output.
  • 28.
    EMERGING AREAS OFINTEREST  Suction air cooling schemes for increasing capacity  Fuel additives / treatment systems for better efficiency  High efficiency turbochargers  Improved Noise control systems  Harmonics filtration  Tri-generation adoption
  • 29.
    Ensure steady load conditions on the DG set, and provide cold, dust free air at intake  Improve air filtration.  Ensure fuel oil storage, handling and preparation as per manufacturers’ guidelines/oil company data.  Calibrate fuel injection pumps frequently.  Ensure compliance with OEM maintenance checklist.  Ensure steady load conditions, avoiding fluctuations, imbalance in phases, harmonic loads.  For base load operation, consider waste heat recovery system steam generation and vapour absorption system adoption where viable.  Consider parallel operation among the DG sets for improved loading .  Provide adequate instrumentation for monitoring performance, and plan for operations and maintenance accordingly.
  • 30.