Download to read offline

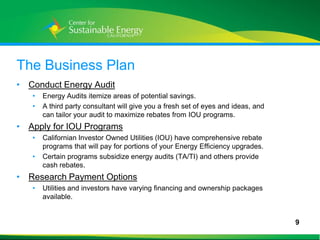


The document outlines strategies for creating a sustainable energy future through energy efficiency, renewable energy, and climate change initiatives. It provides details on various California investor-owned utility programs, financial incentives for energy audits, and retro-commissioning processes for existing buildings. Additionally, the document emphasizes the importance of distributed generation, energy savings bids, and benchmarking as means to achieve cost savings and environmental goals.


