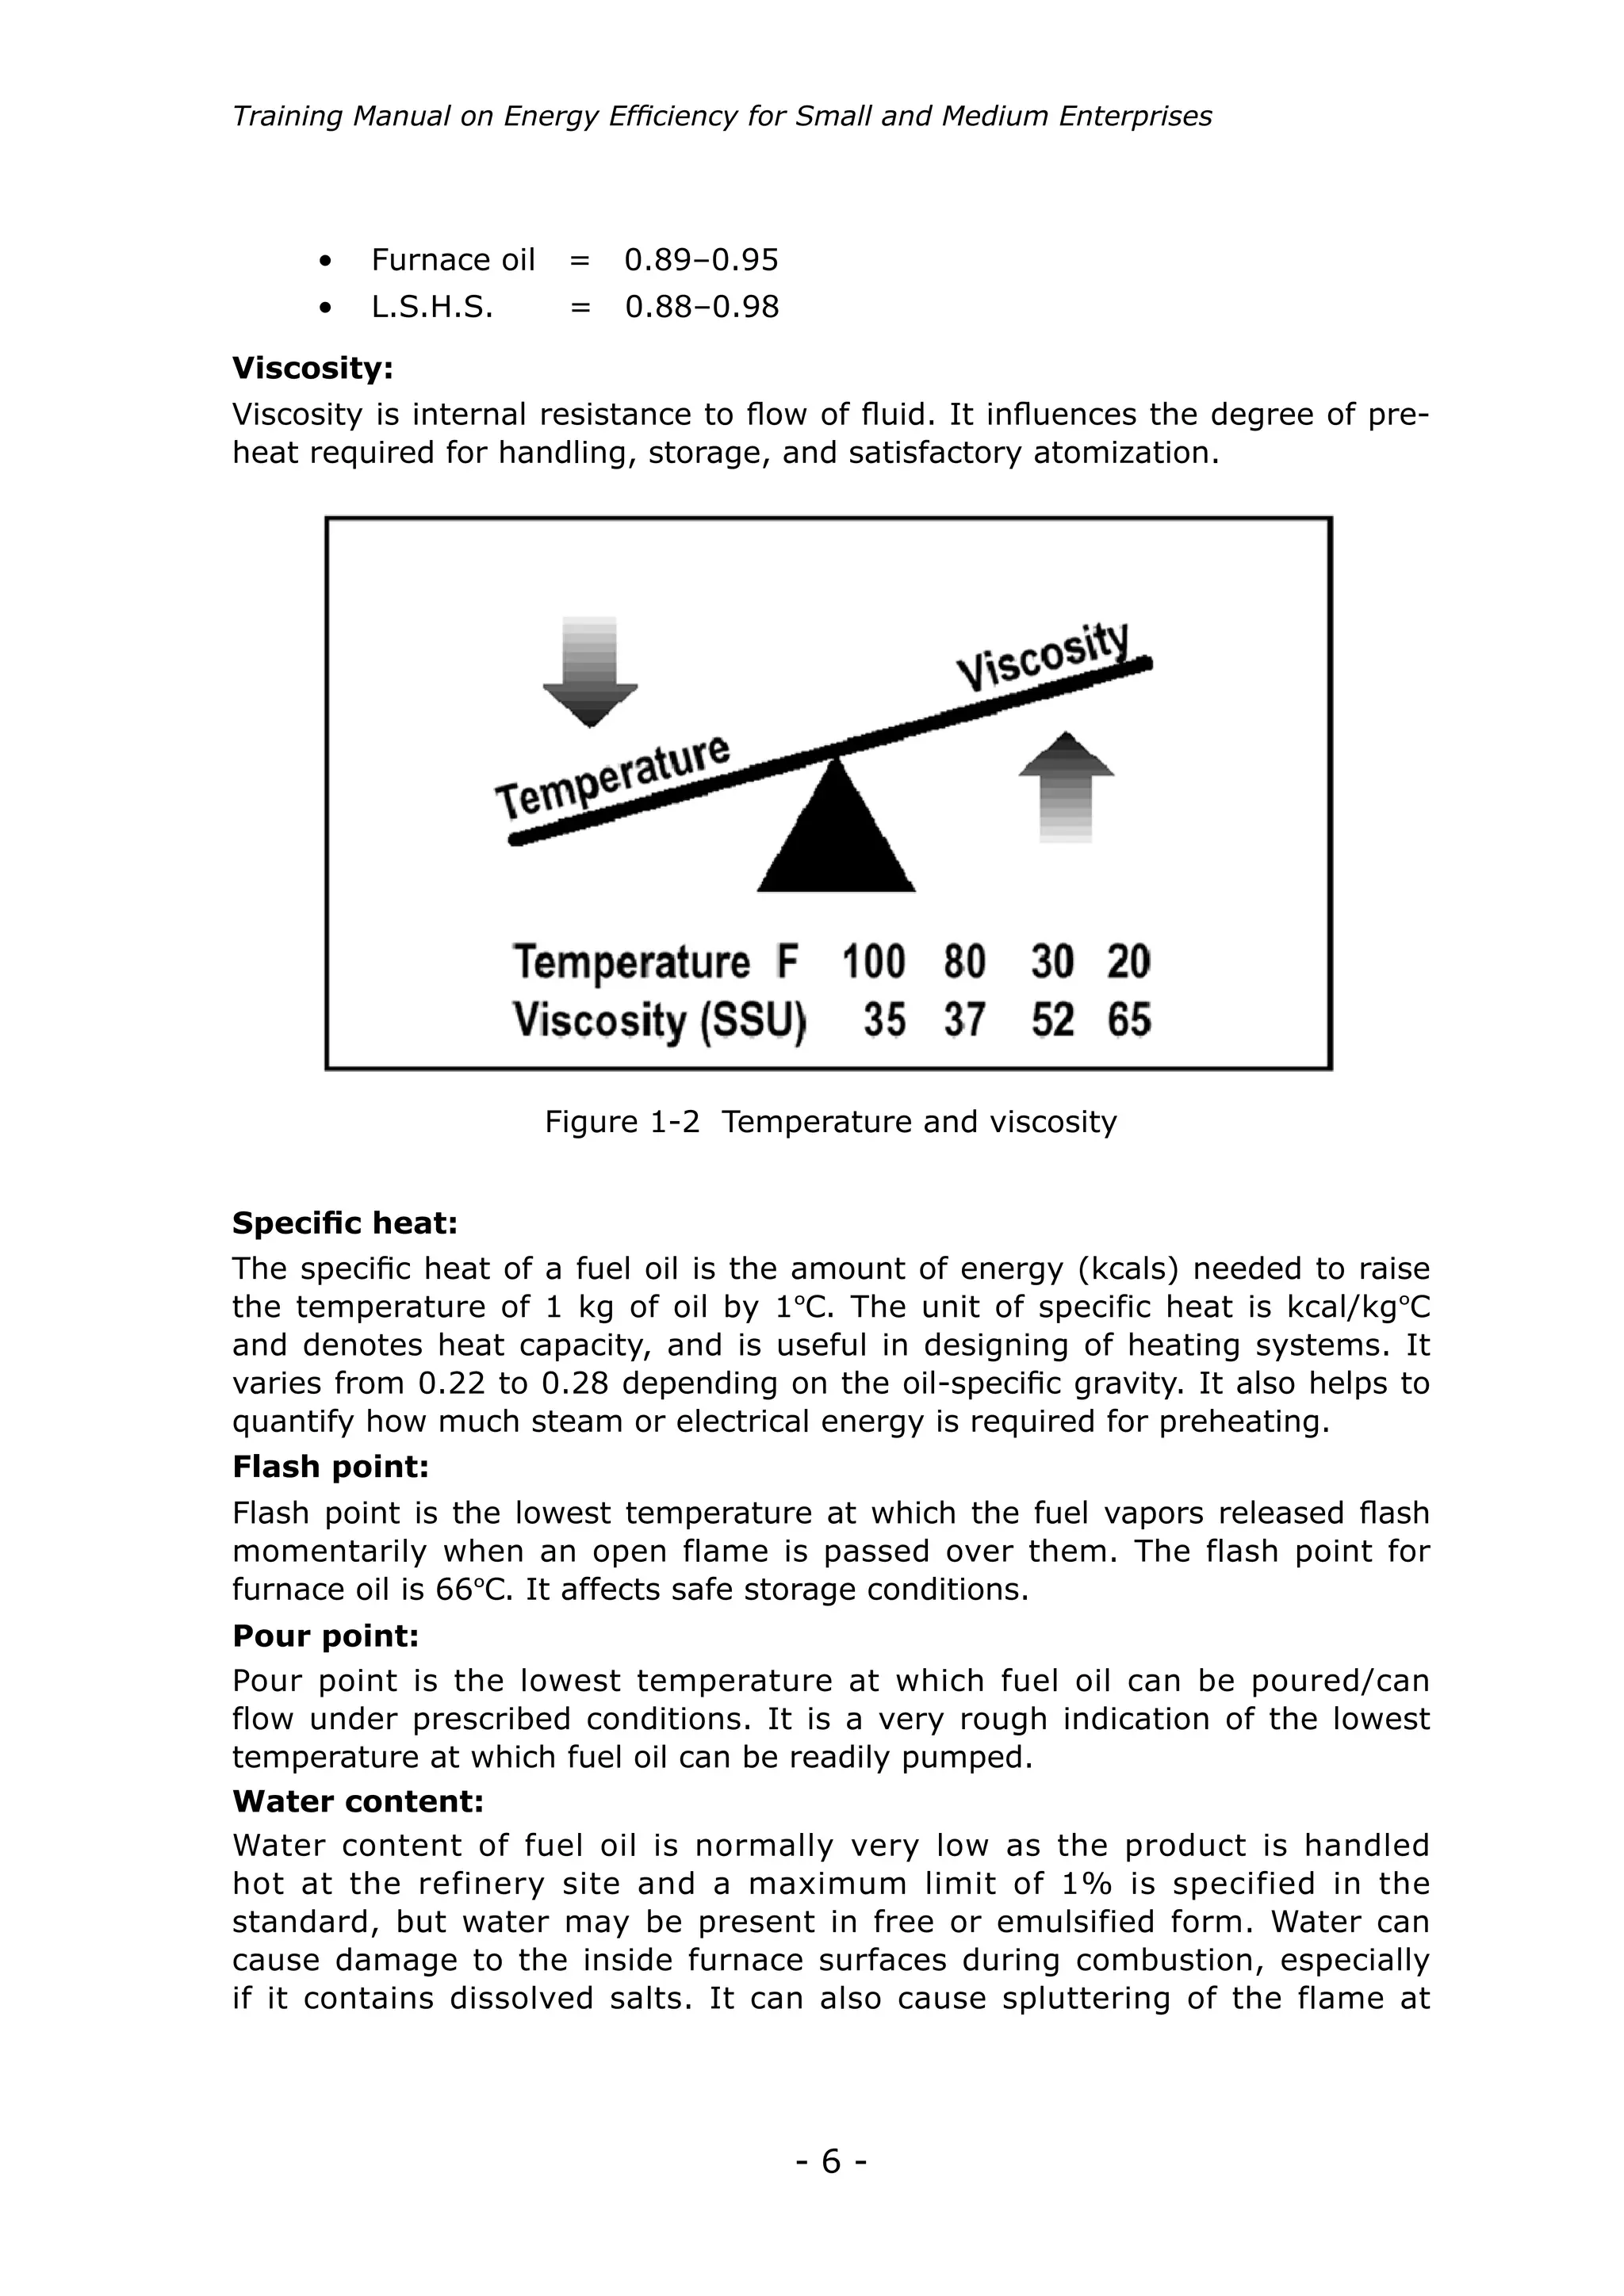
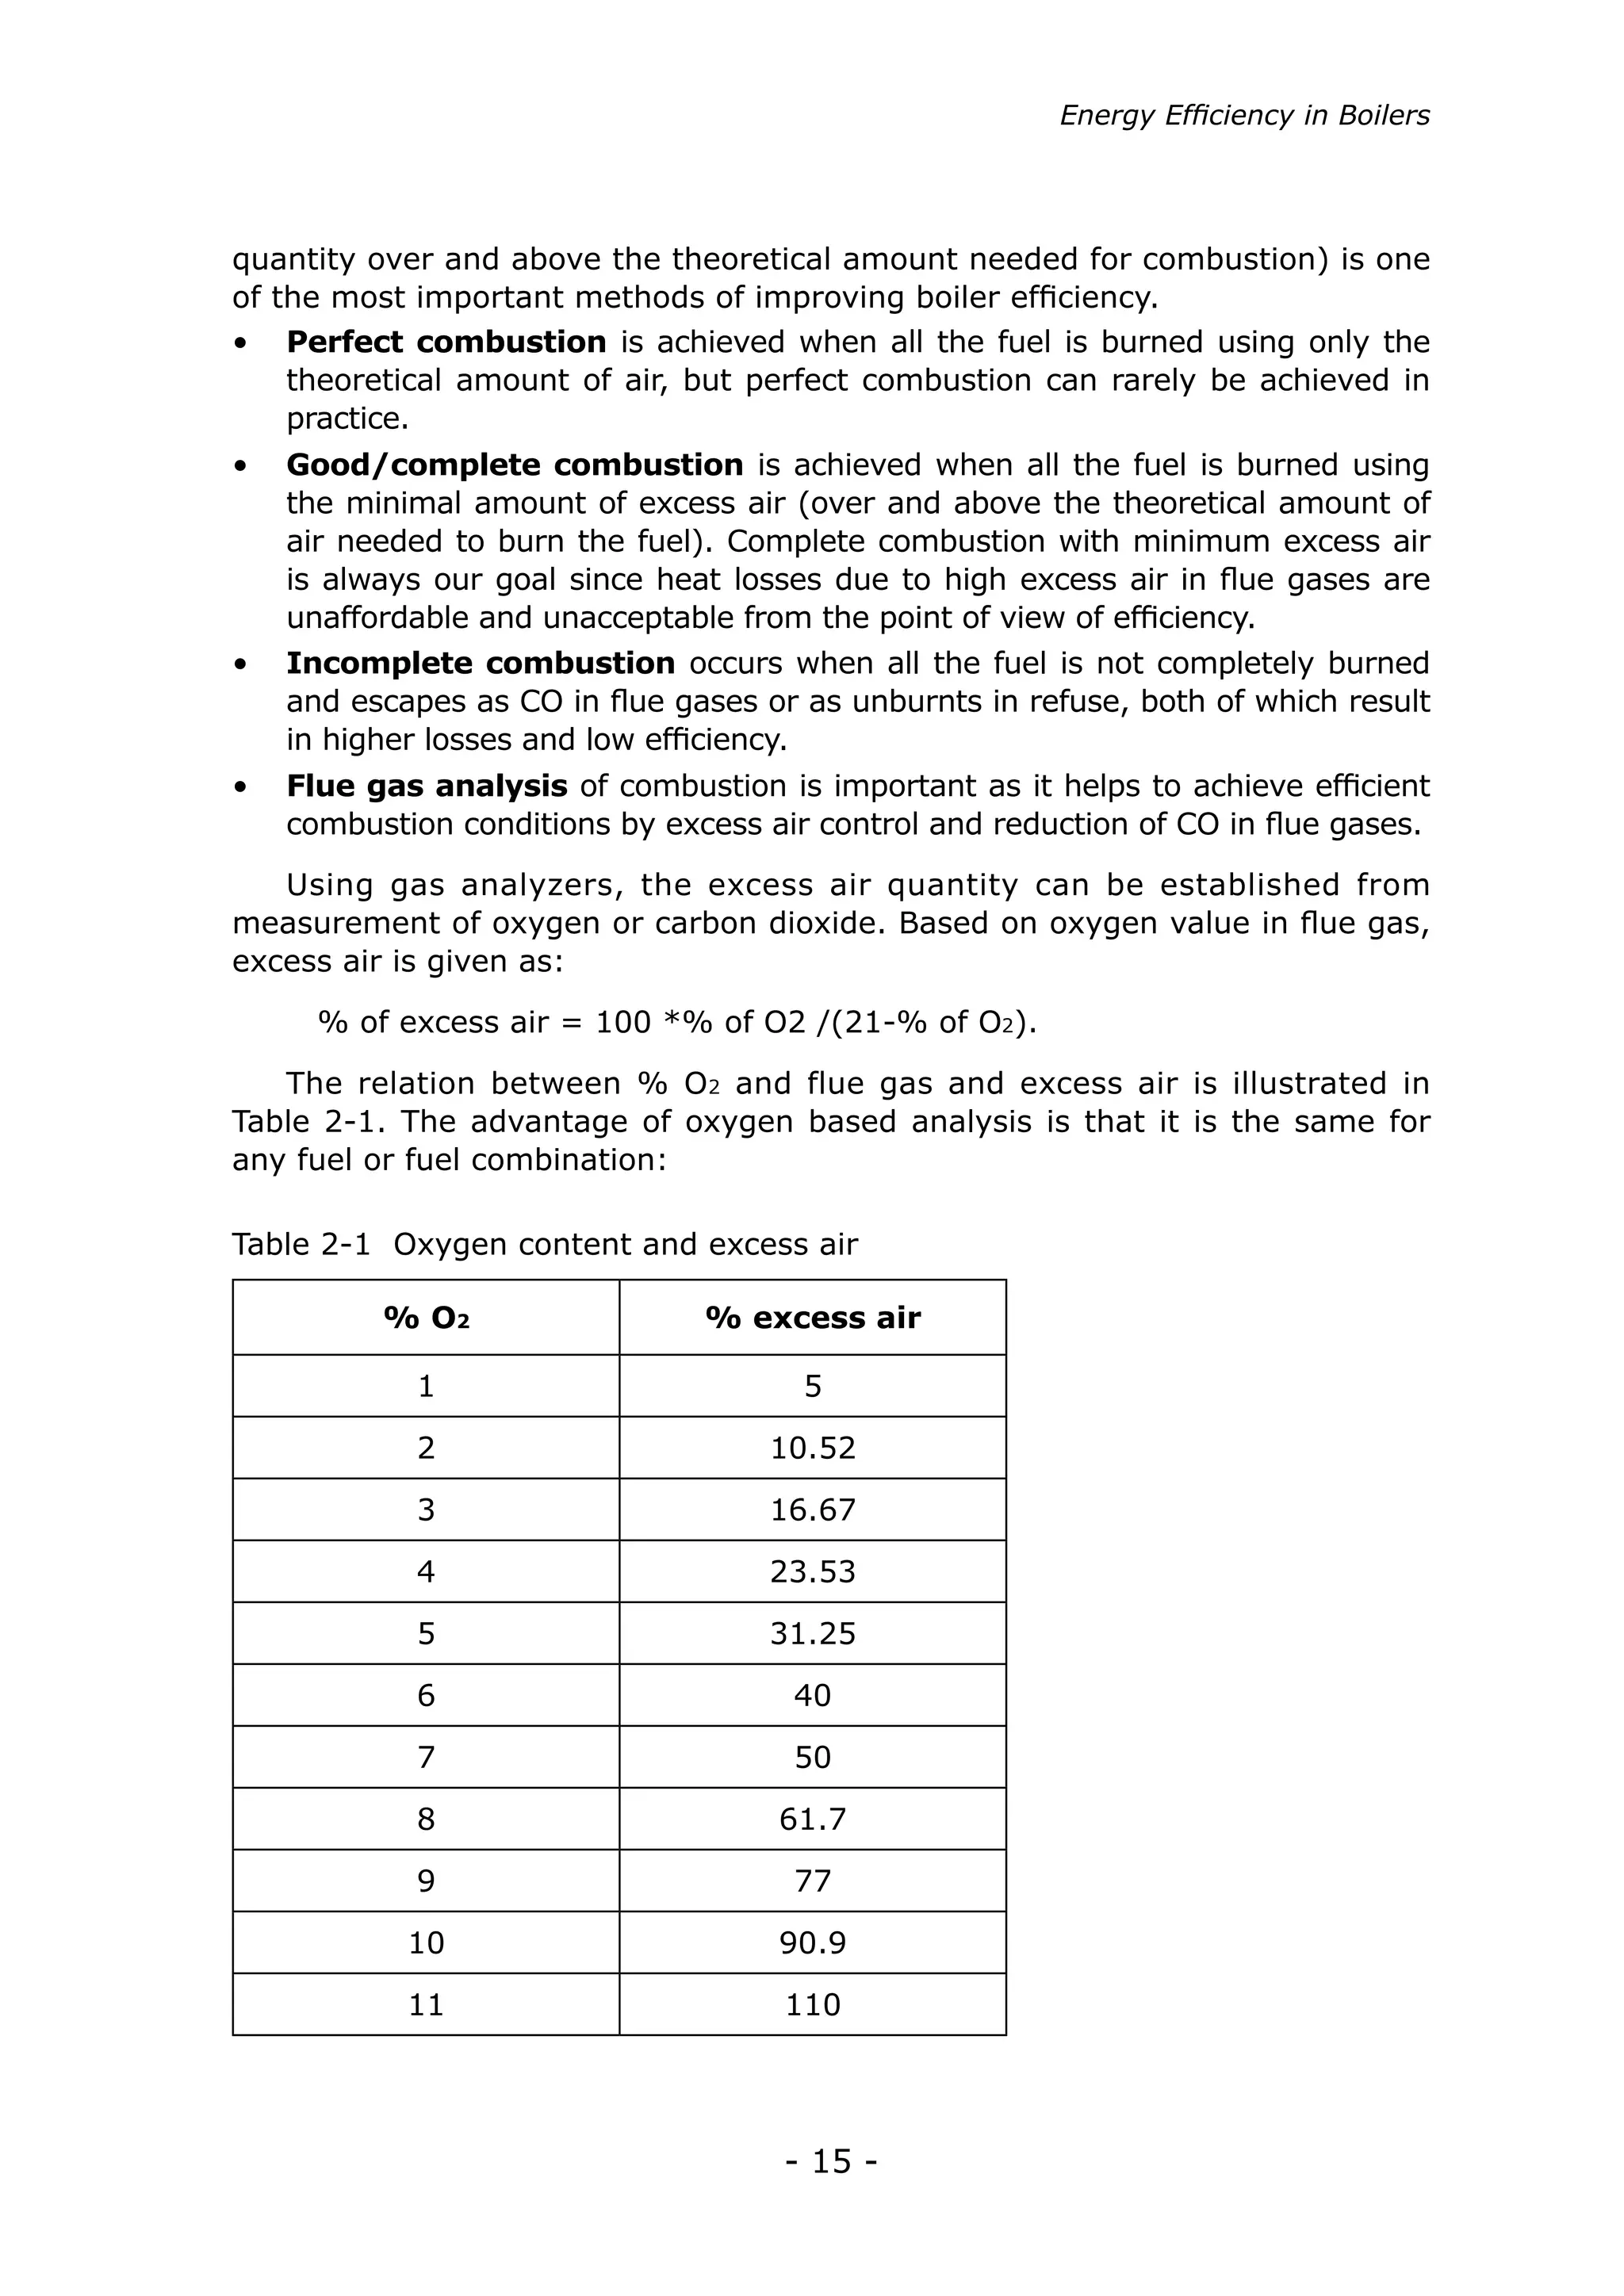
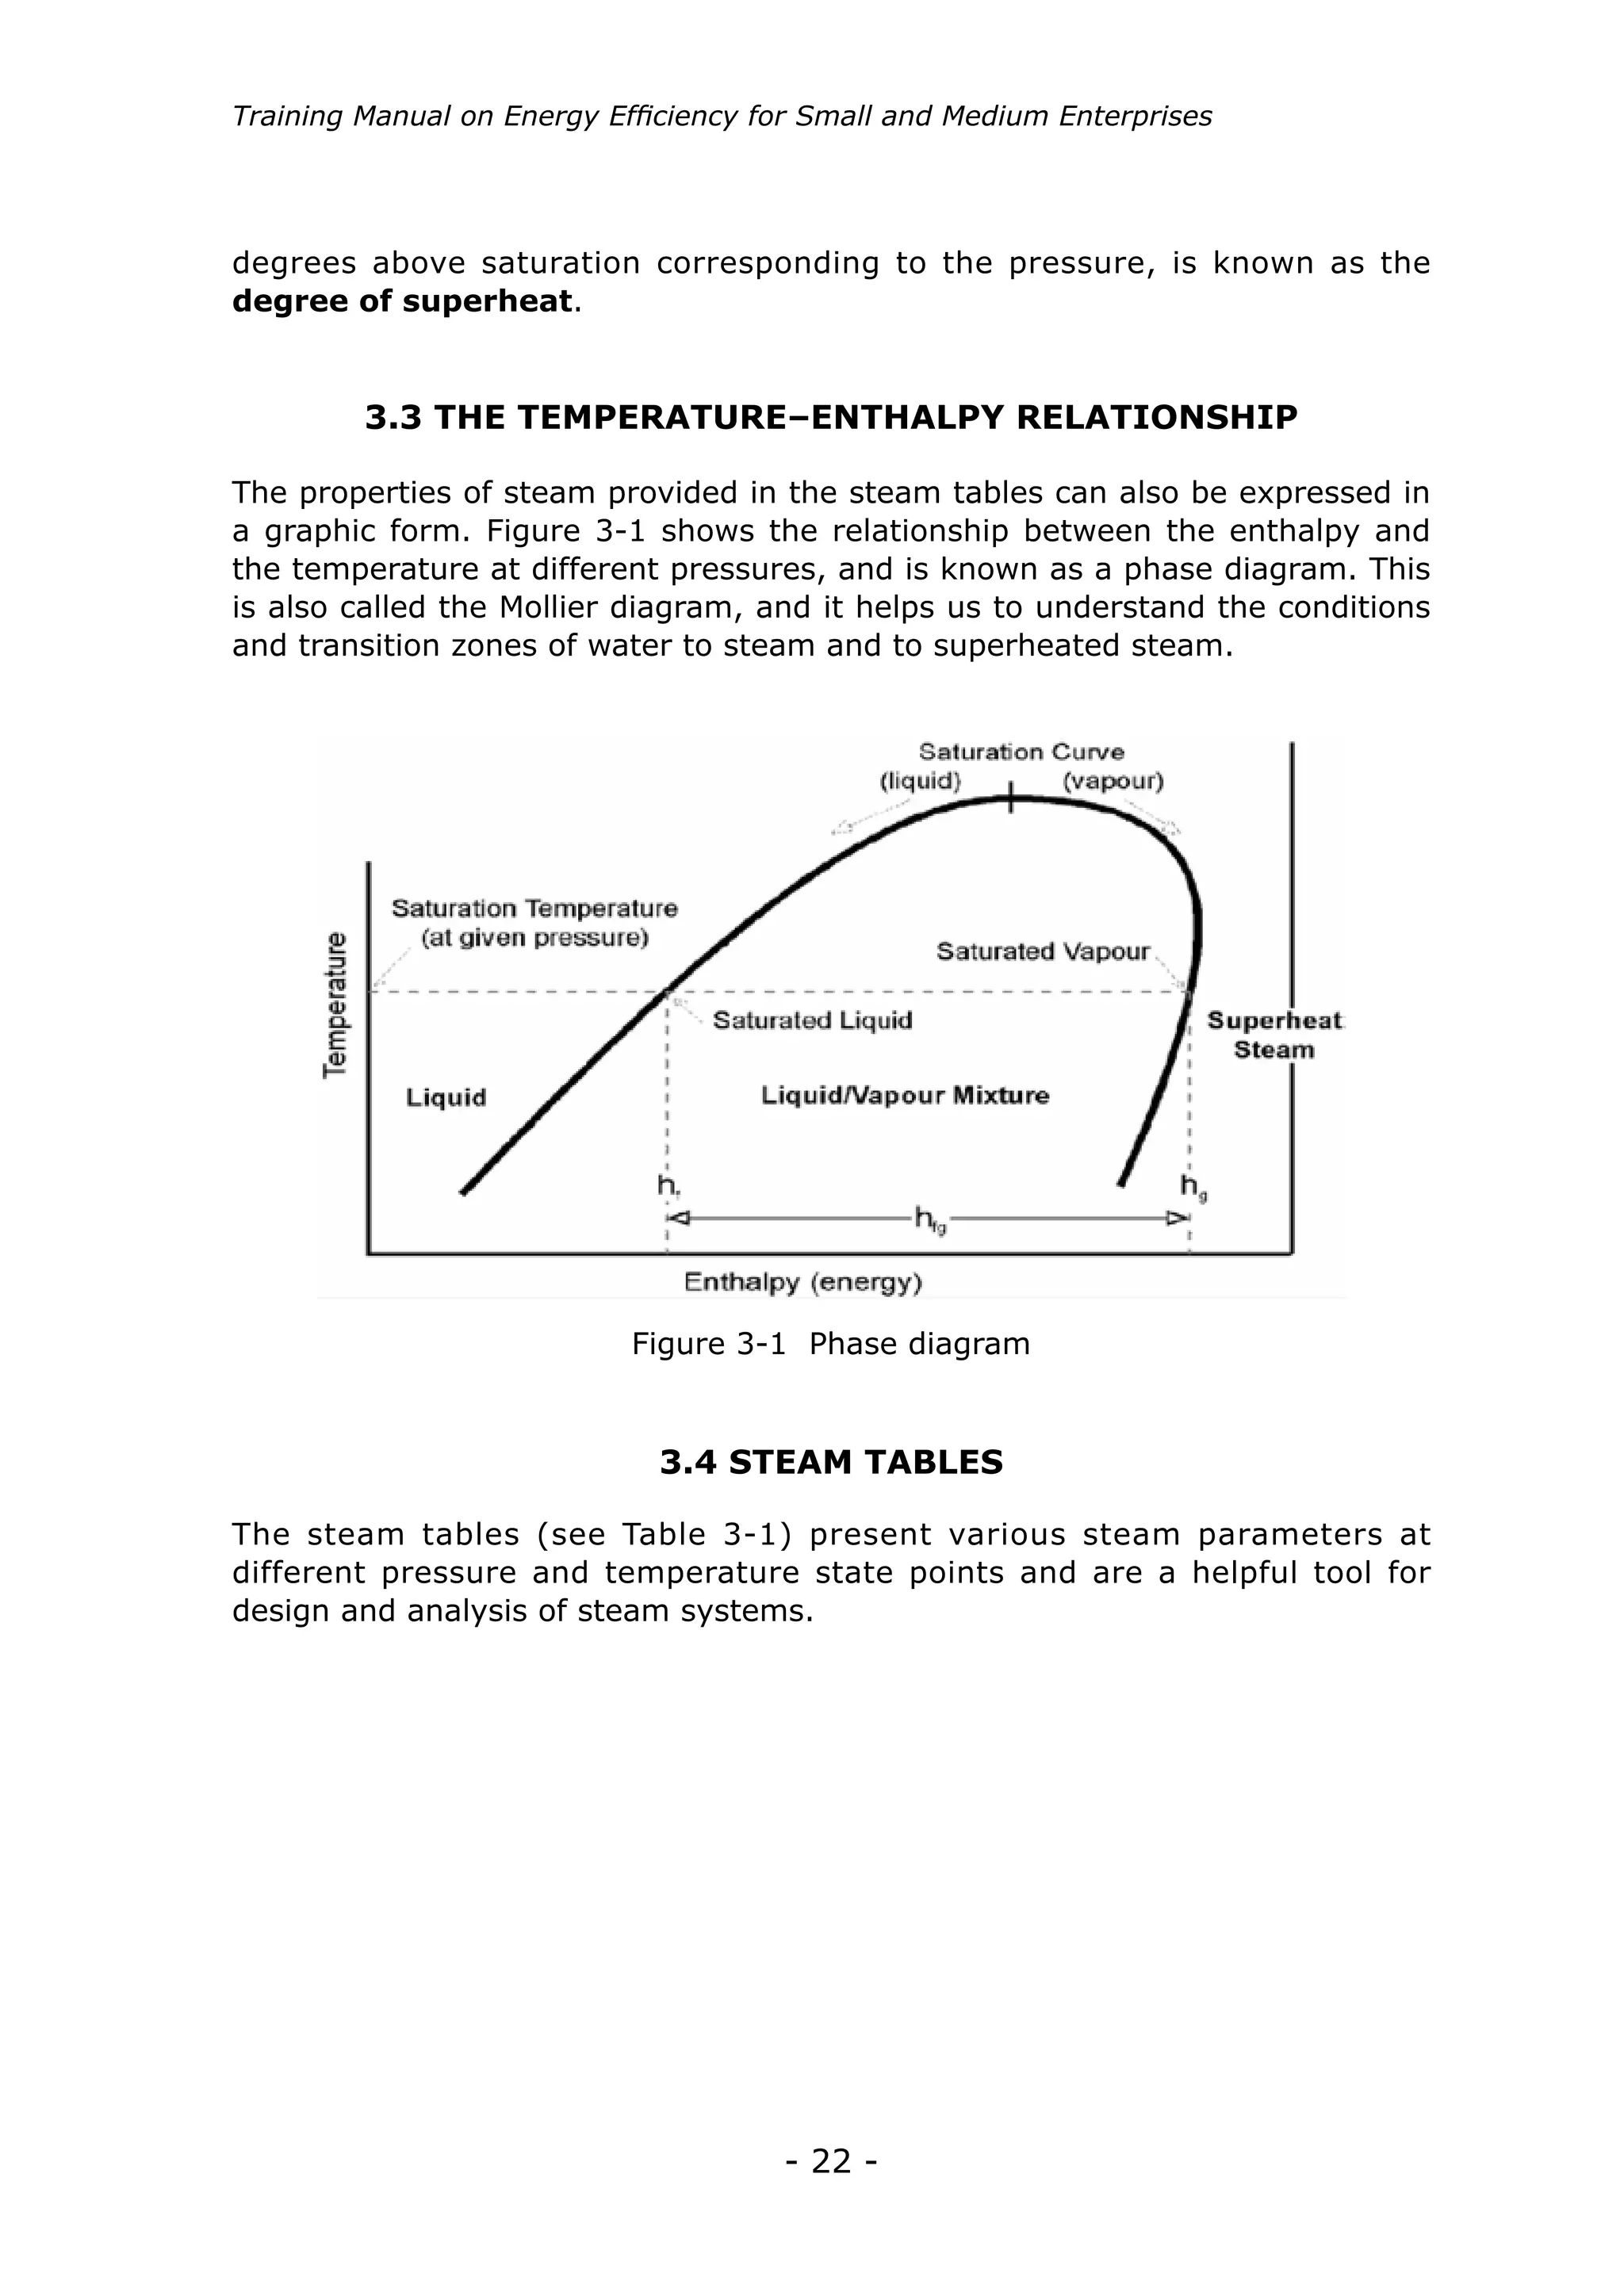
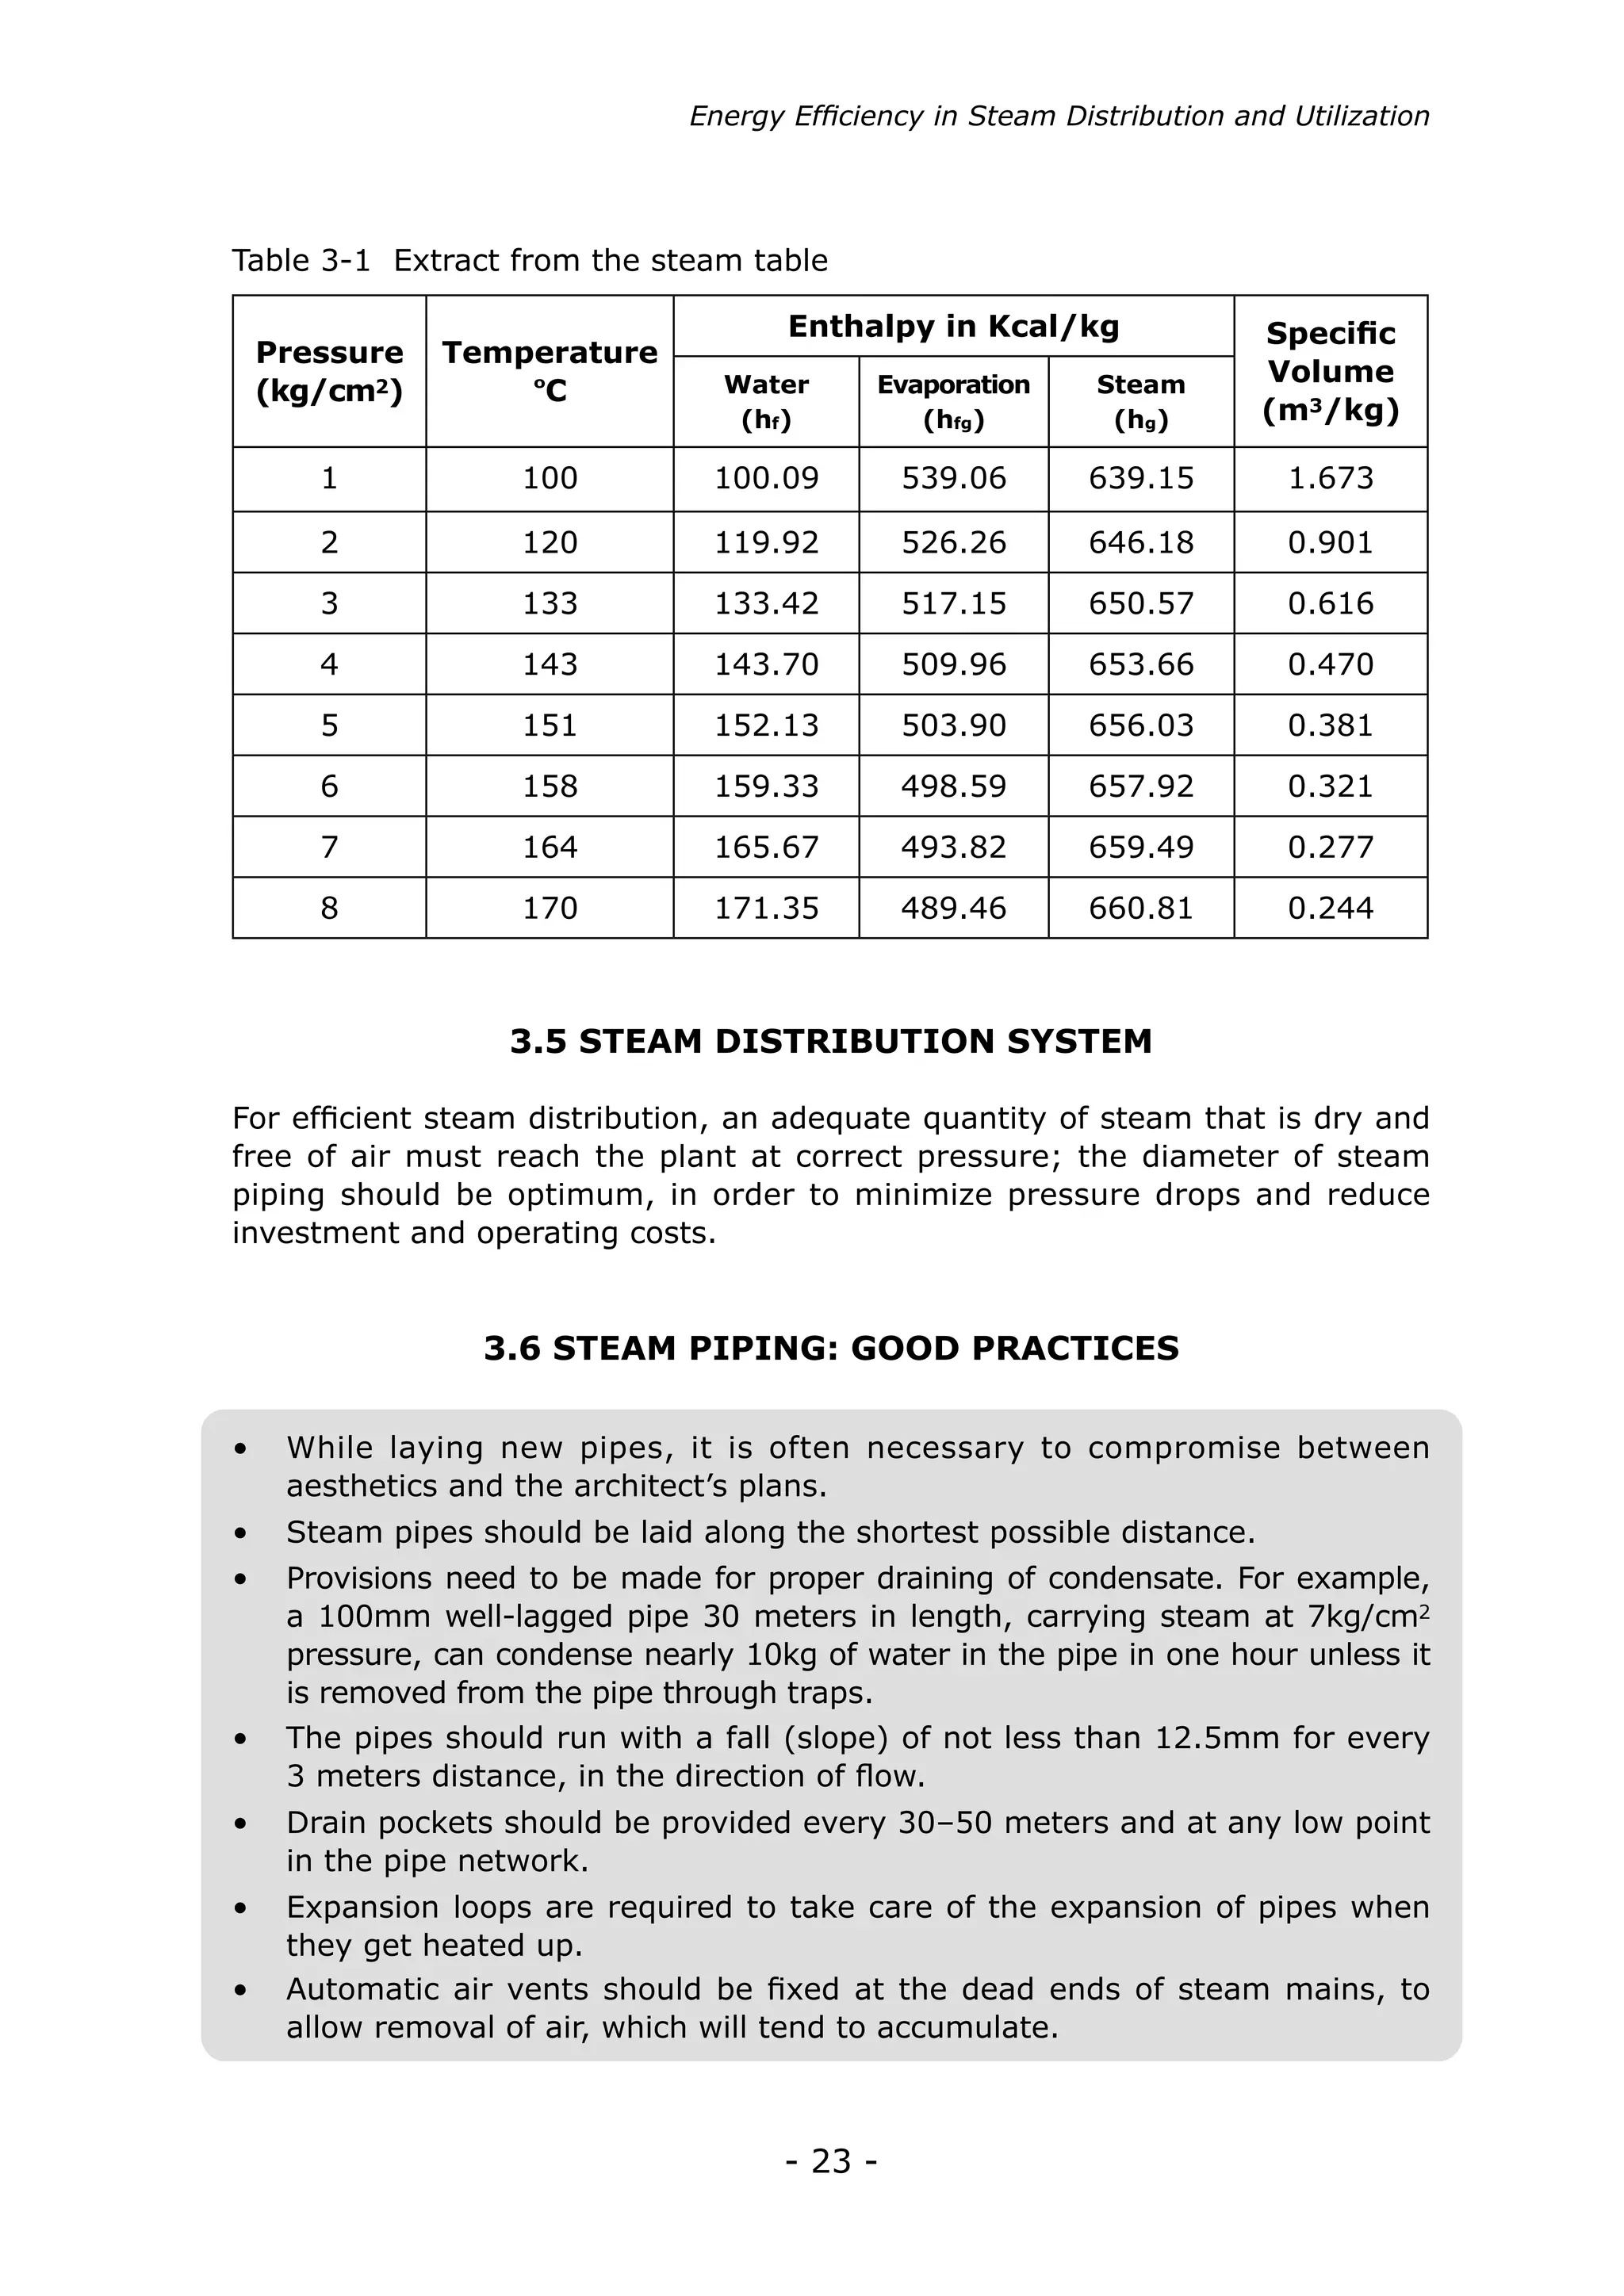
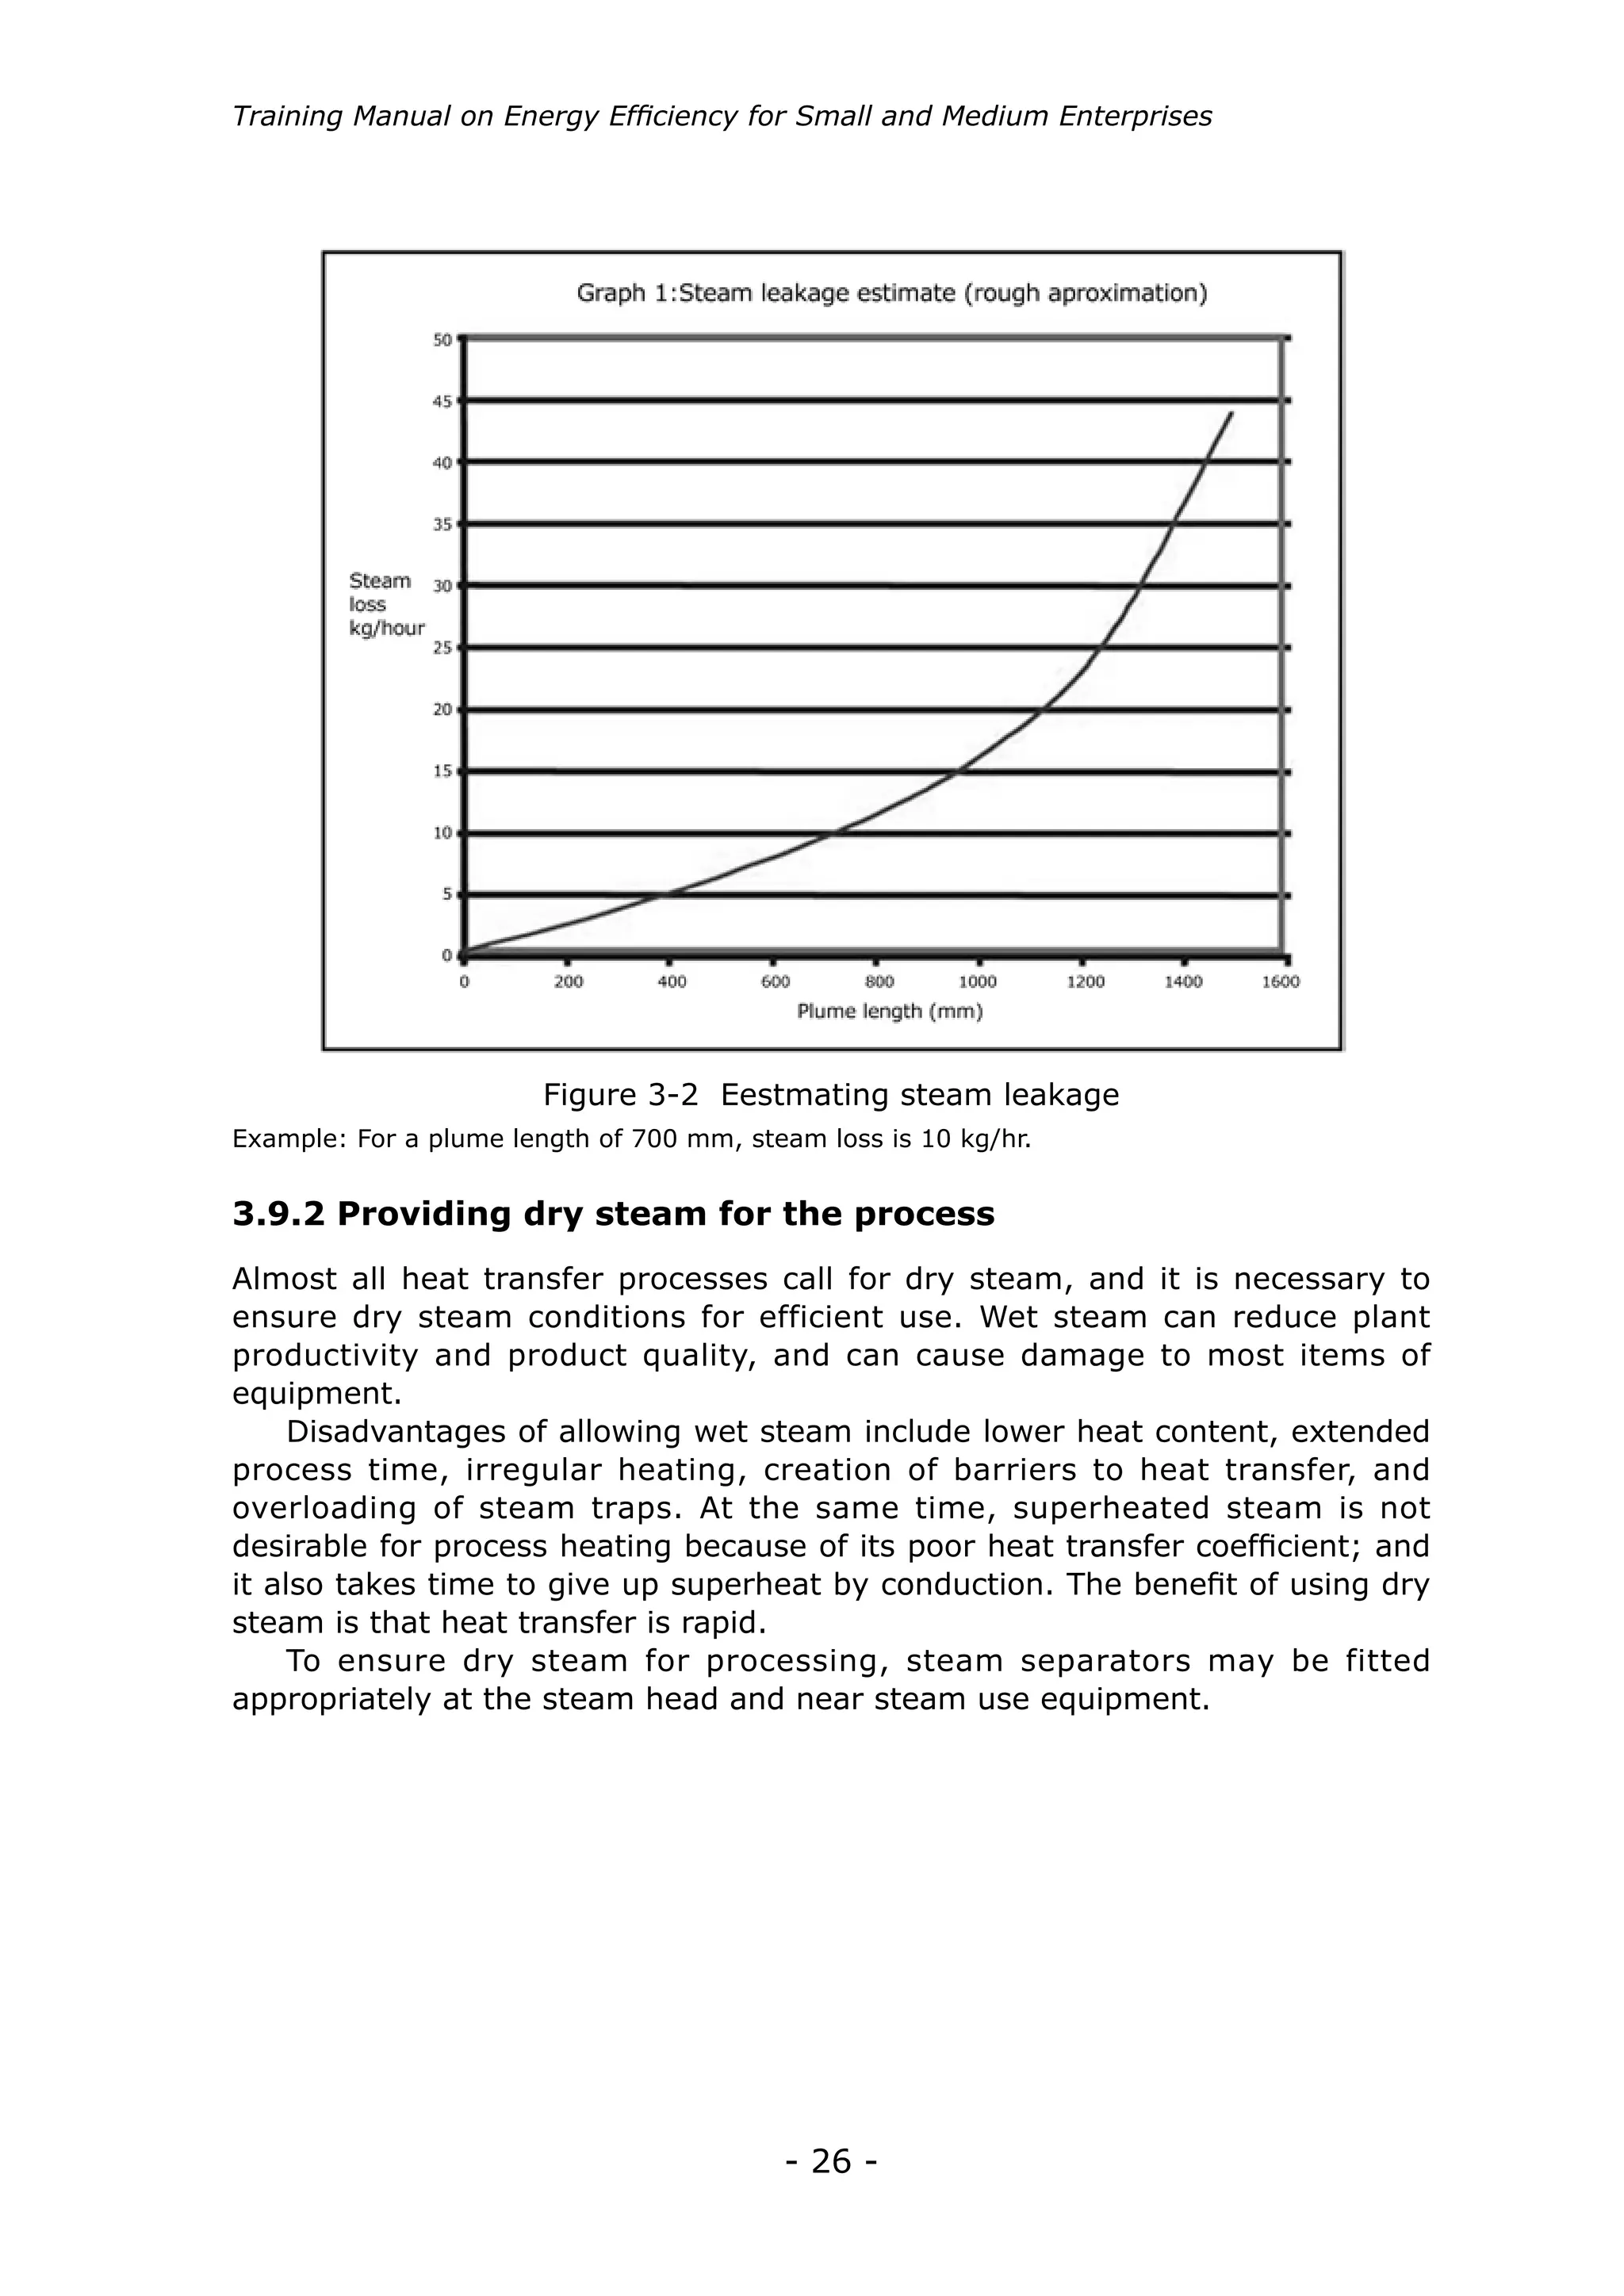
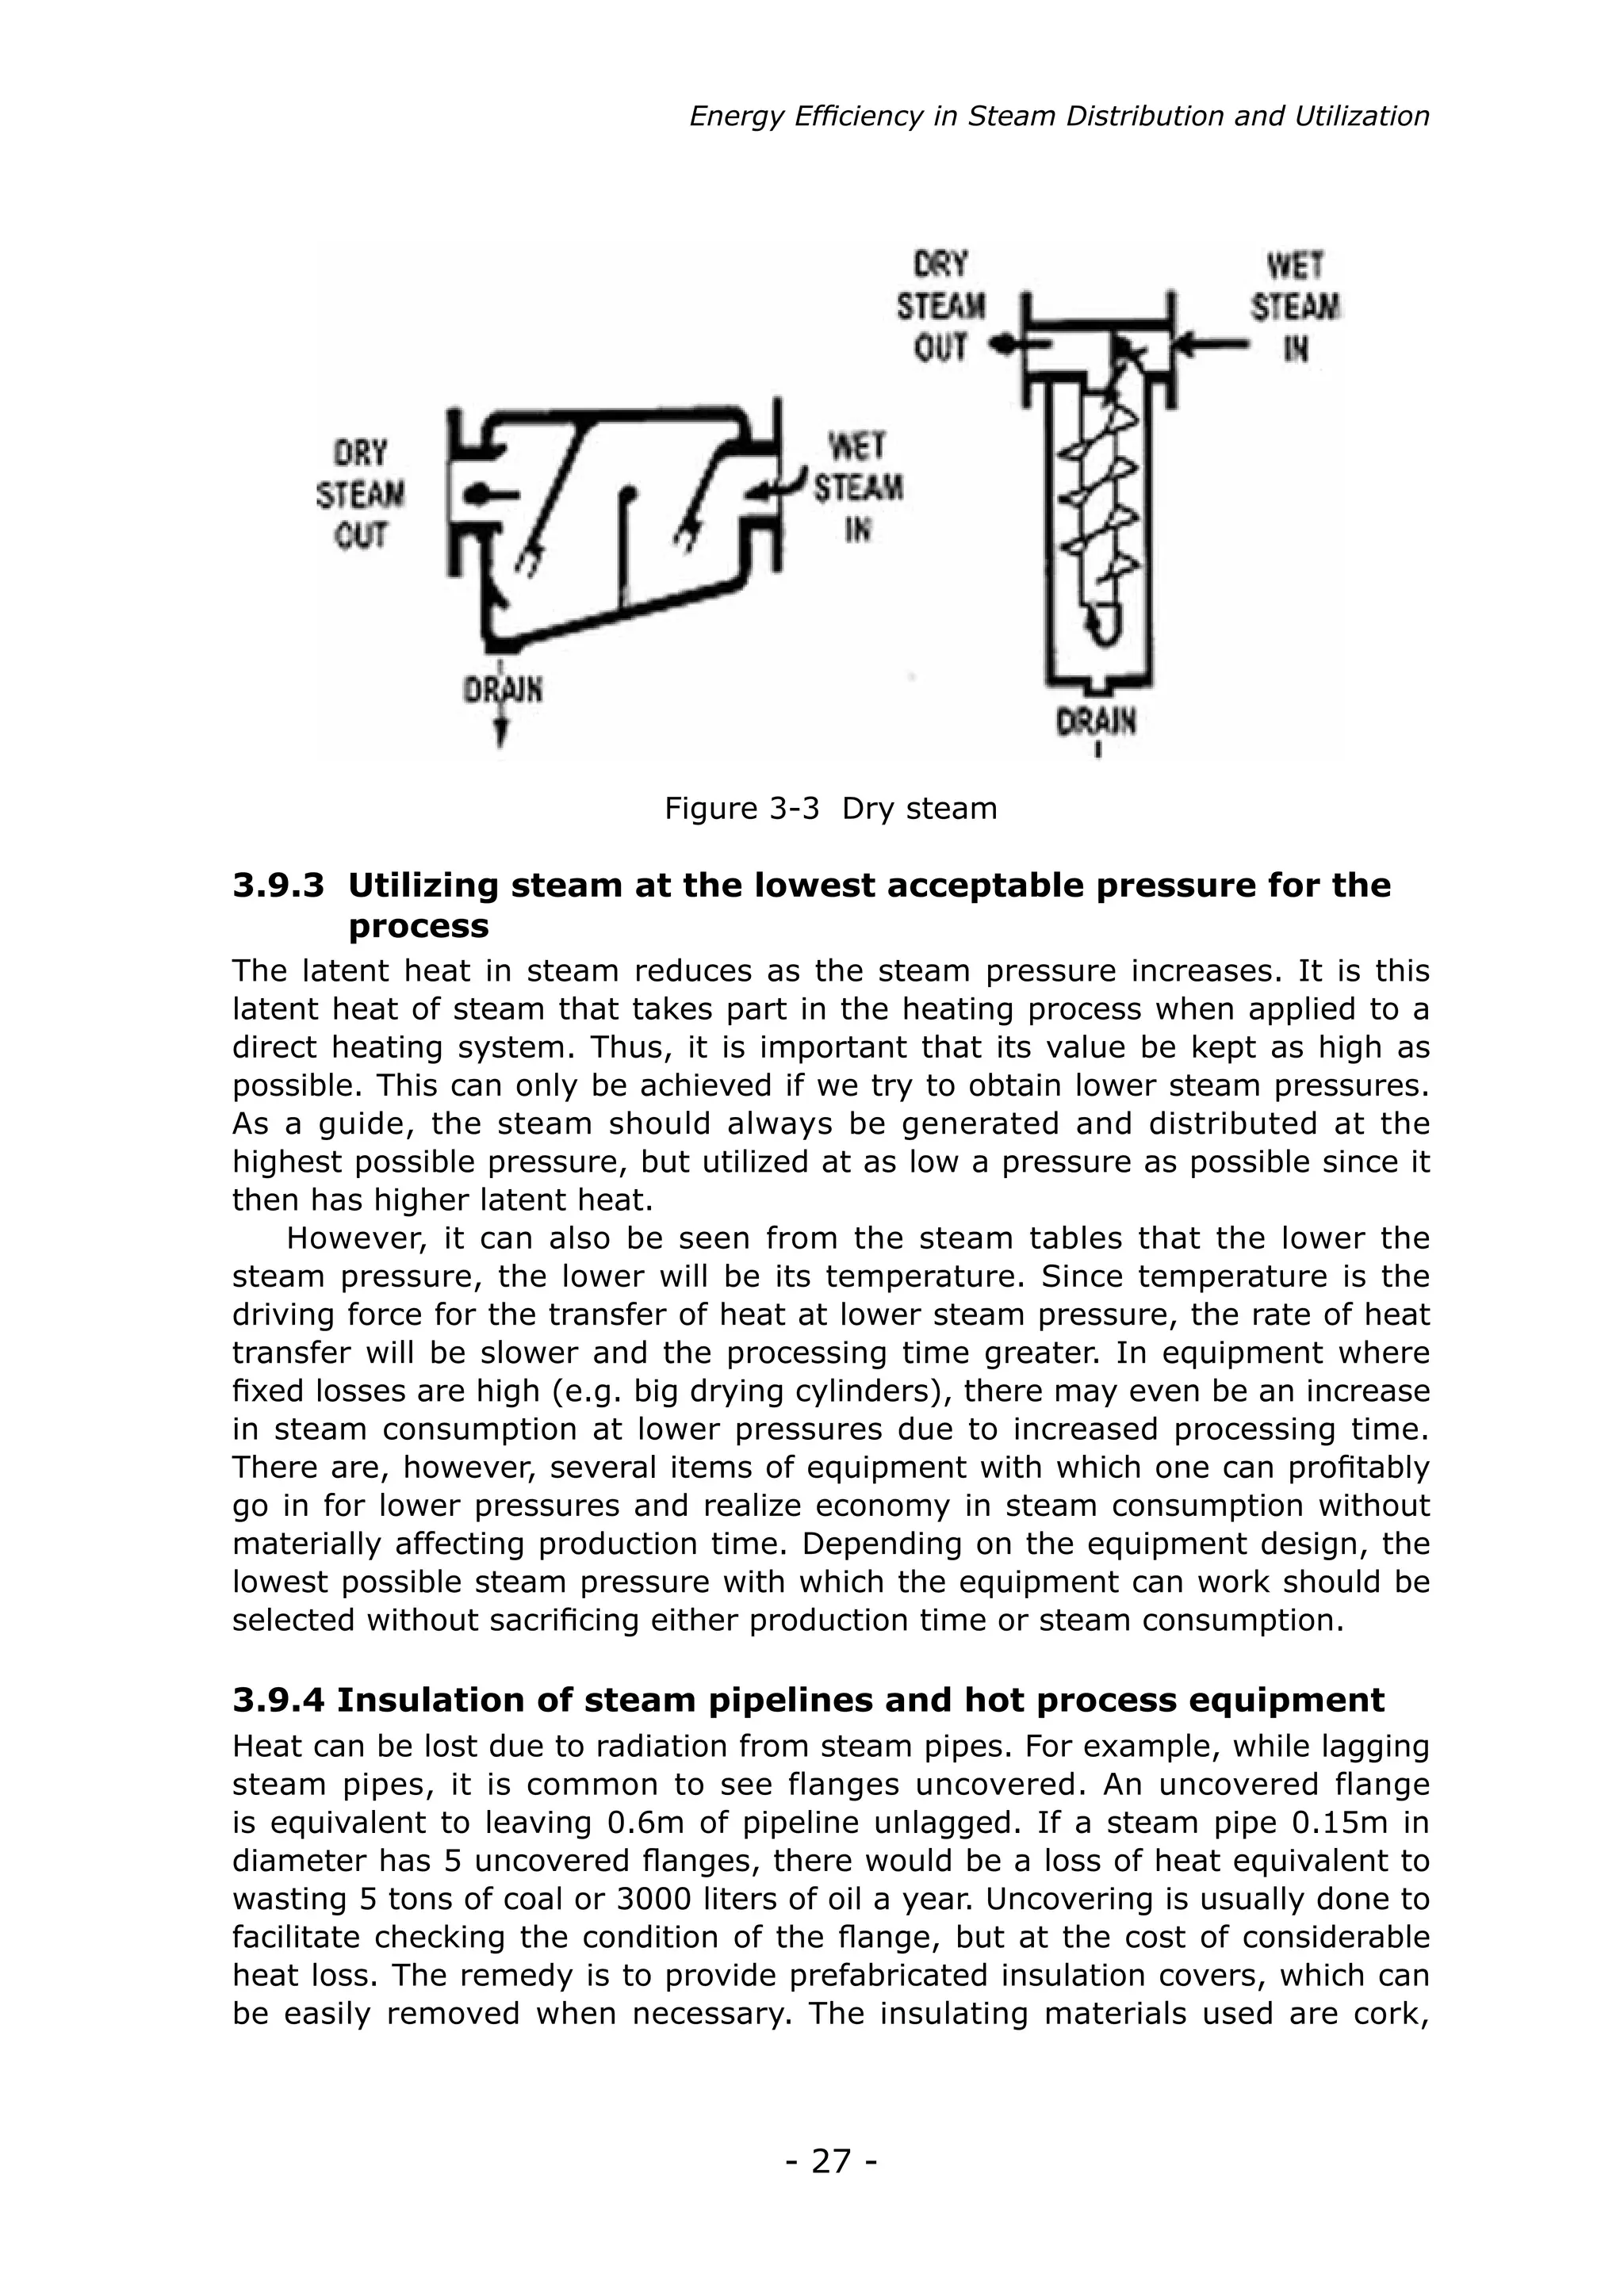
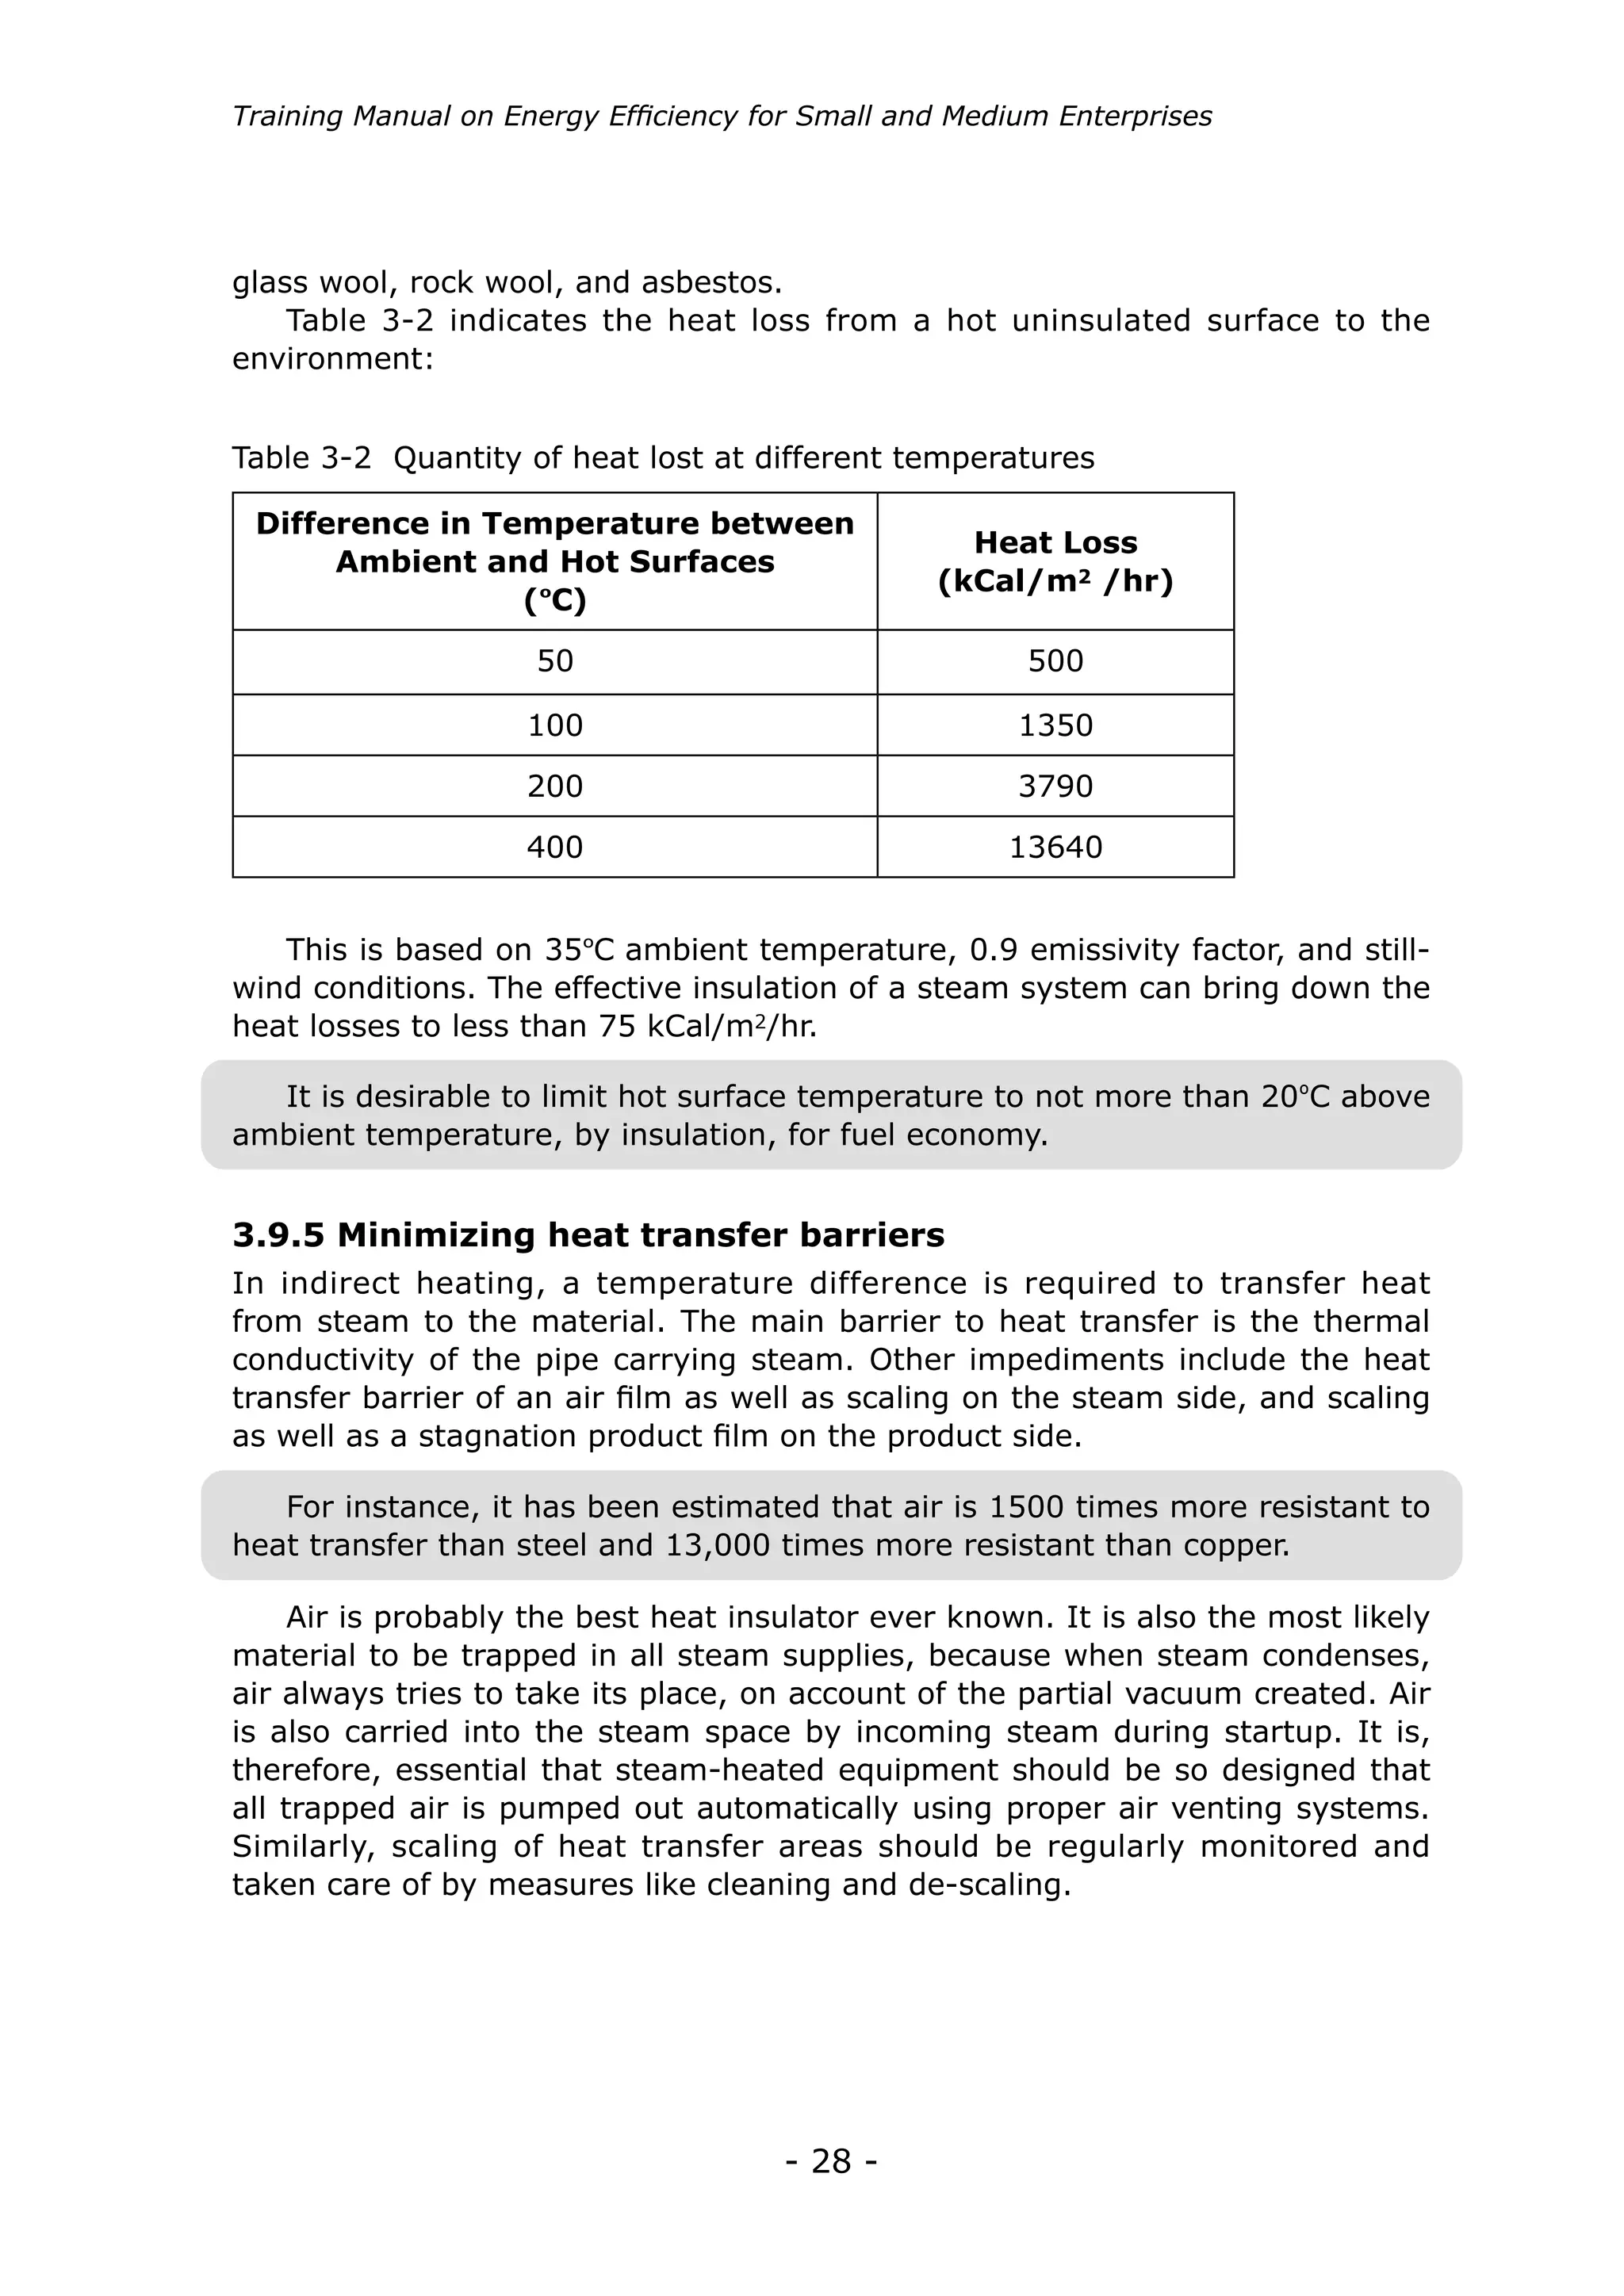
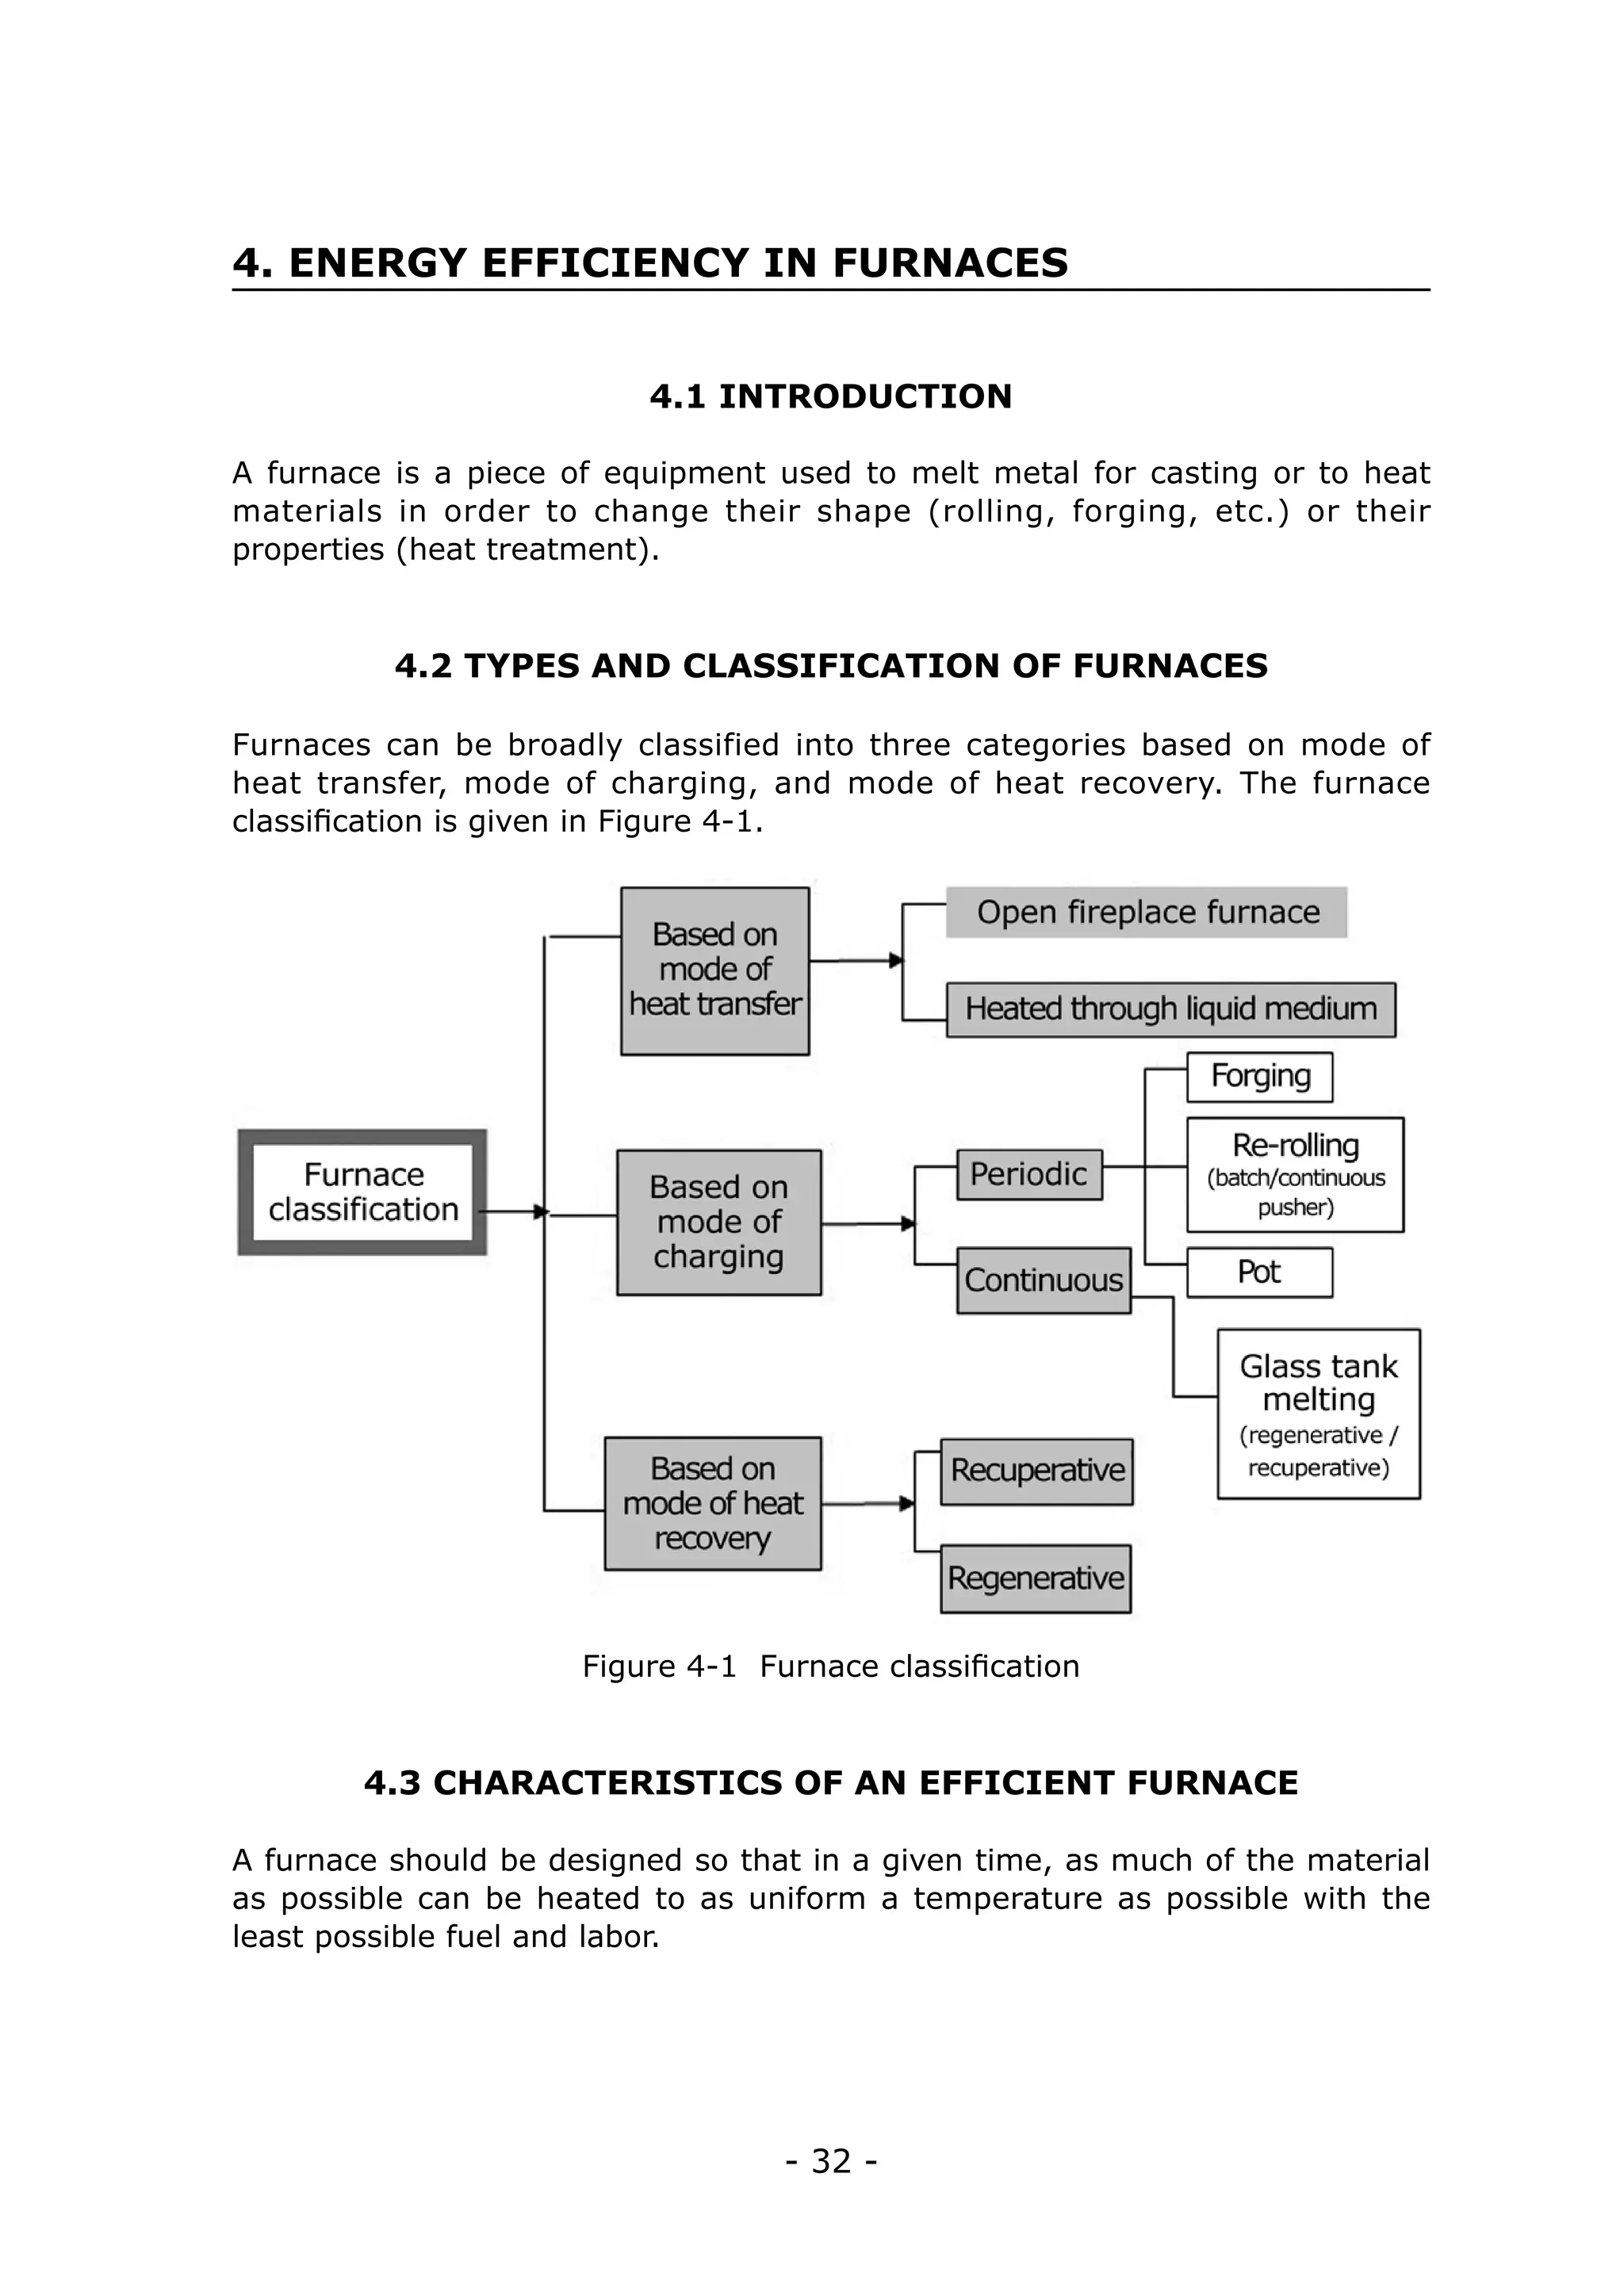
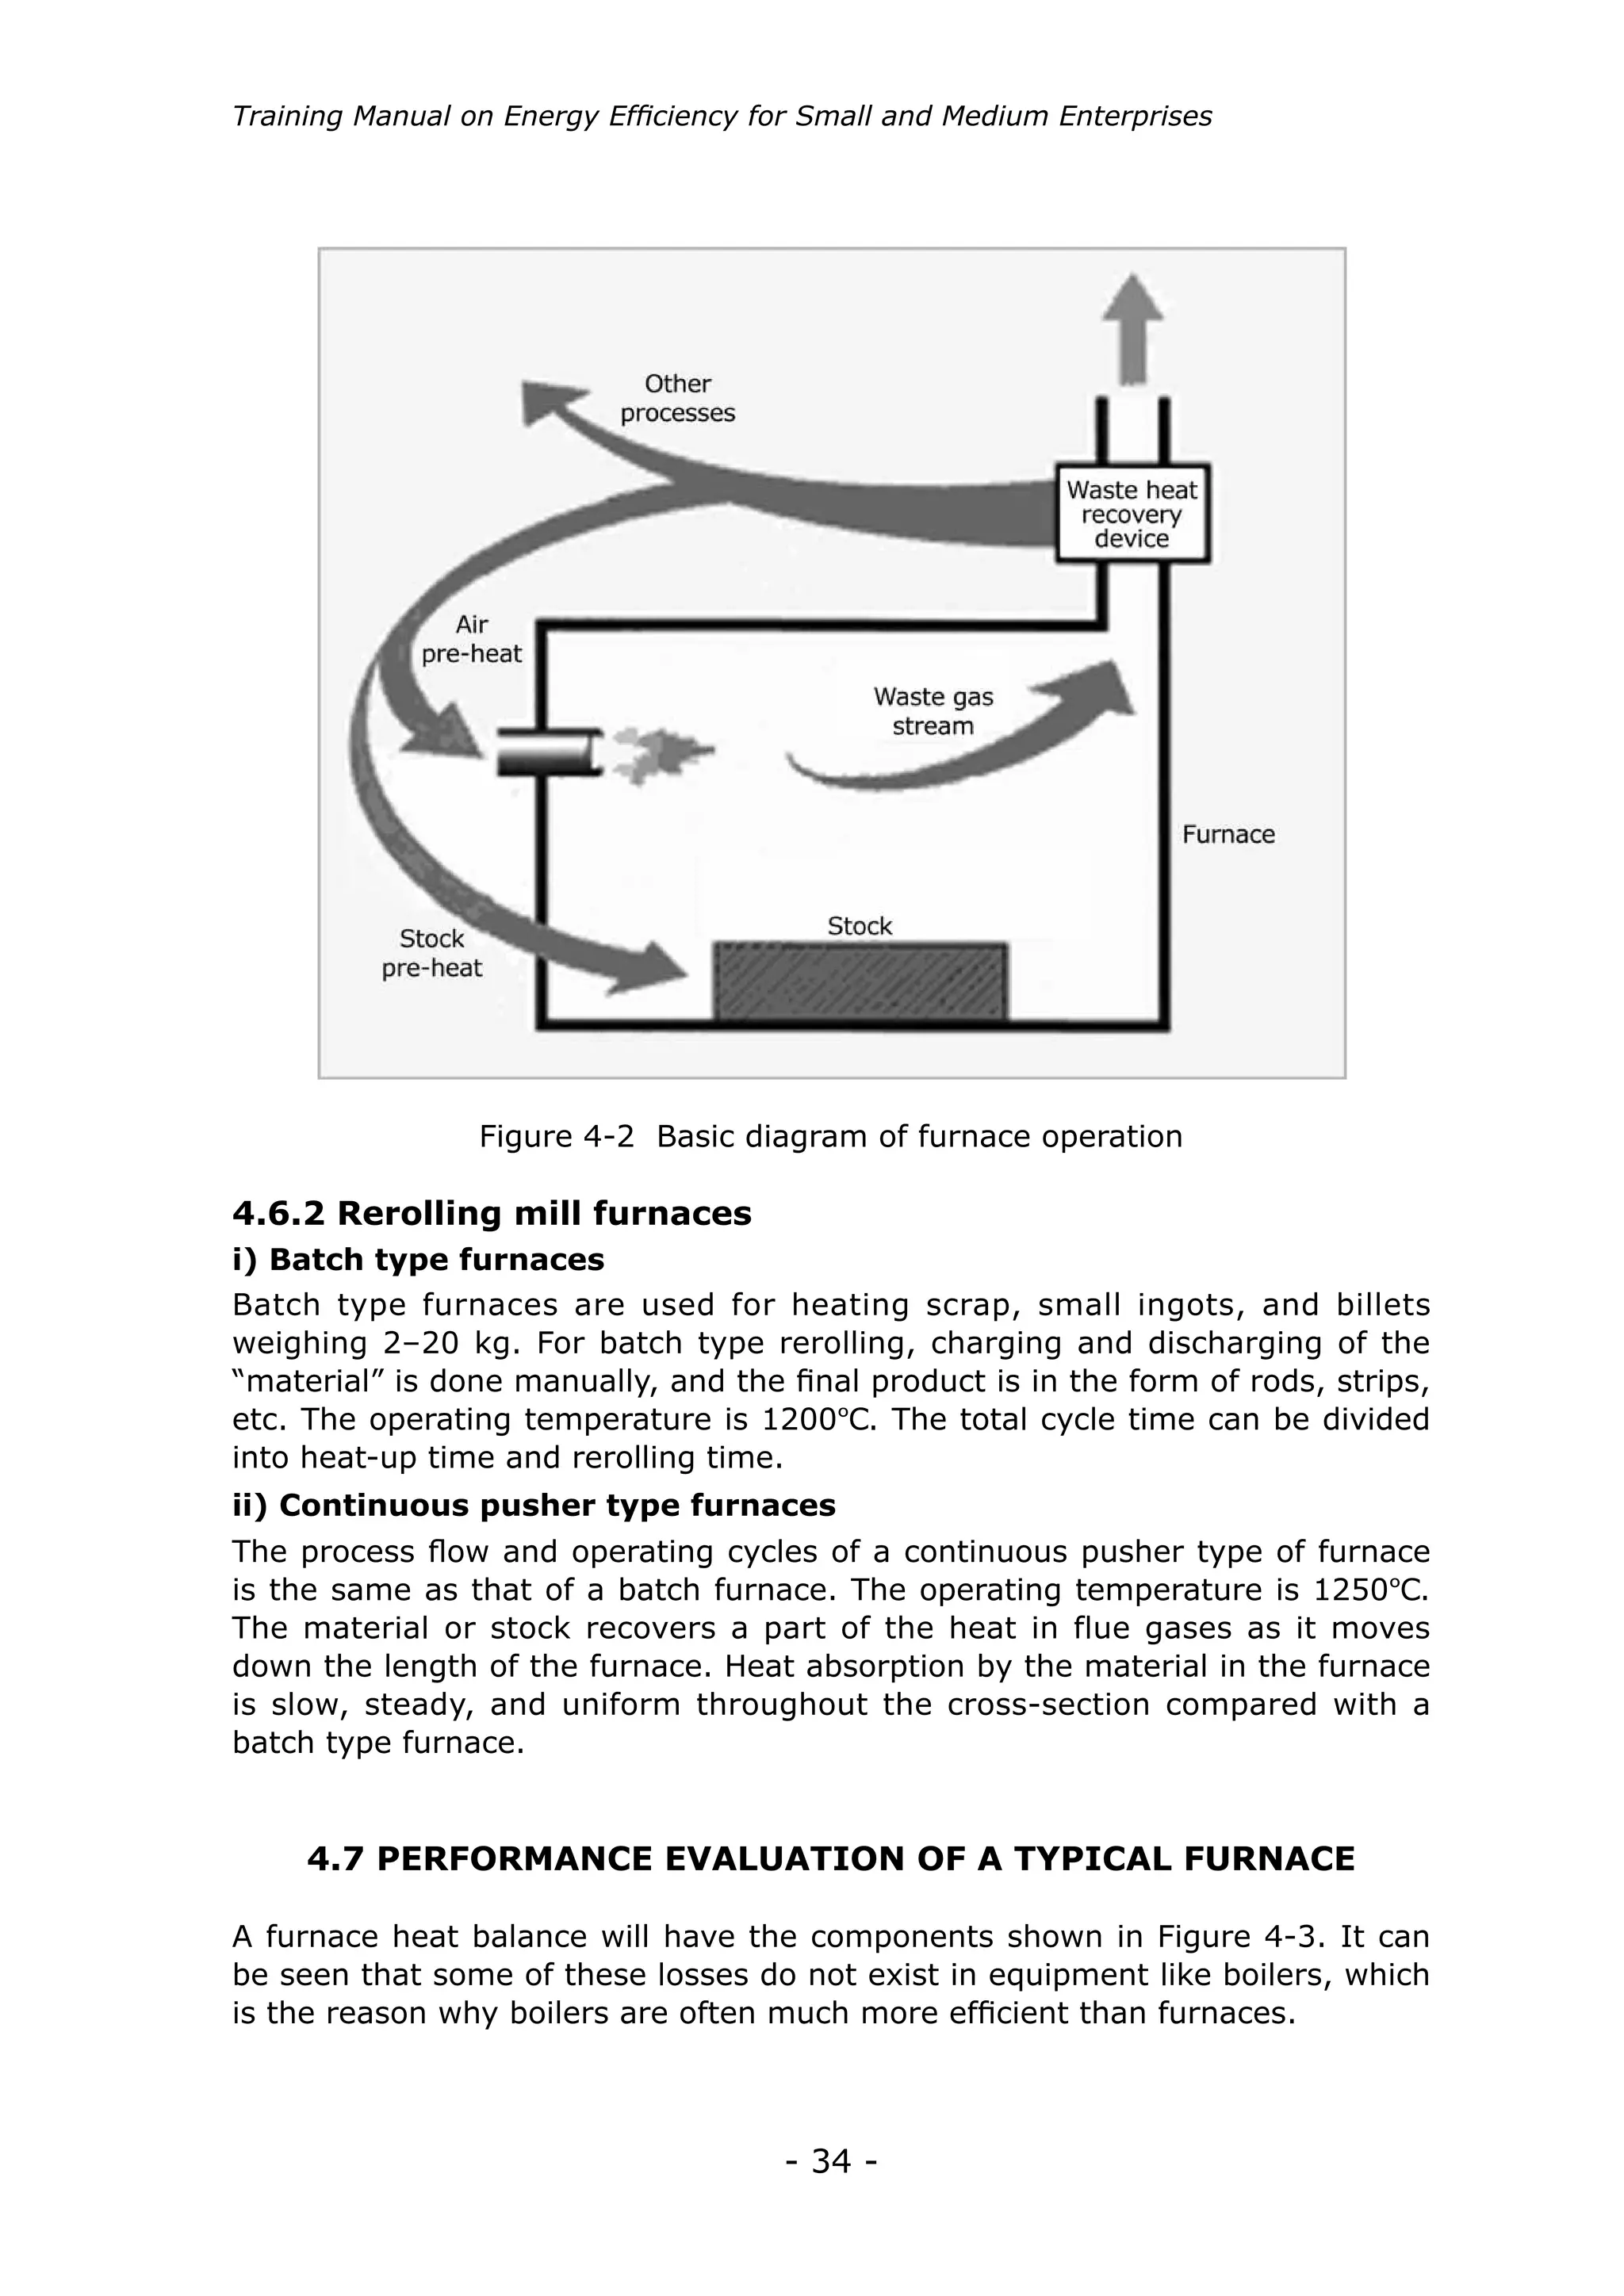
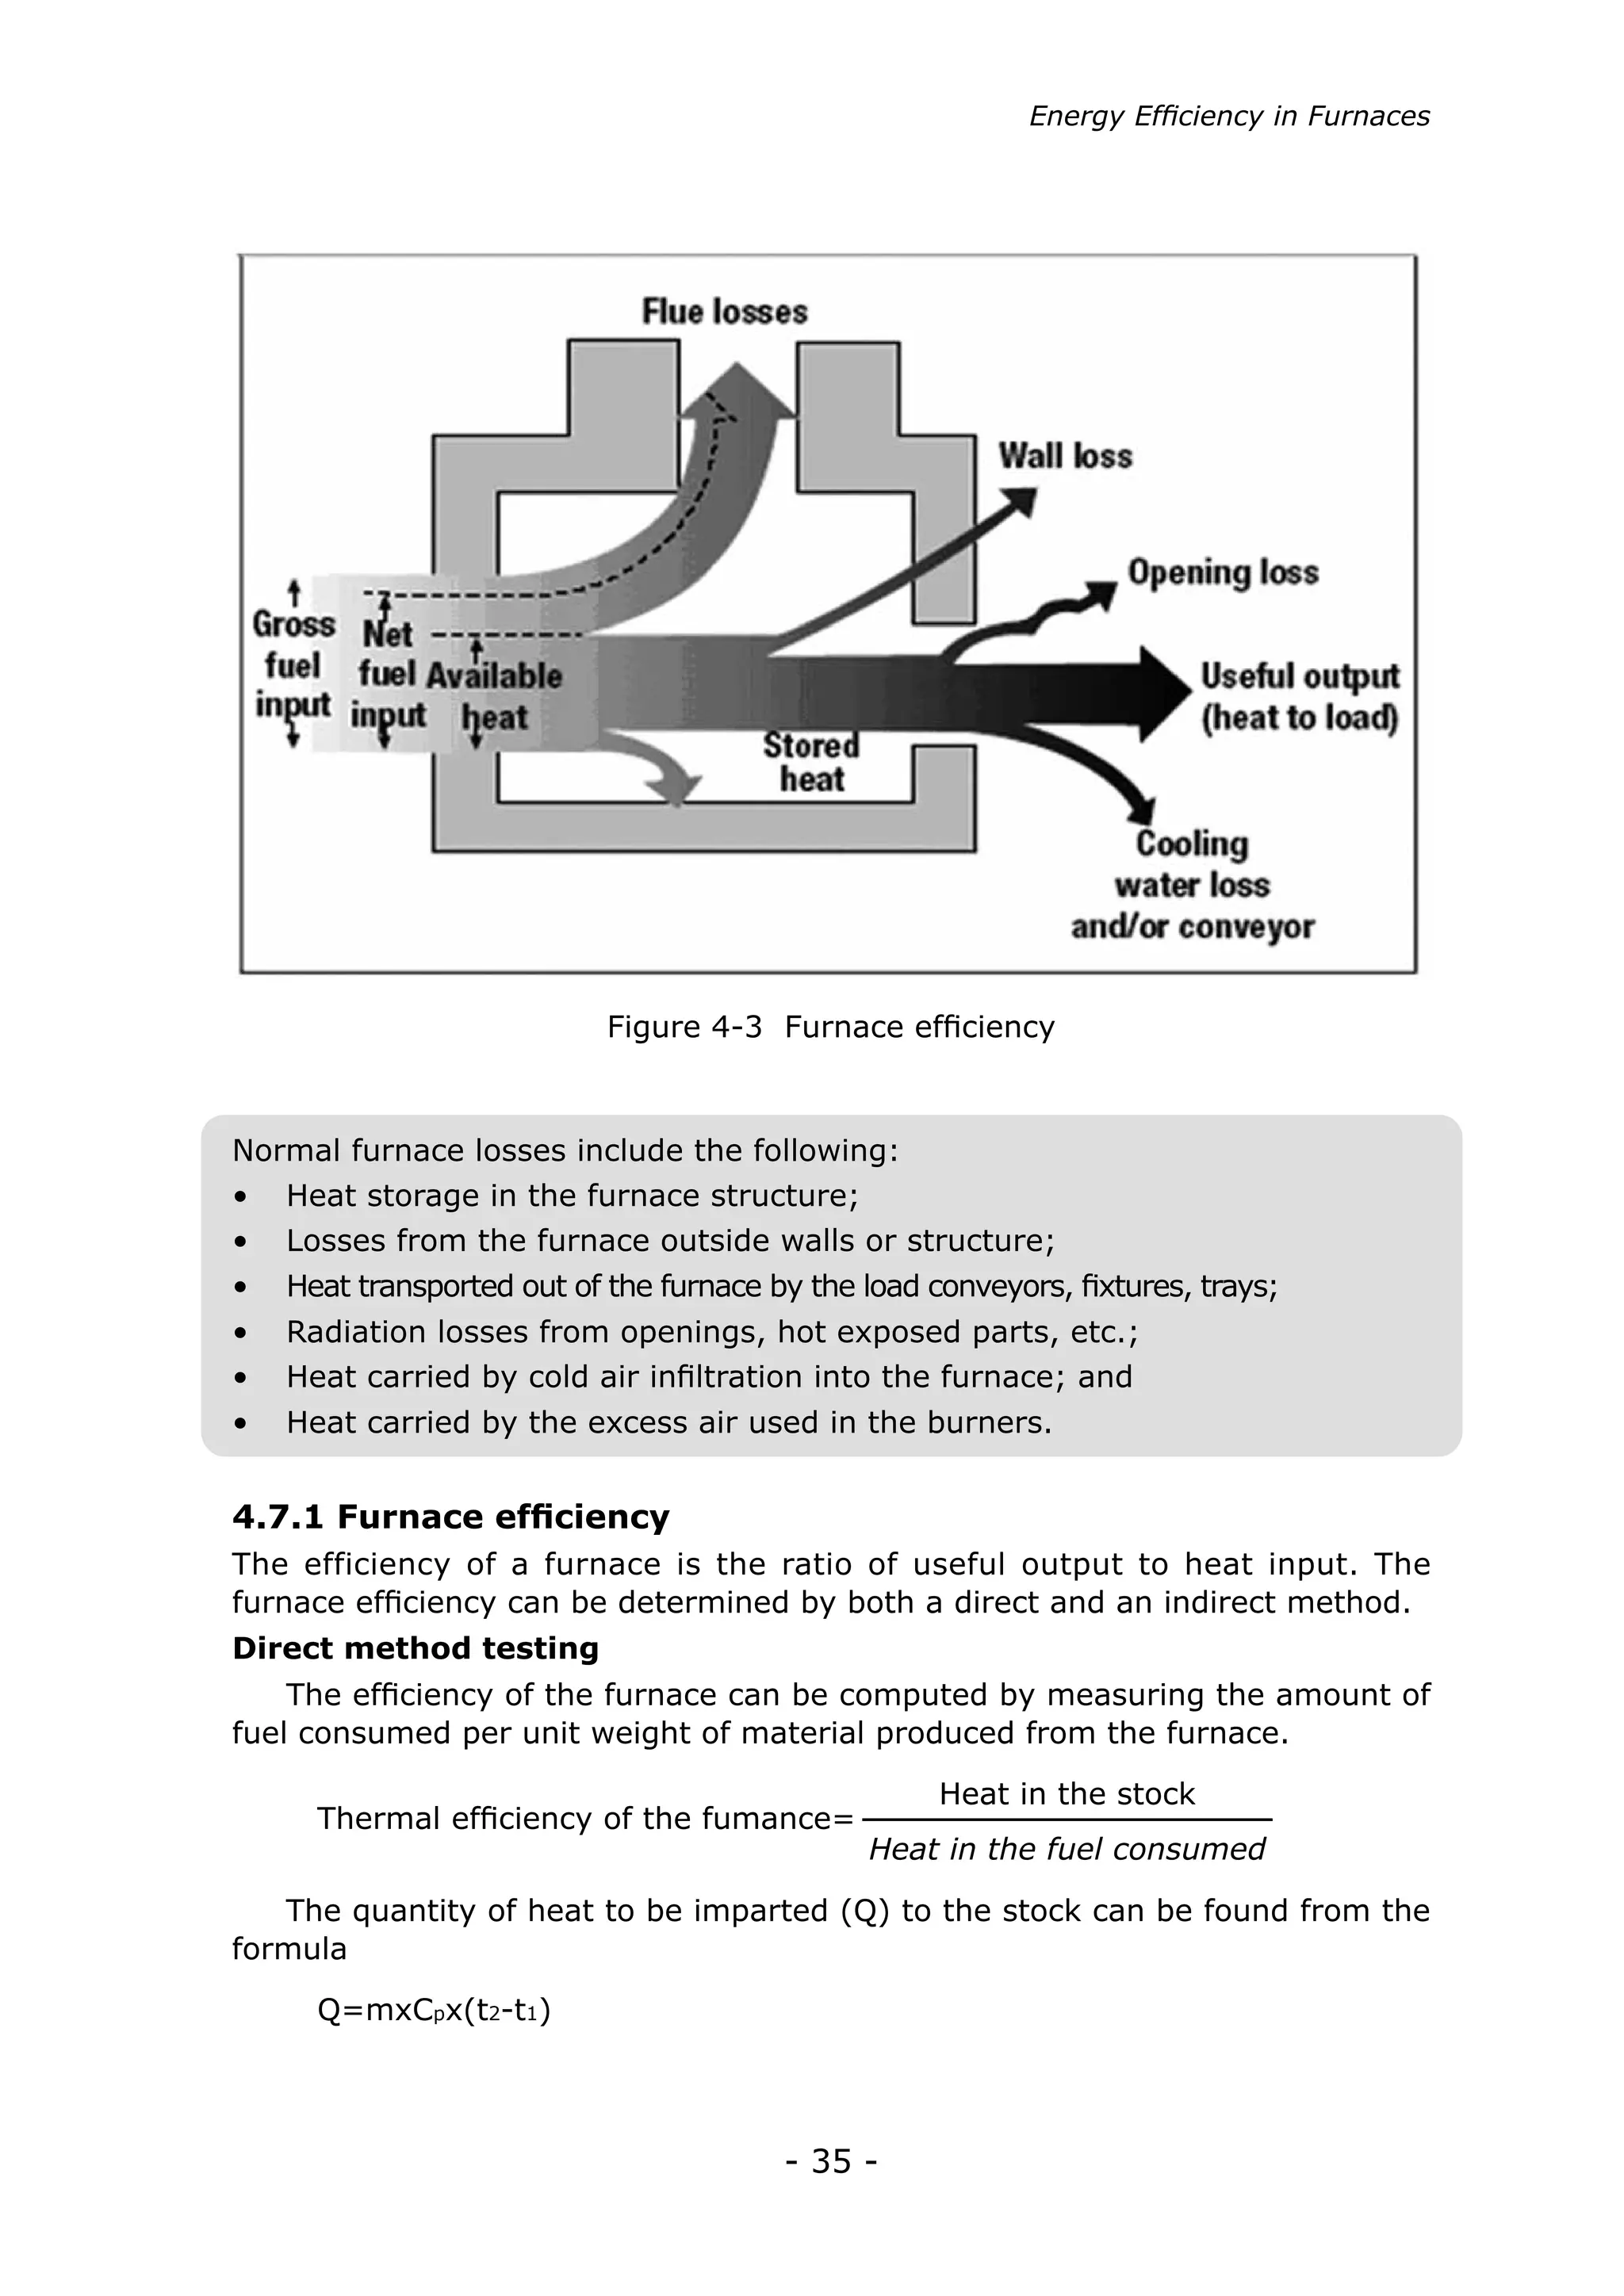
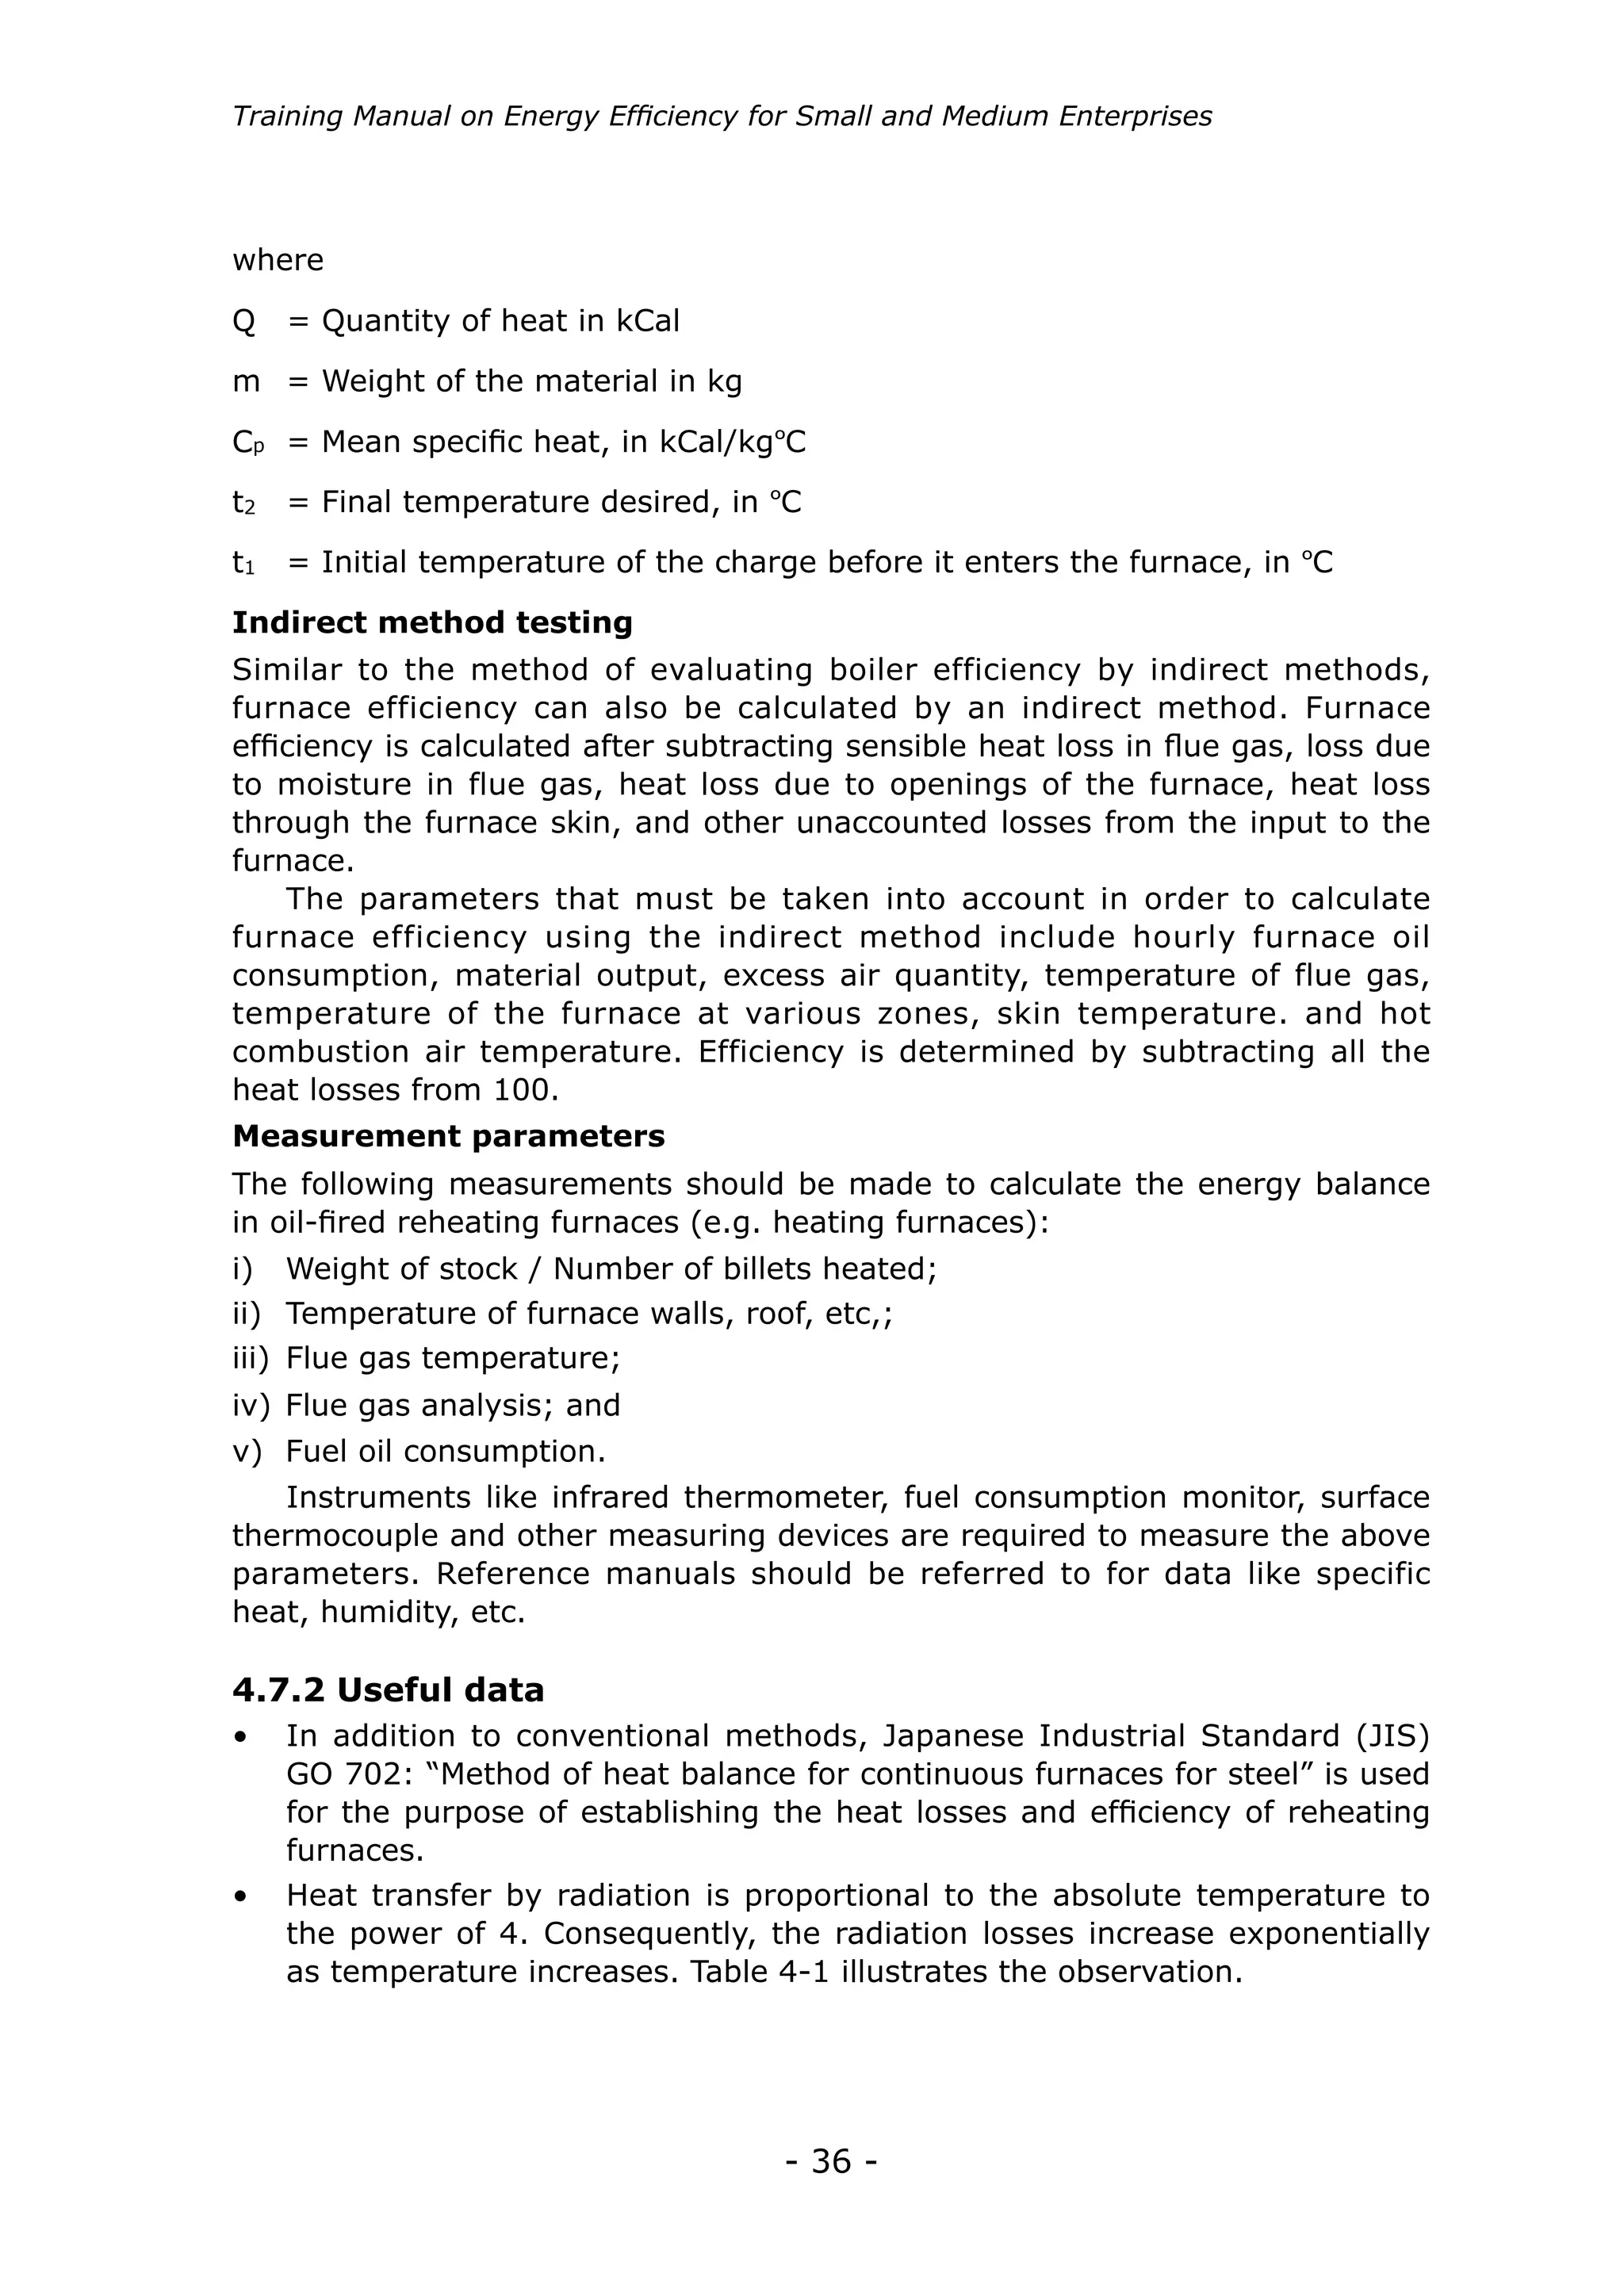
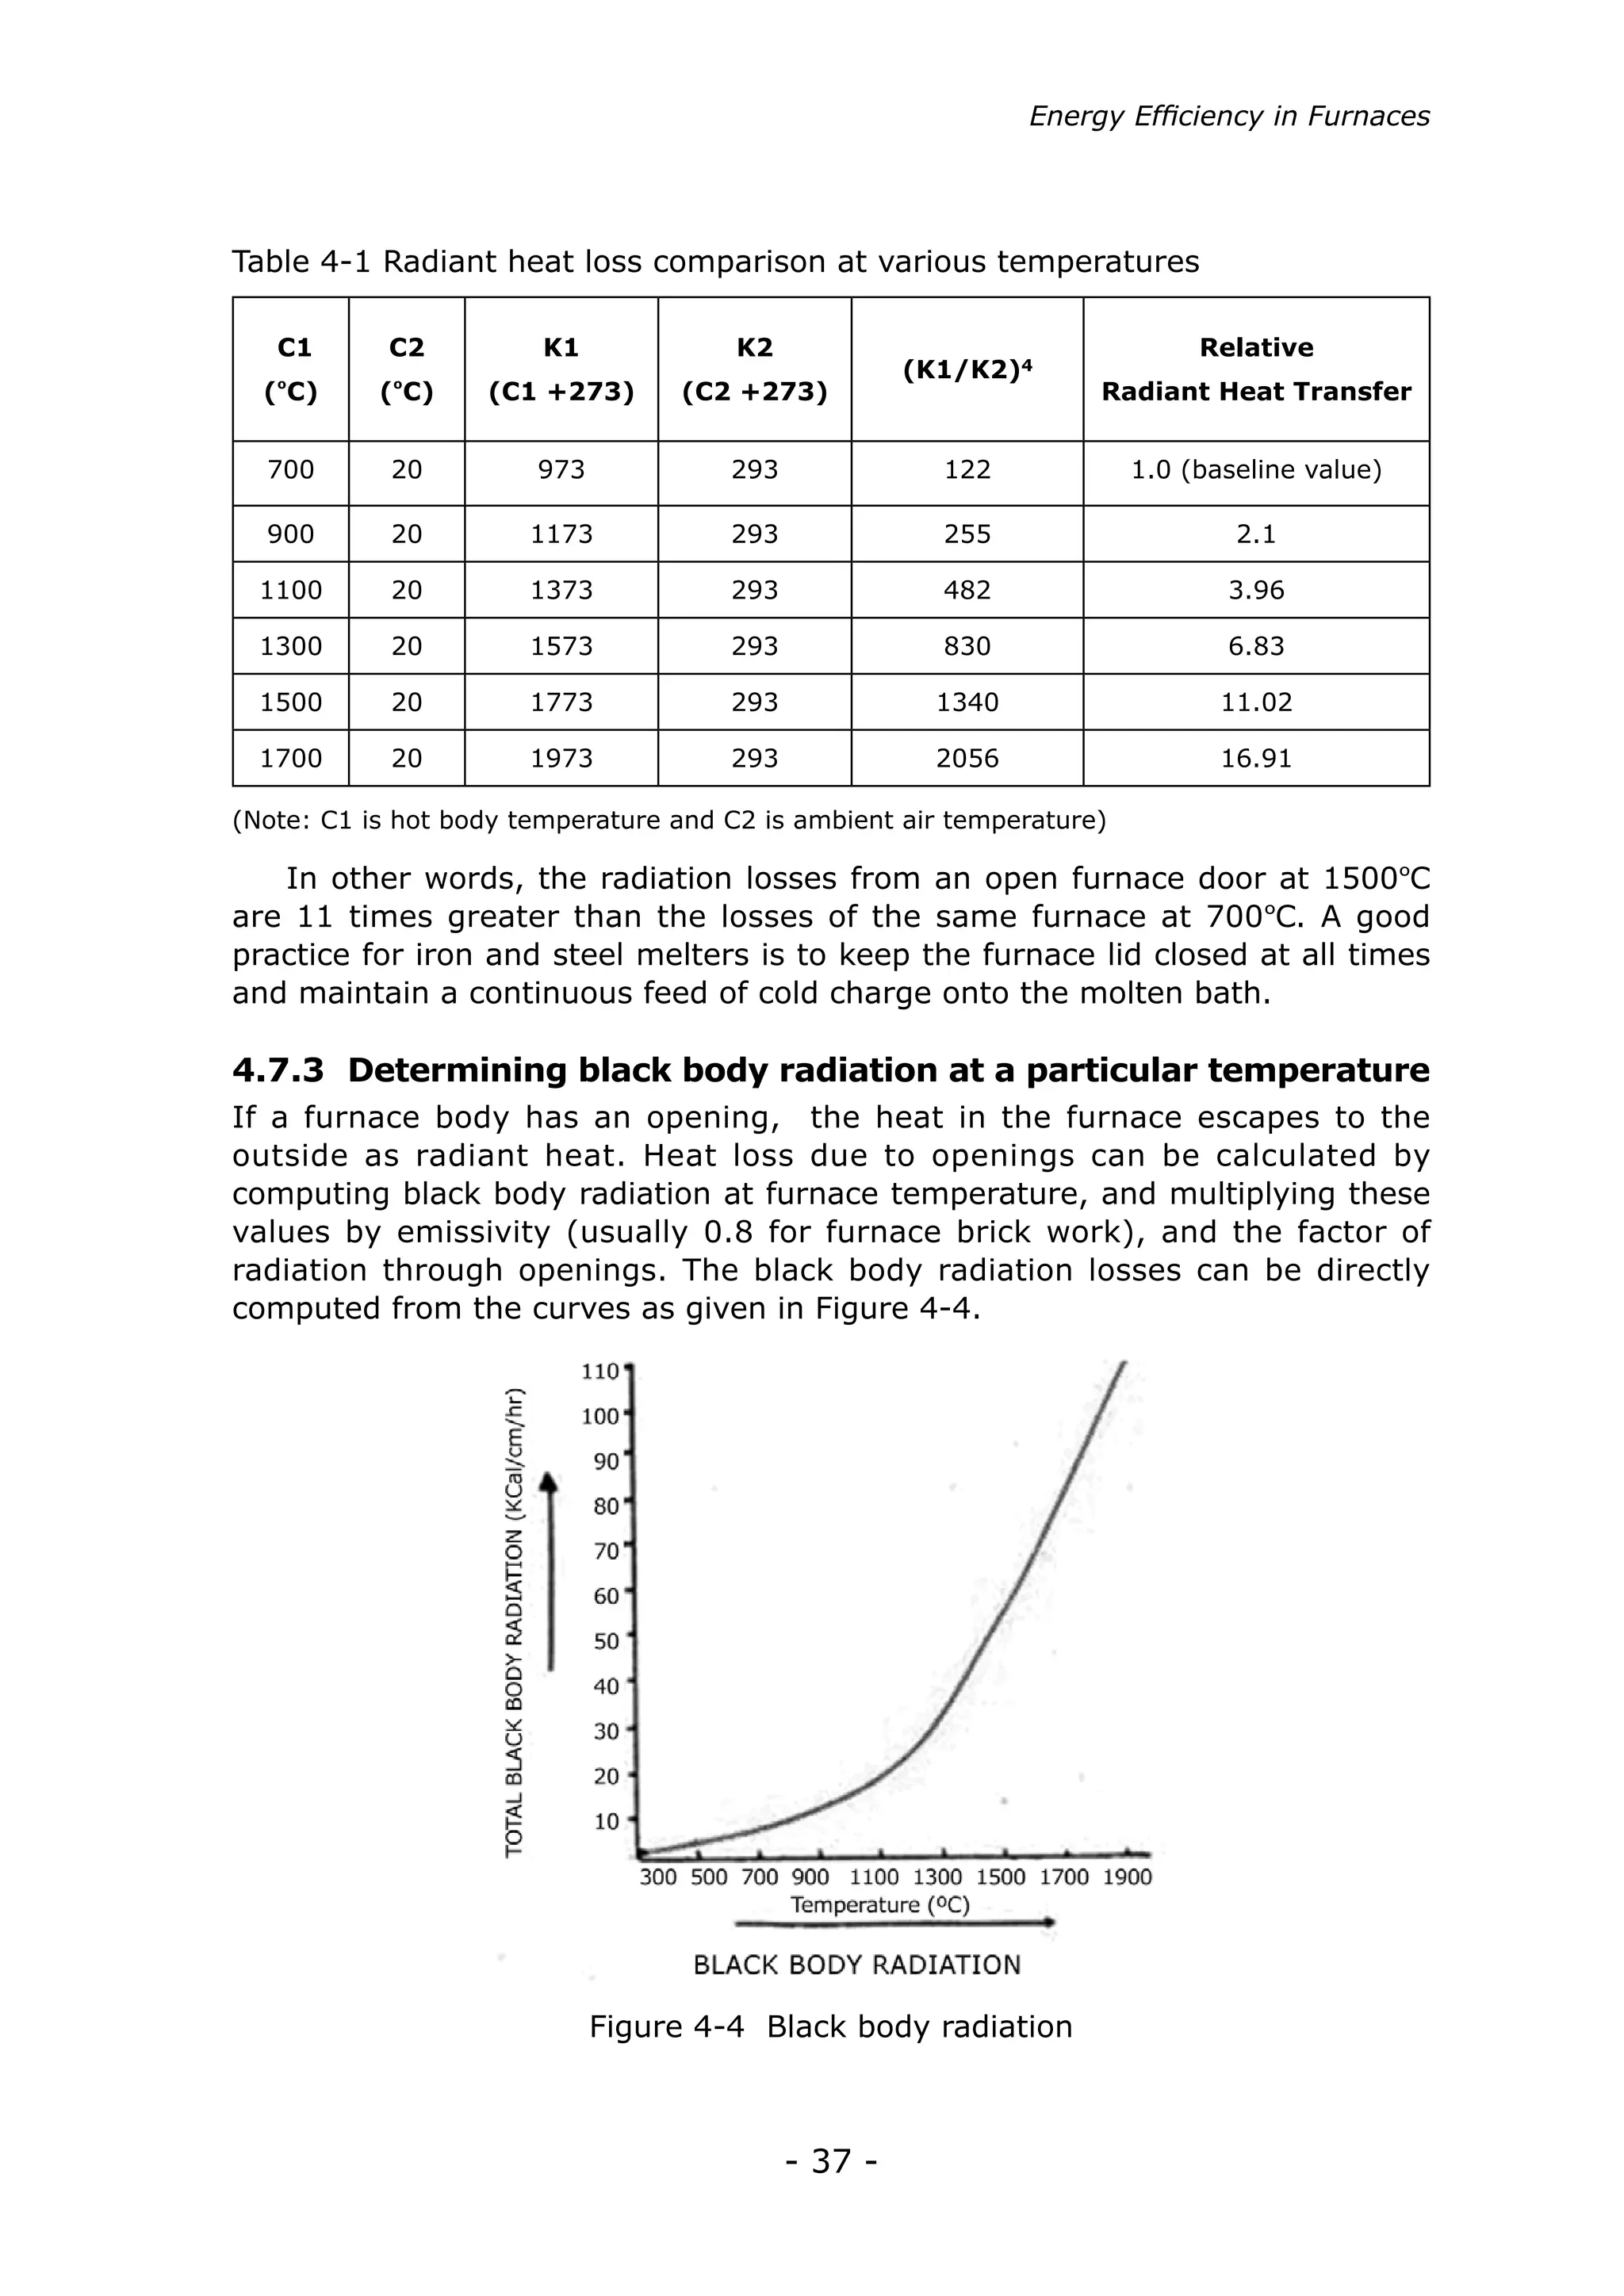
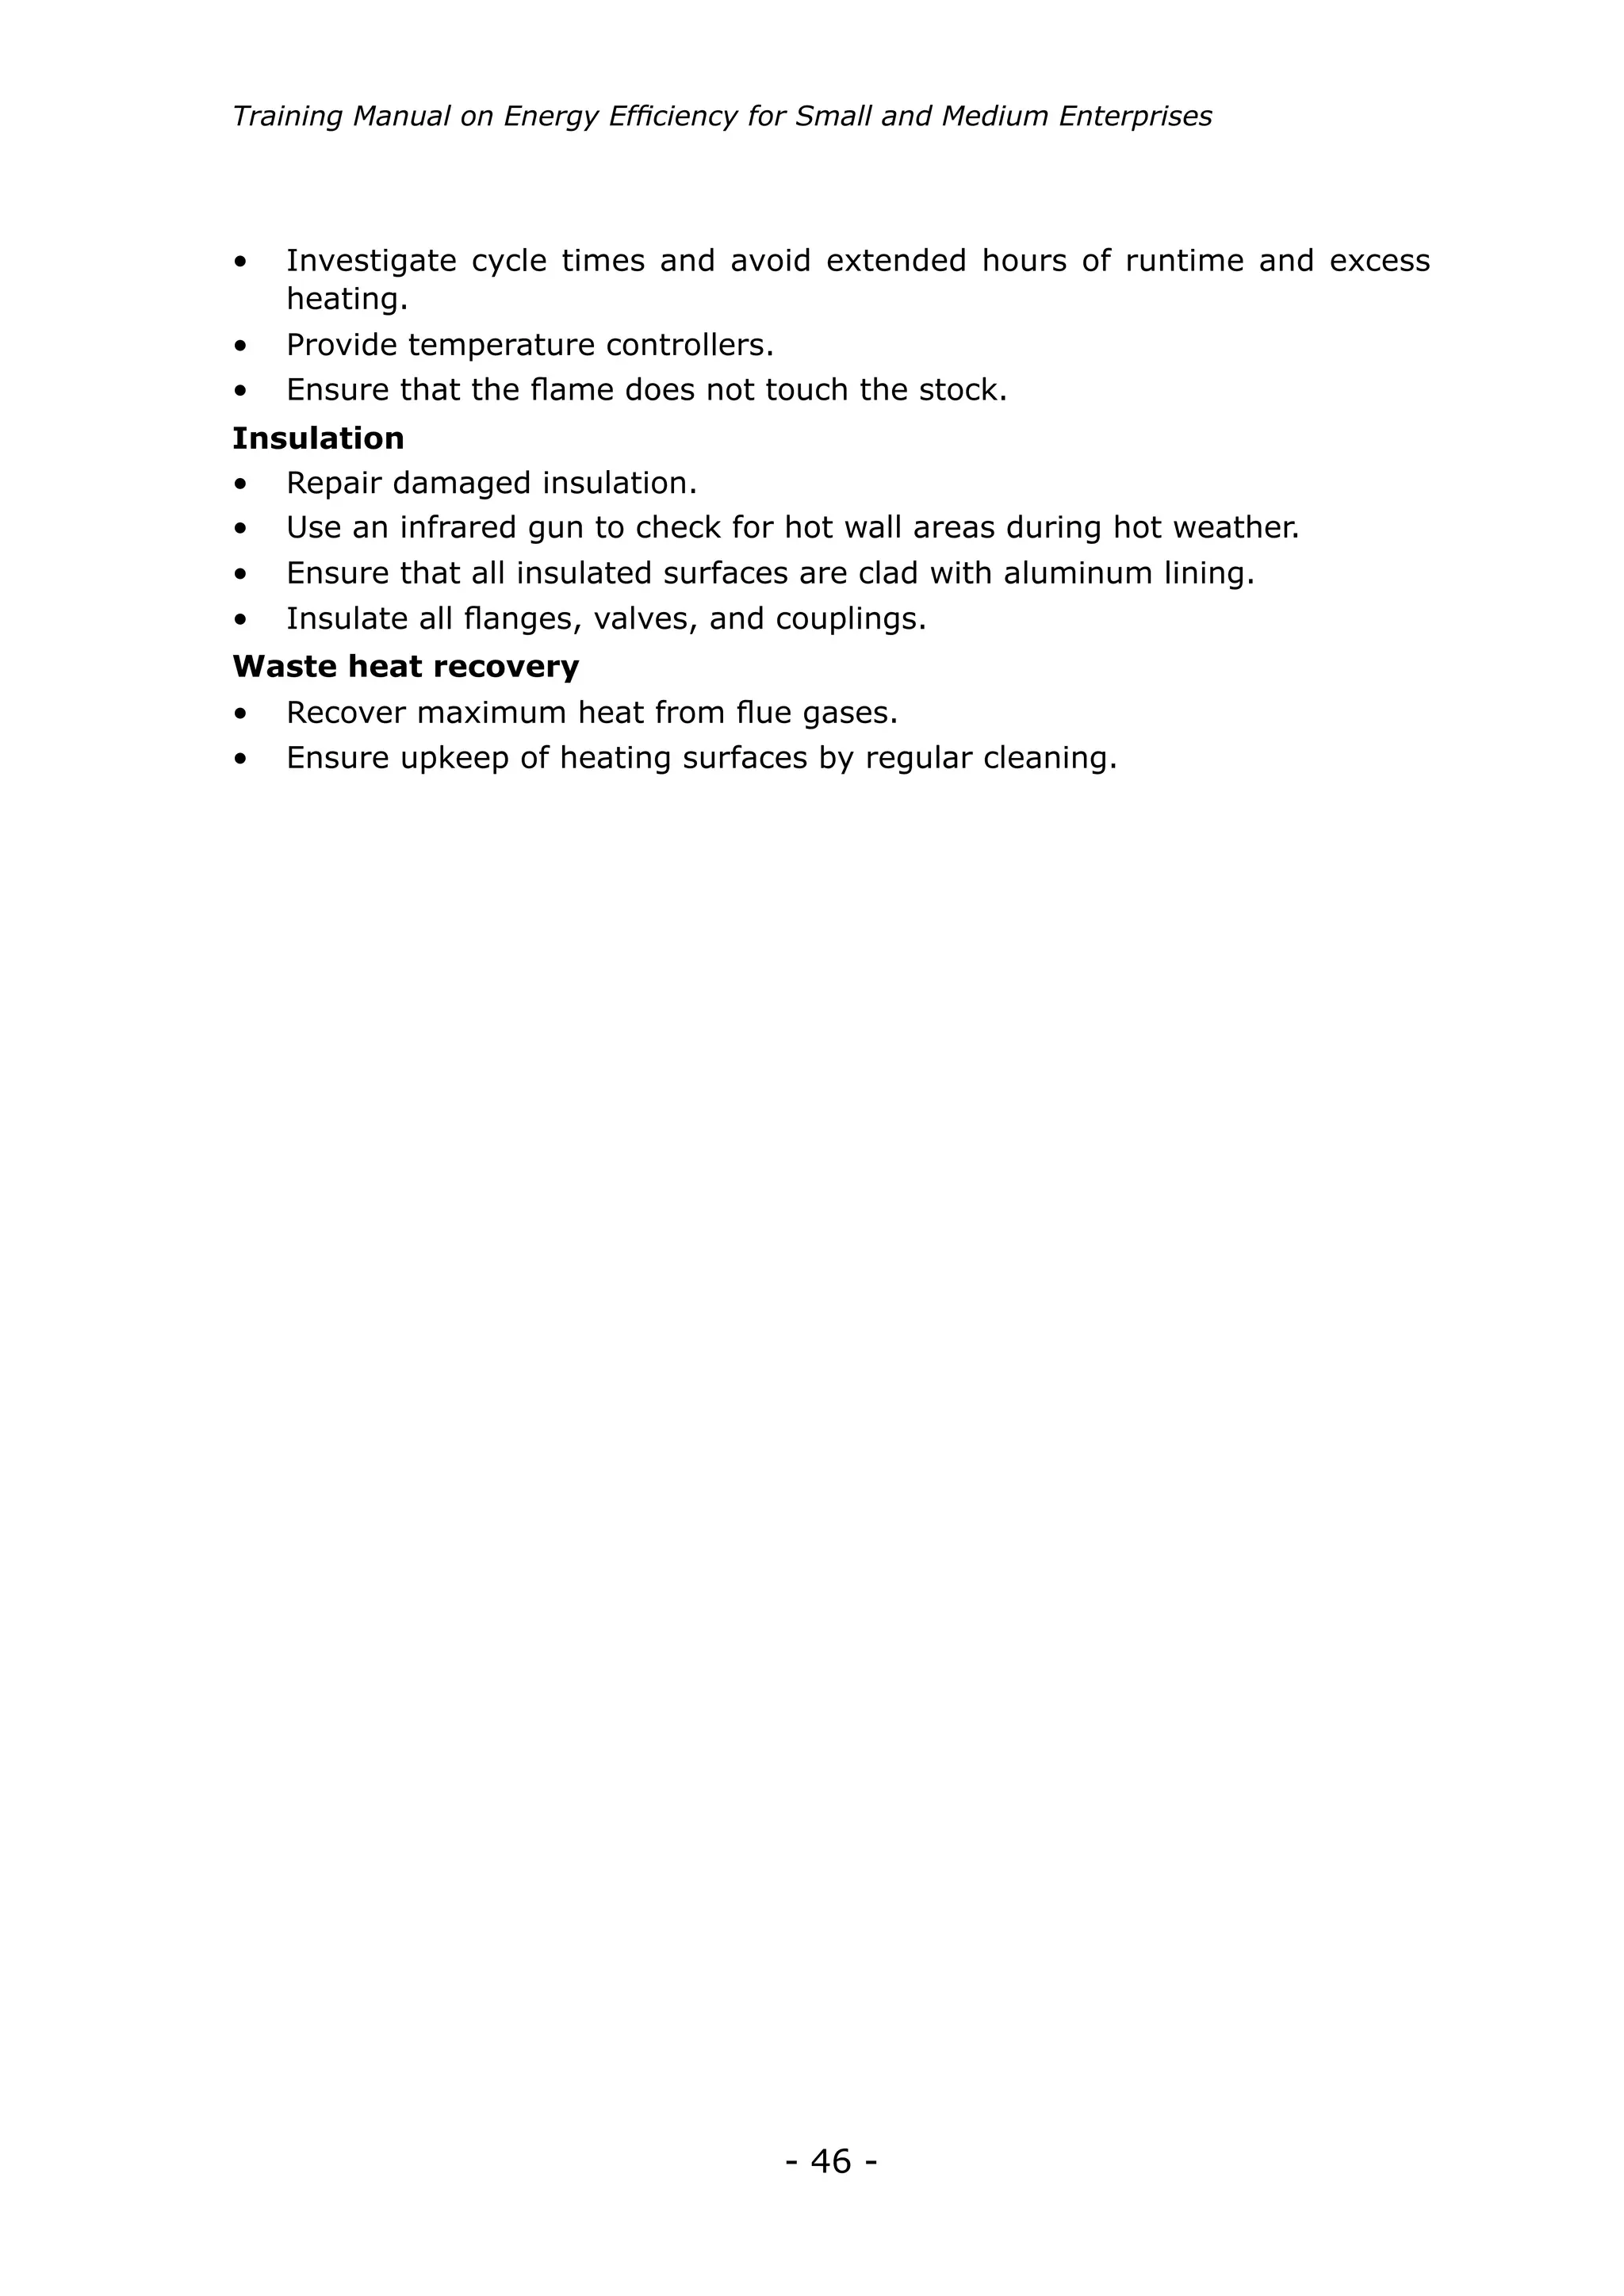
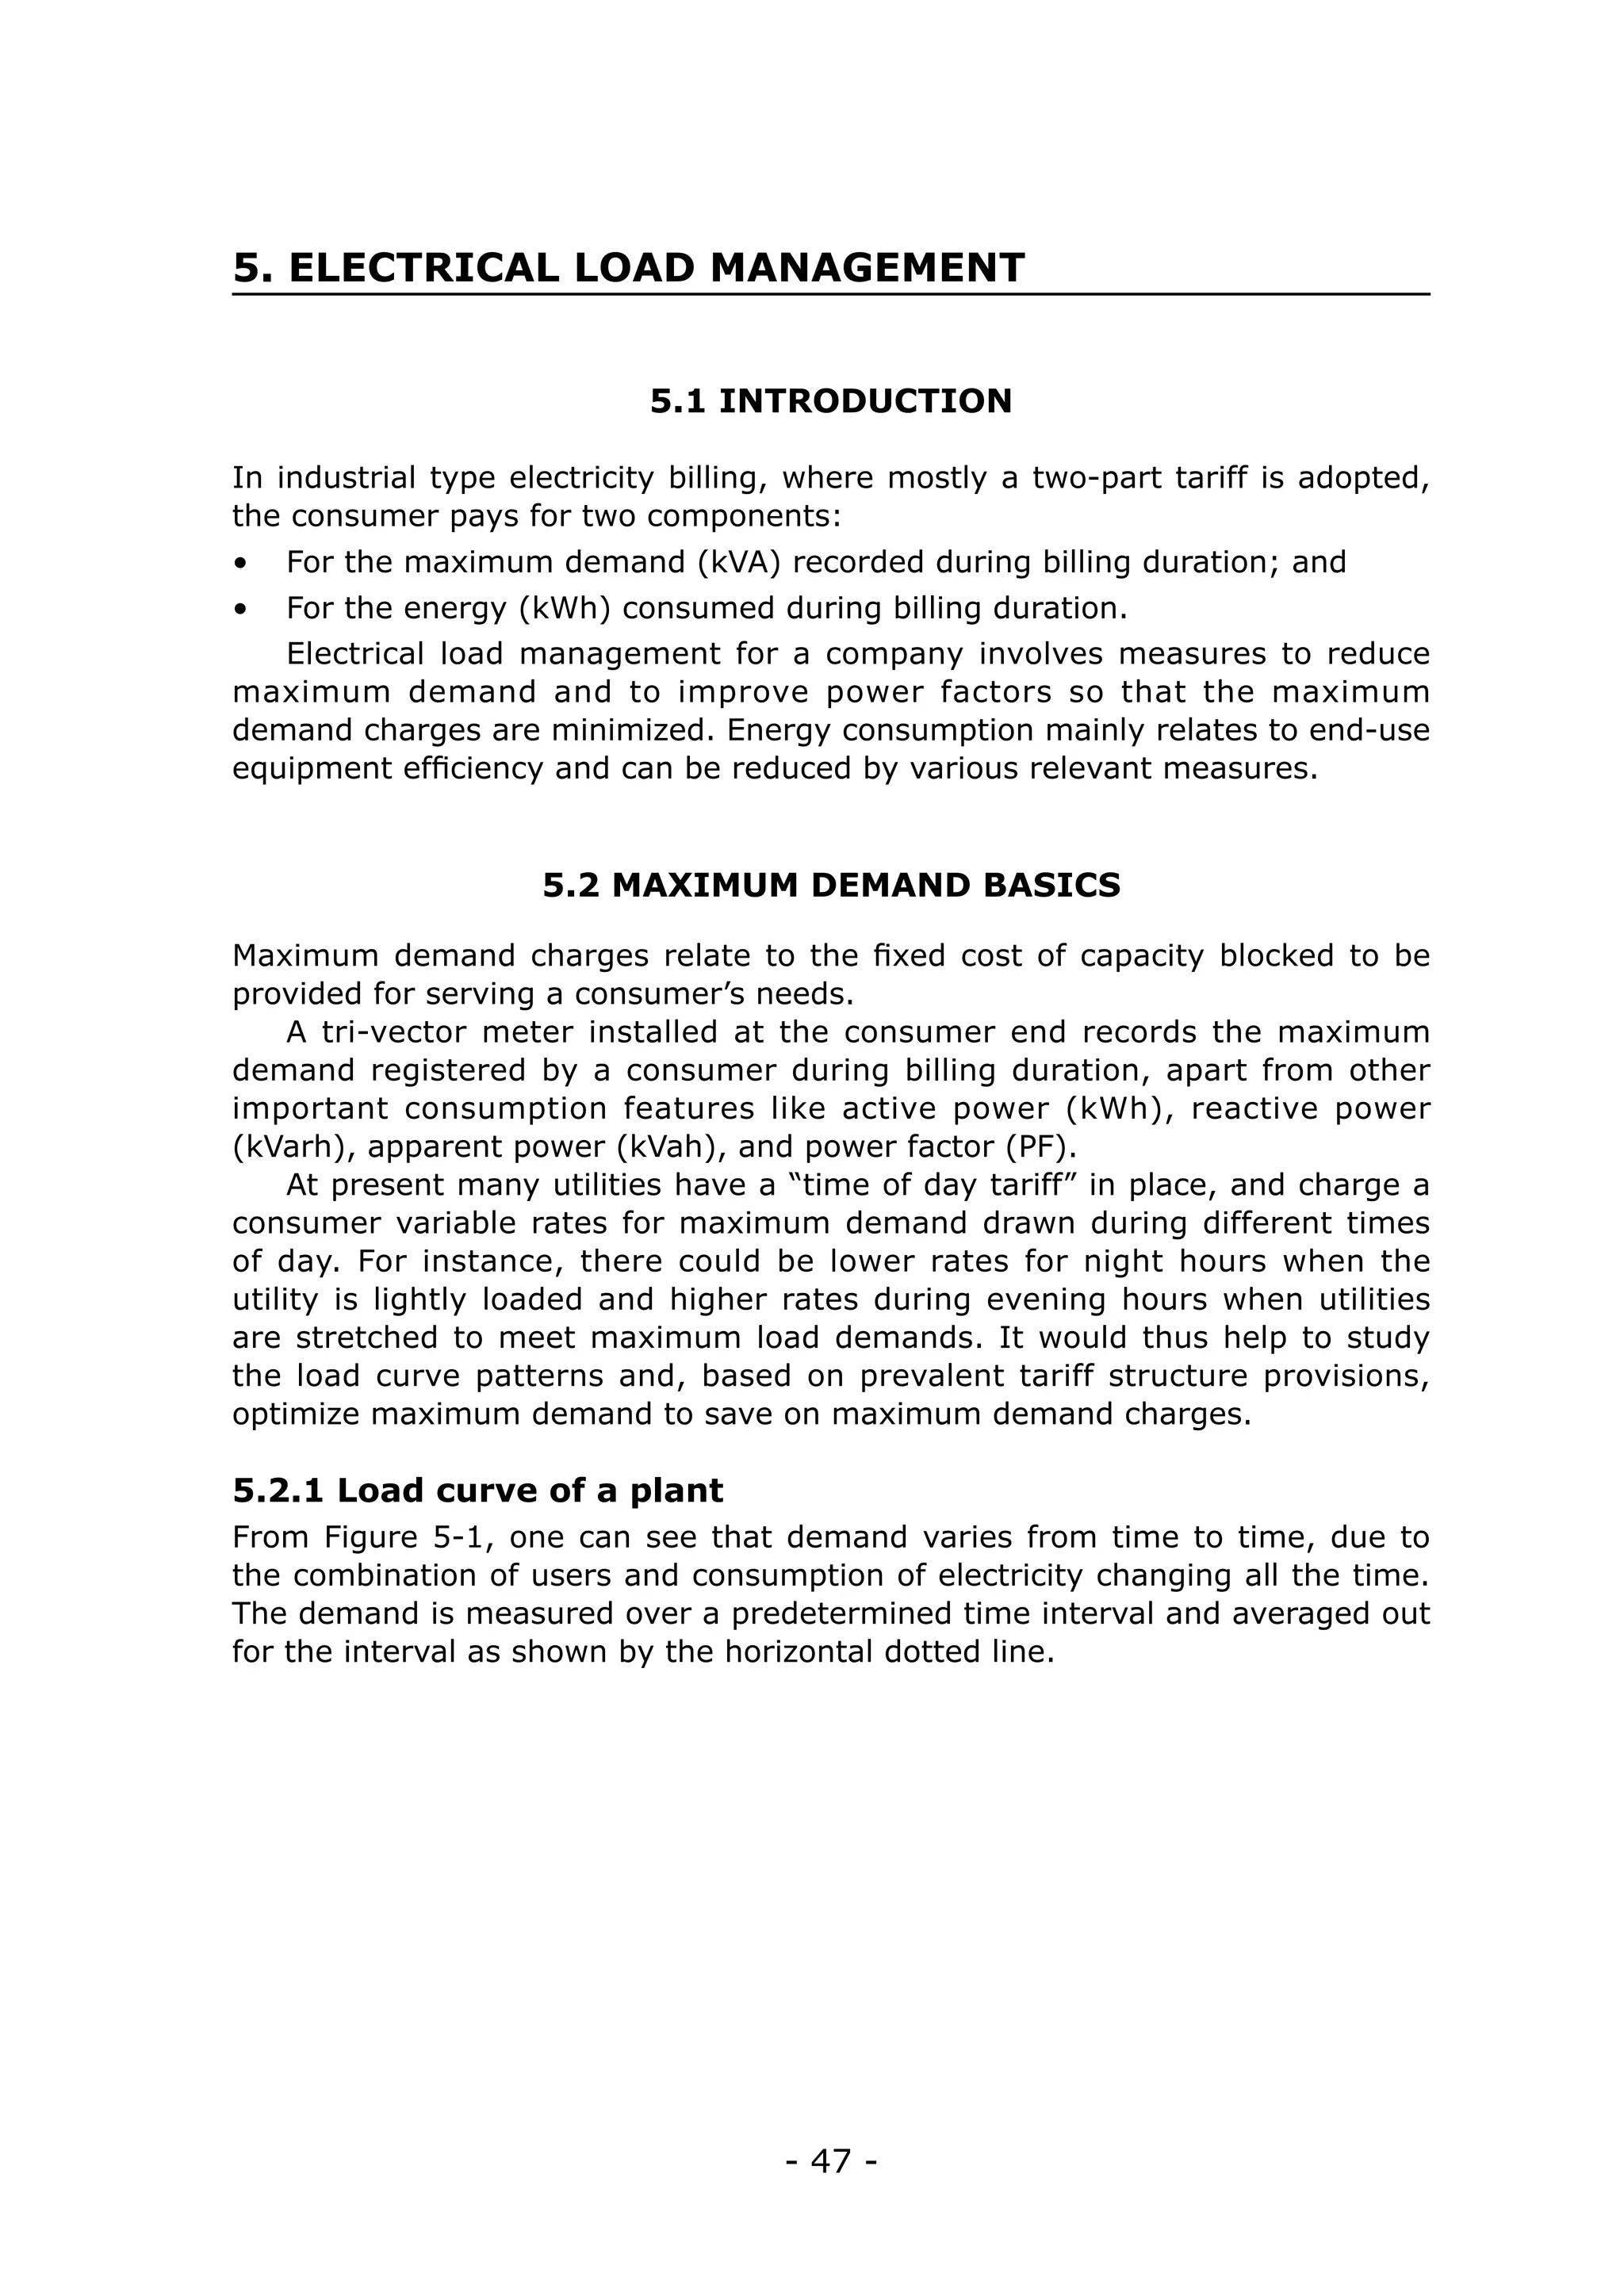
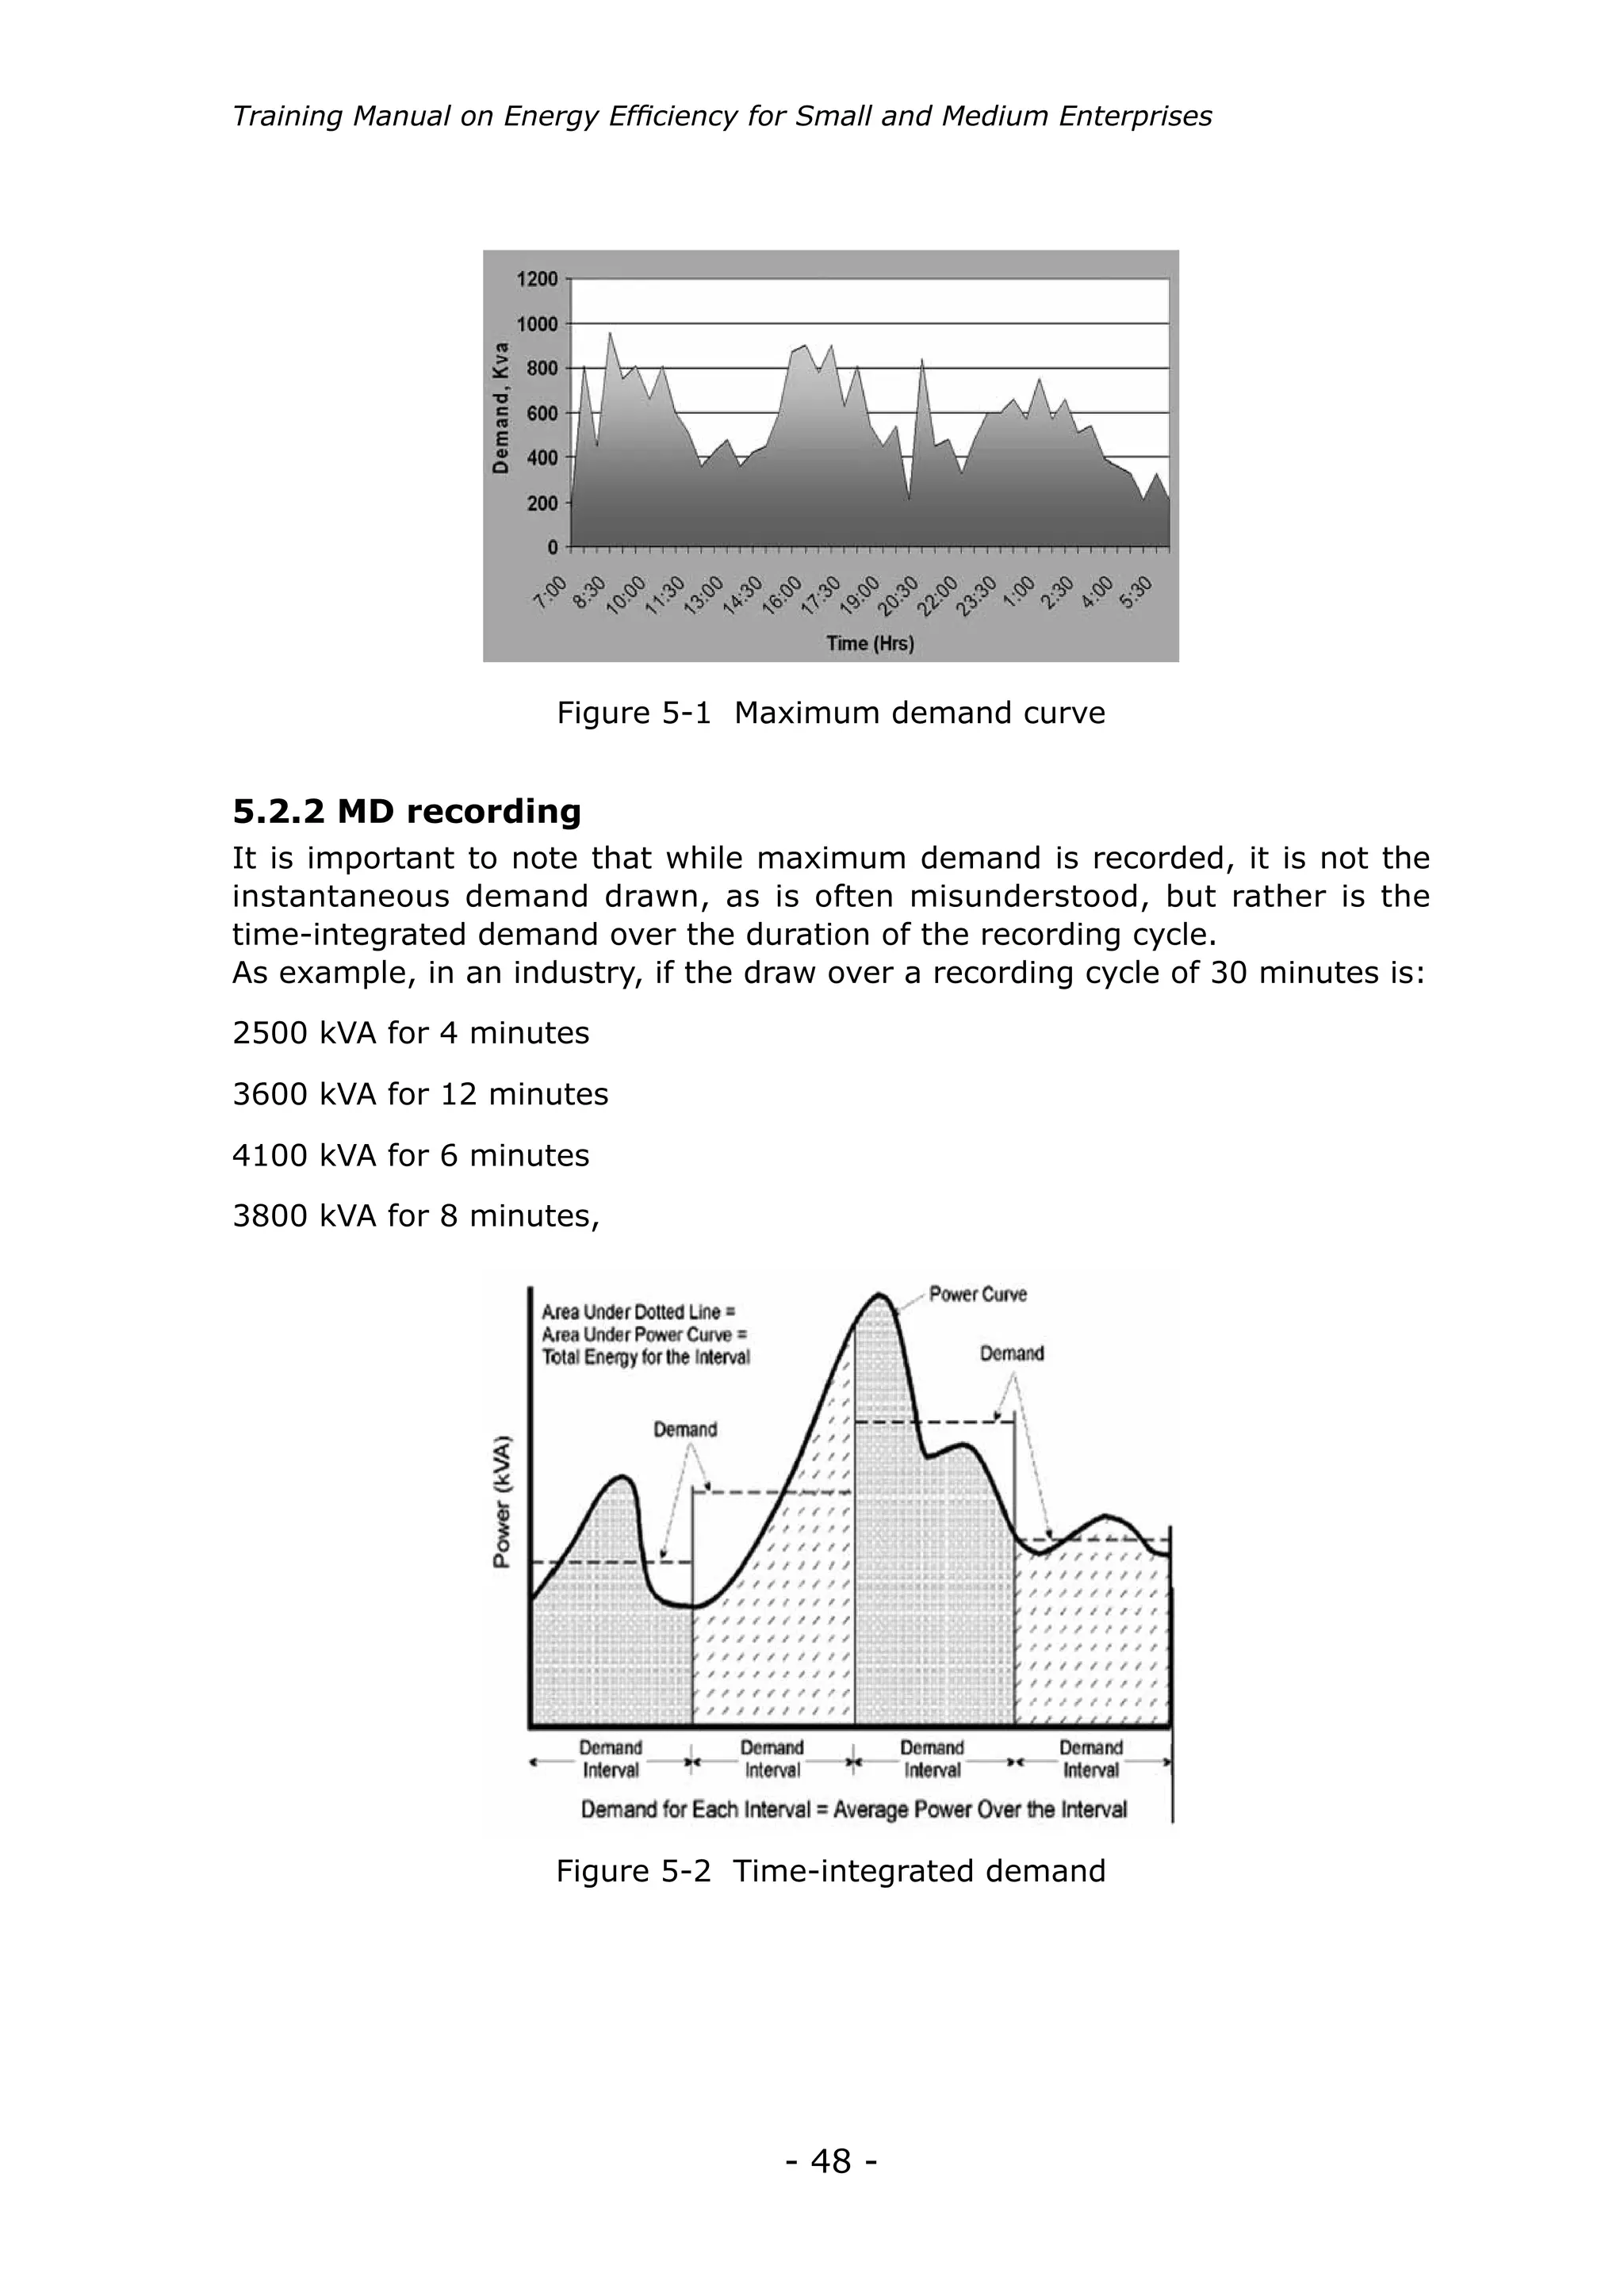
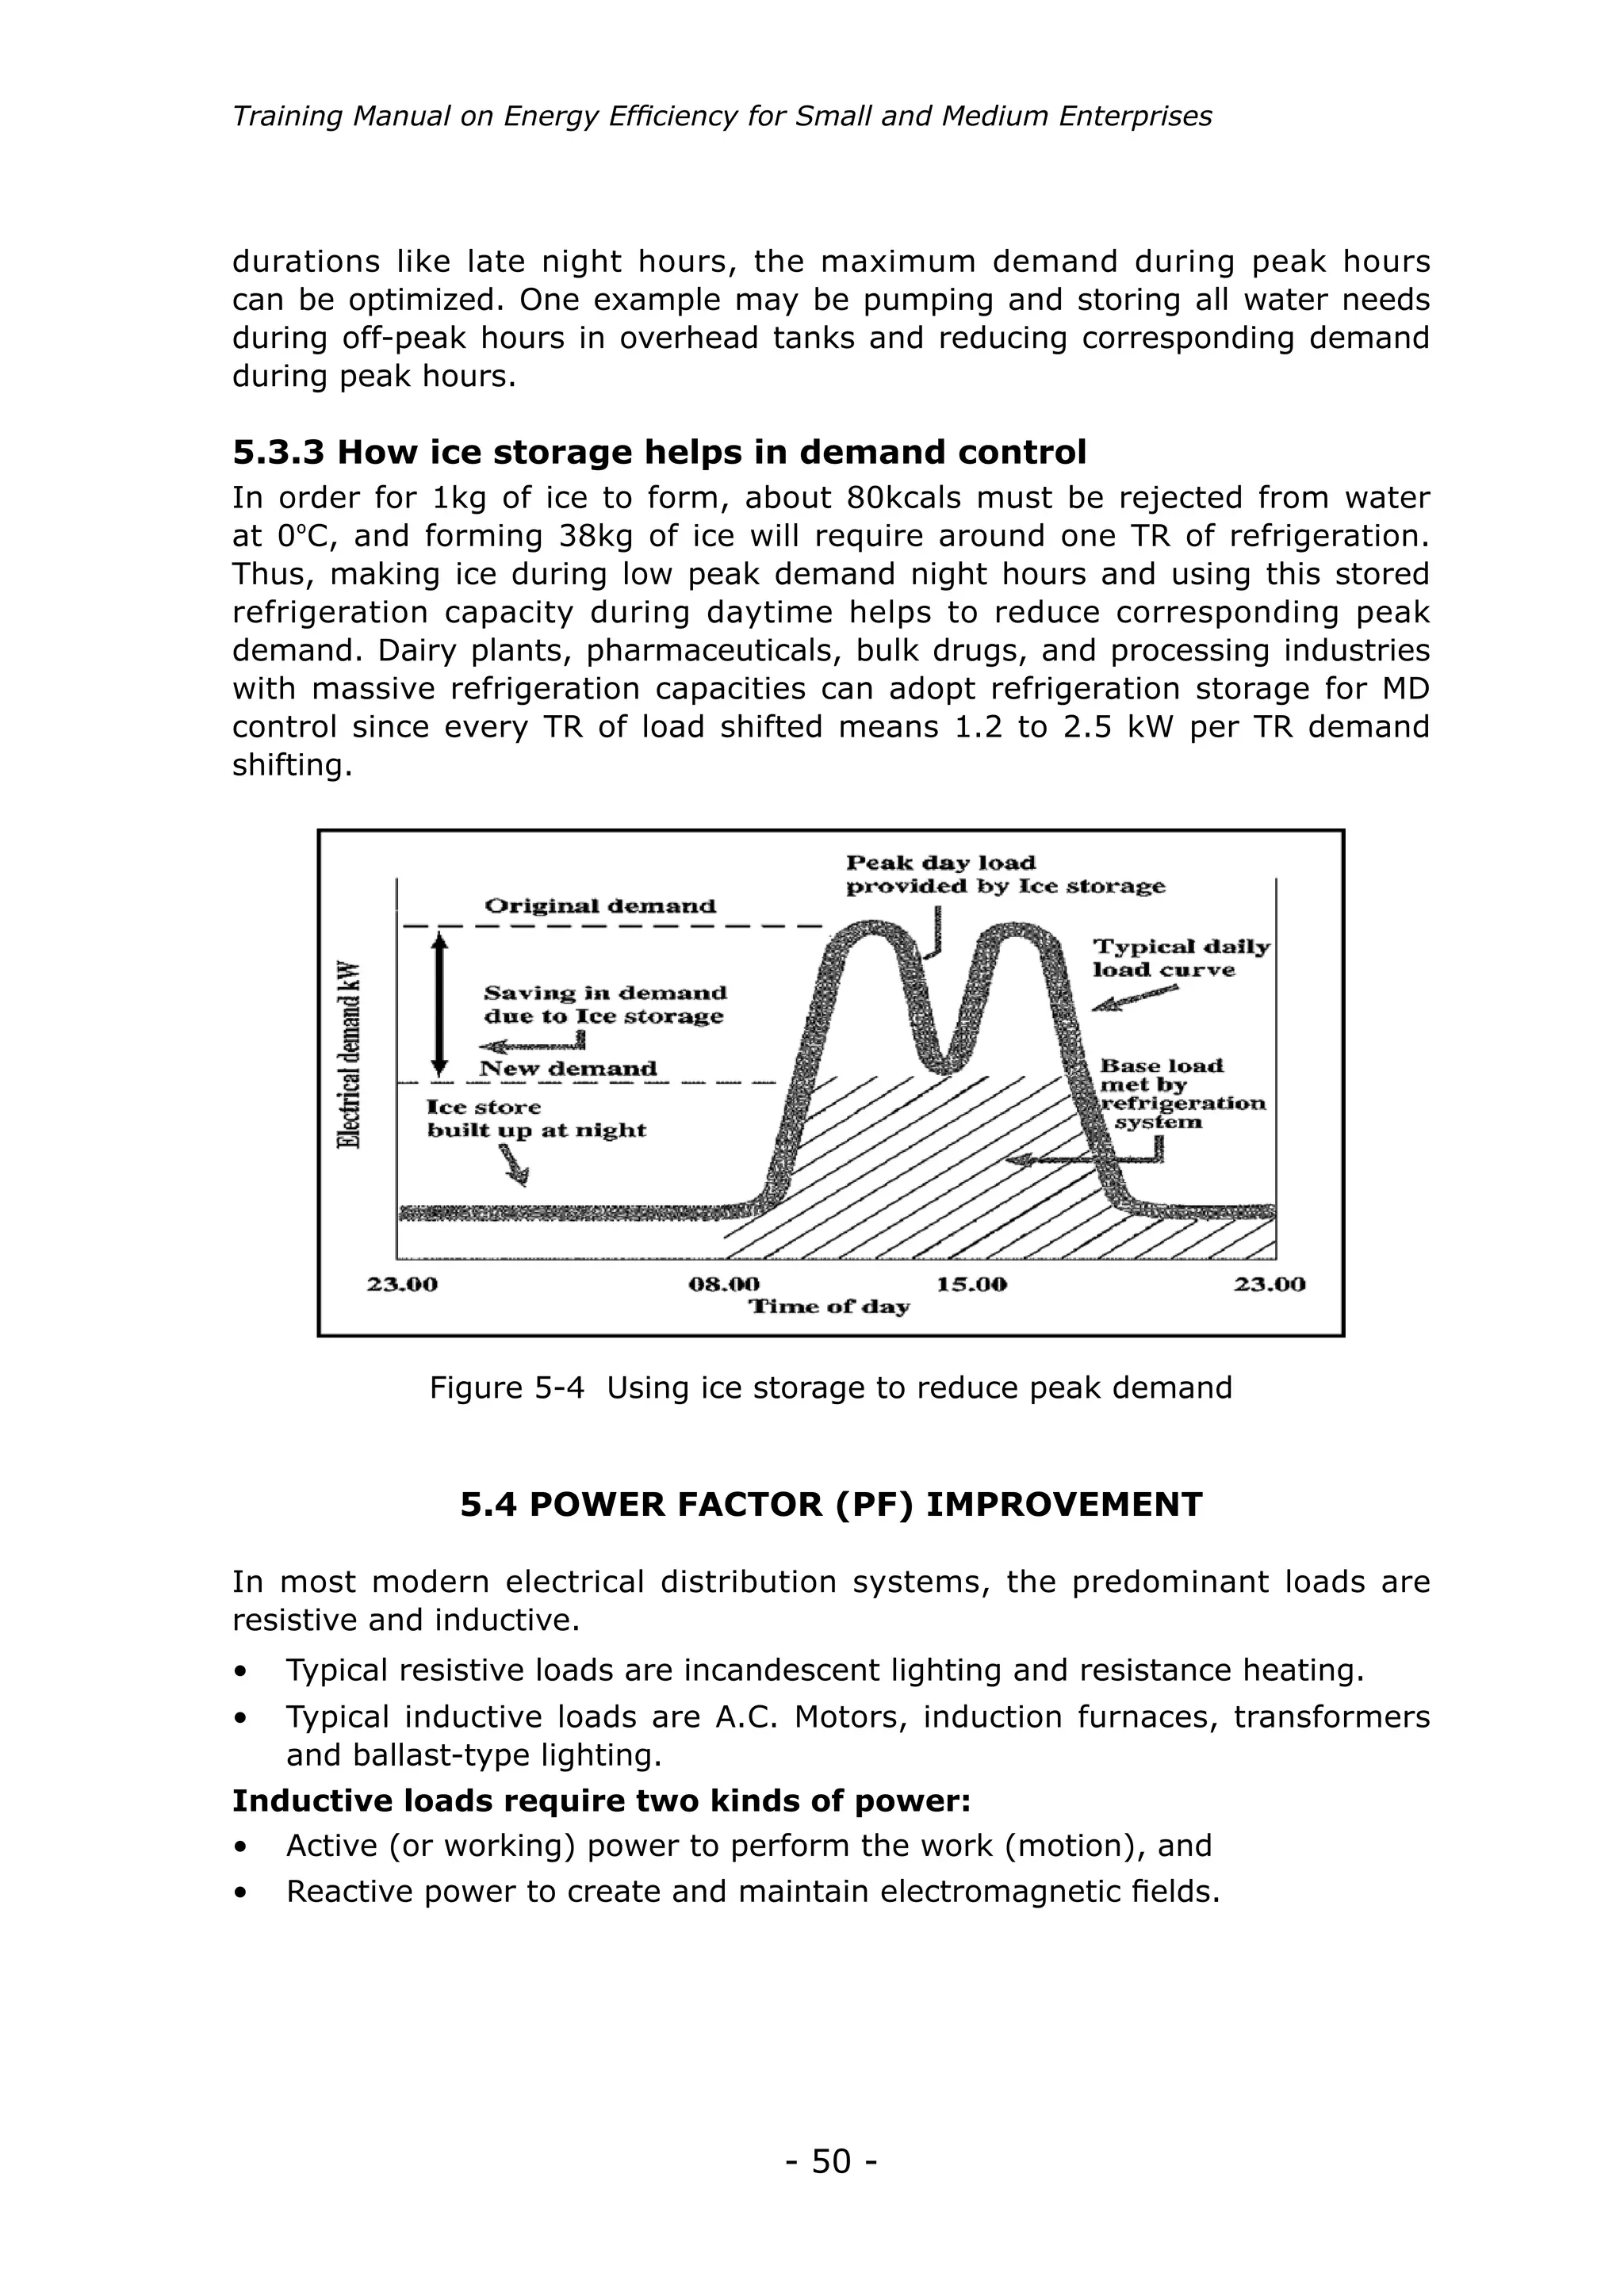
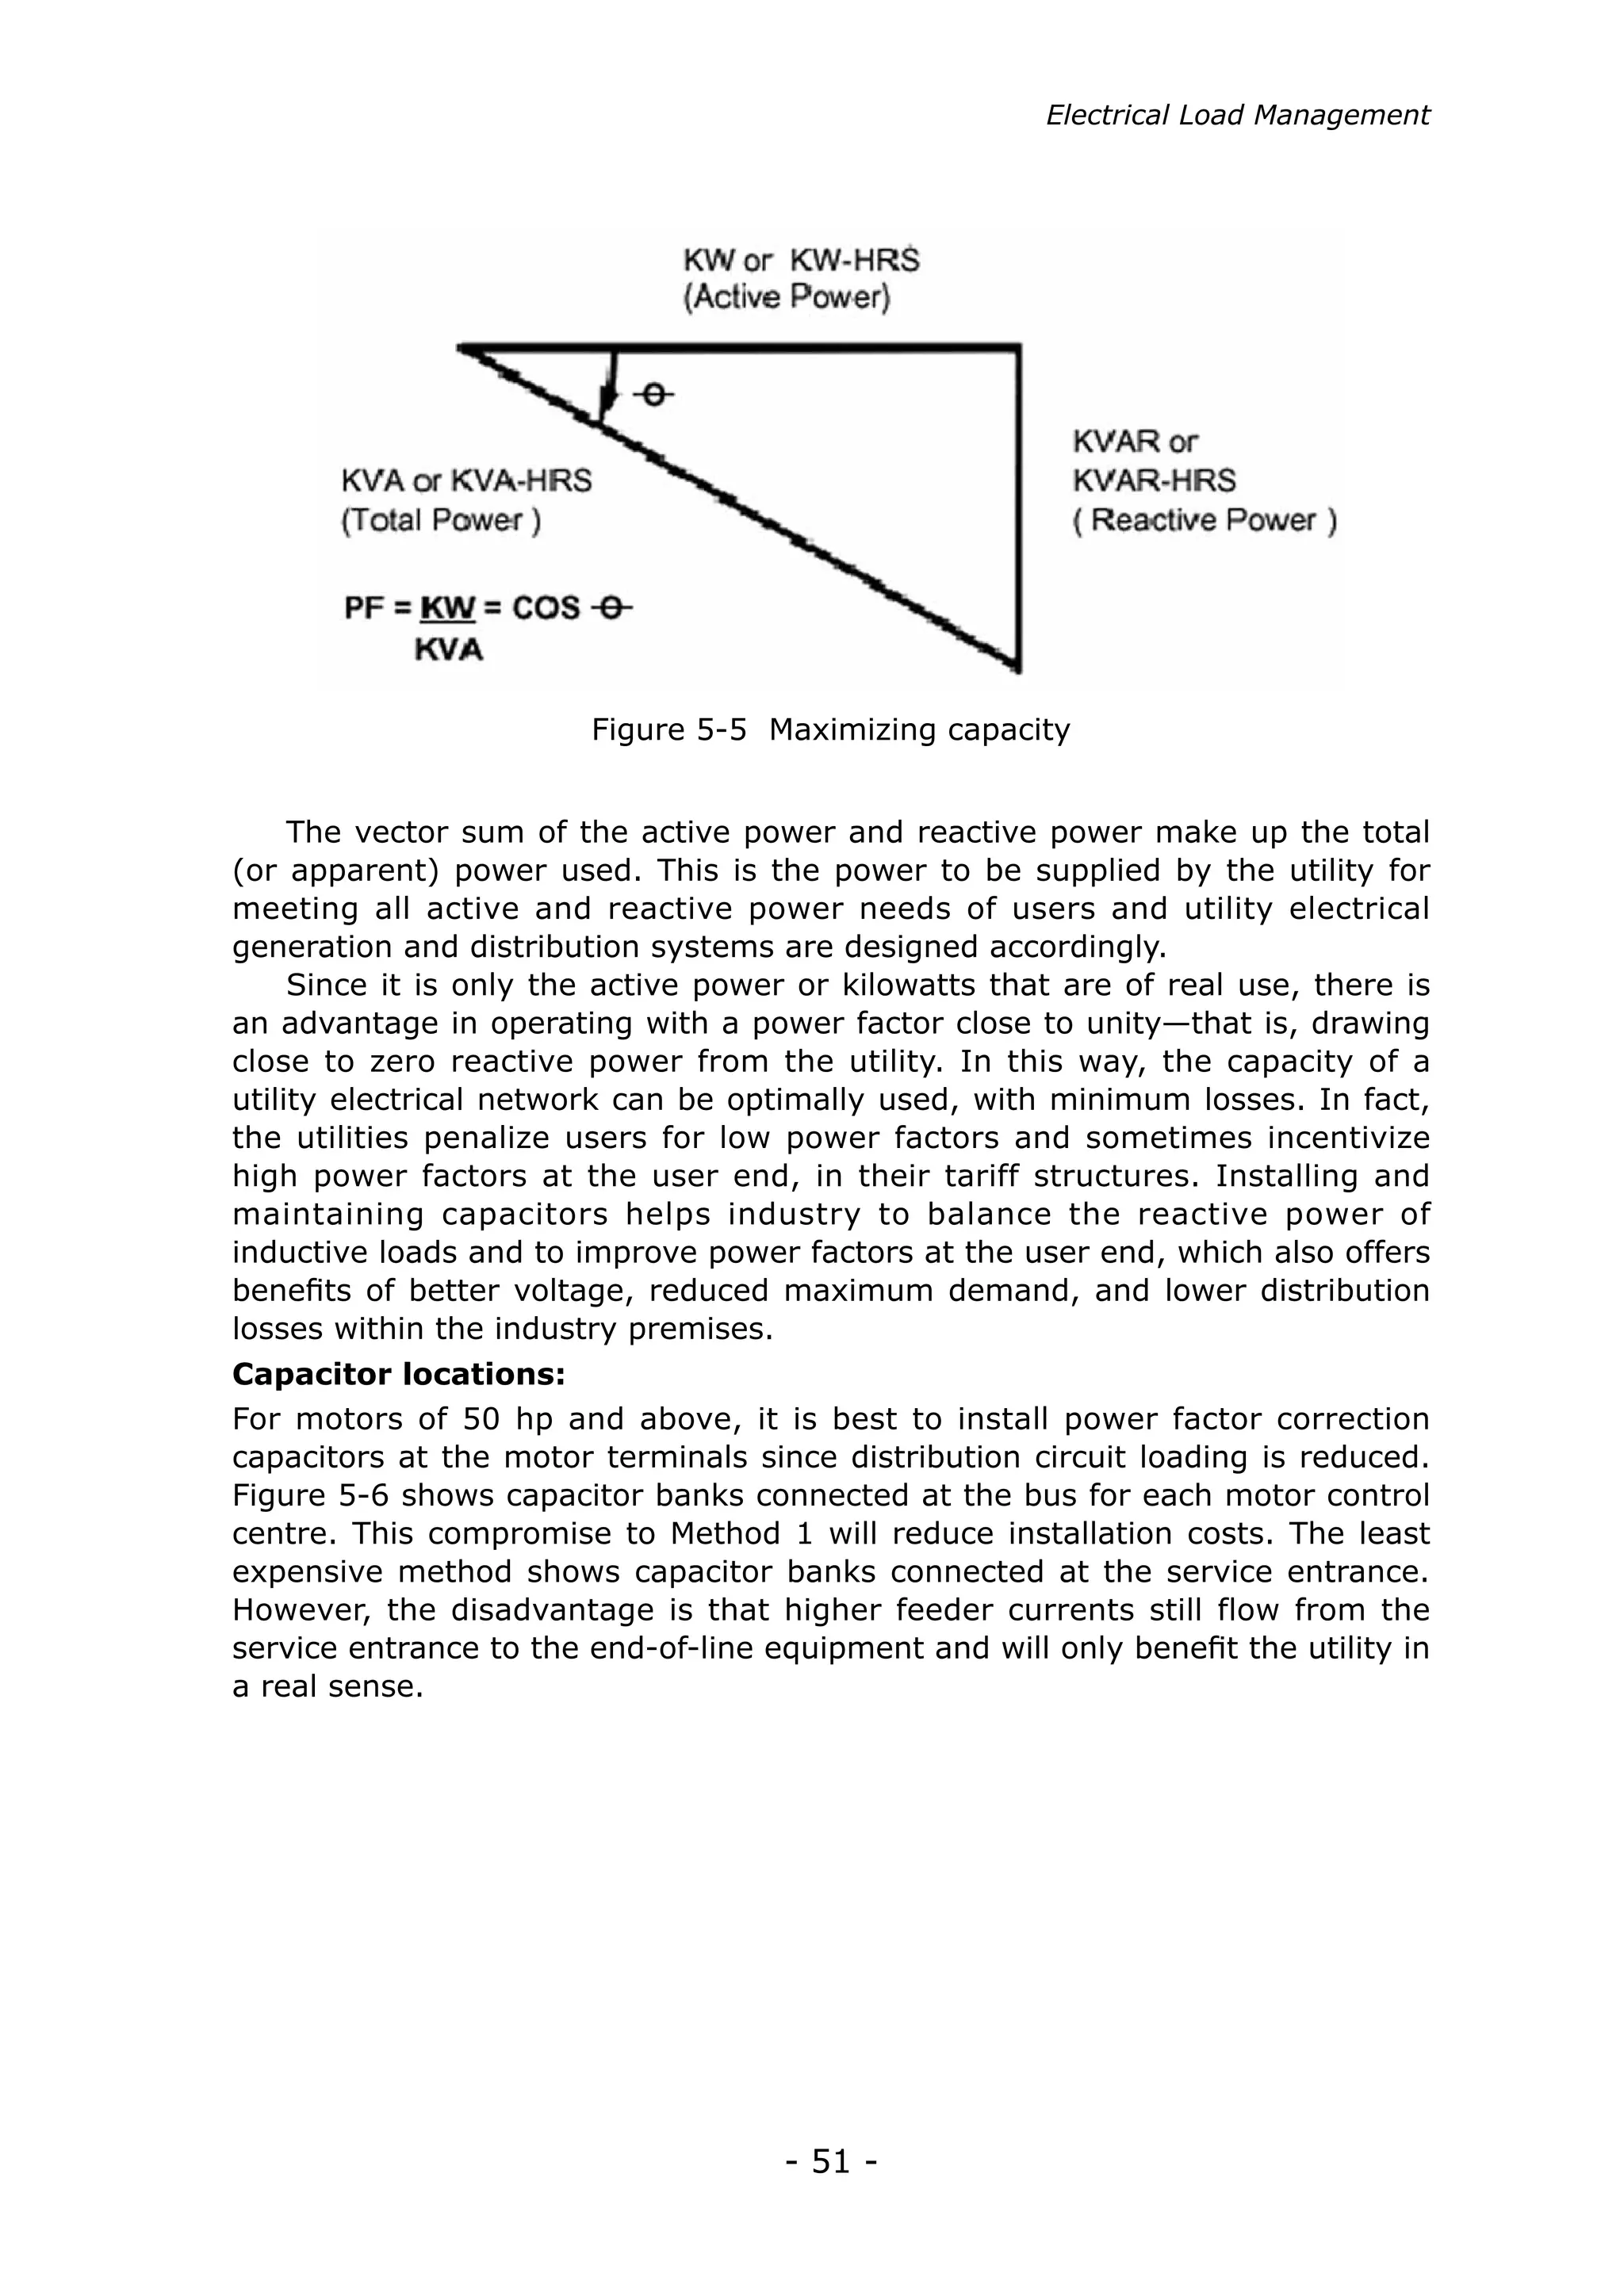
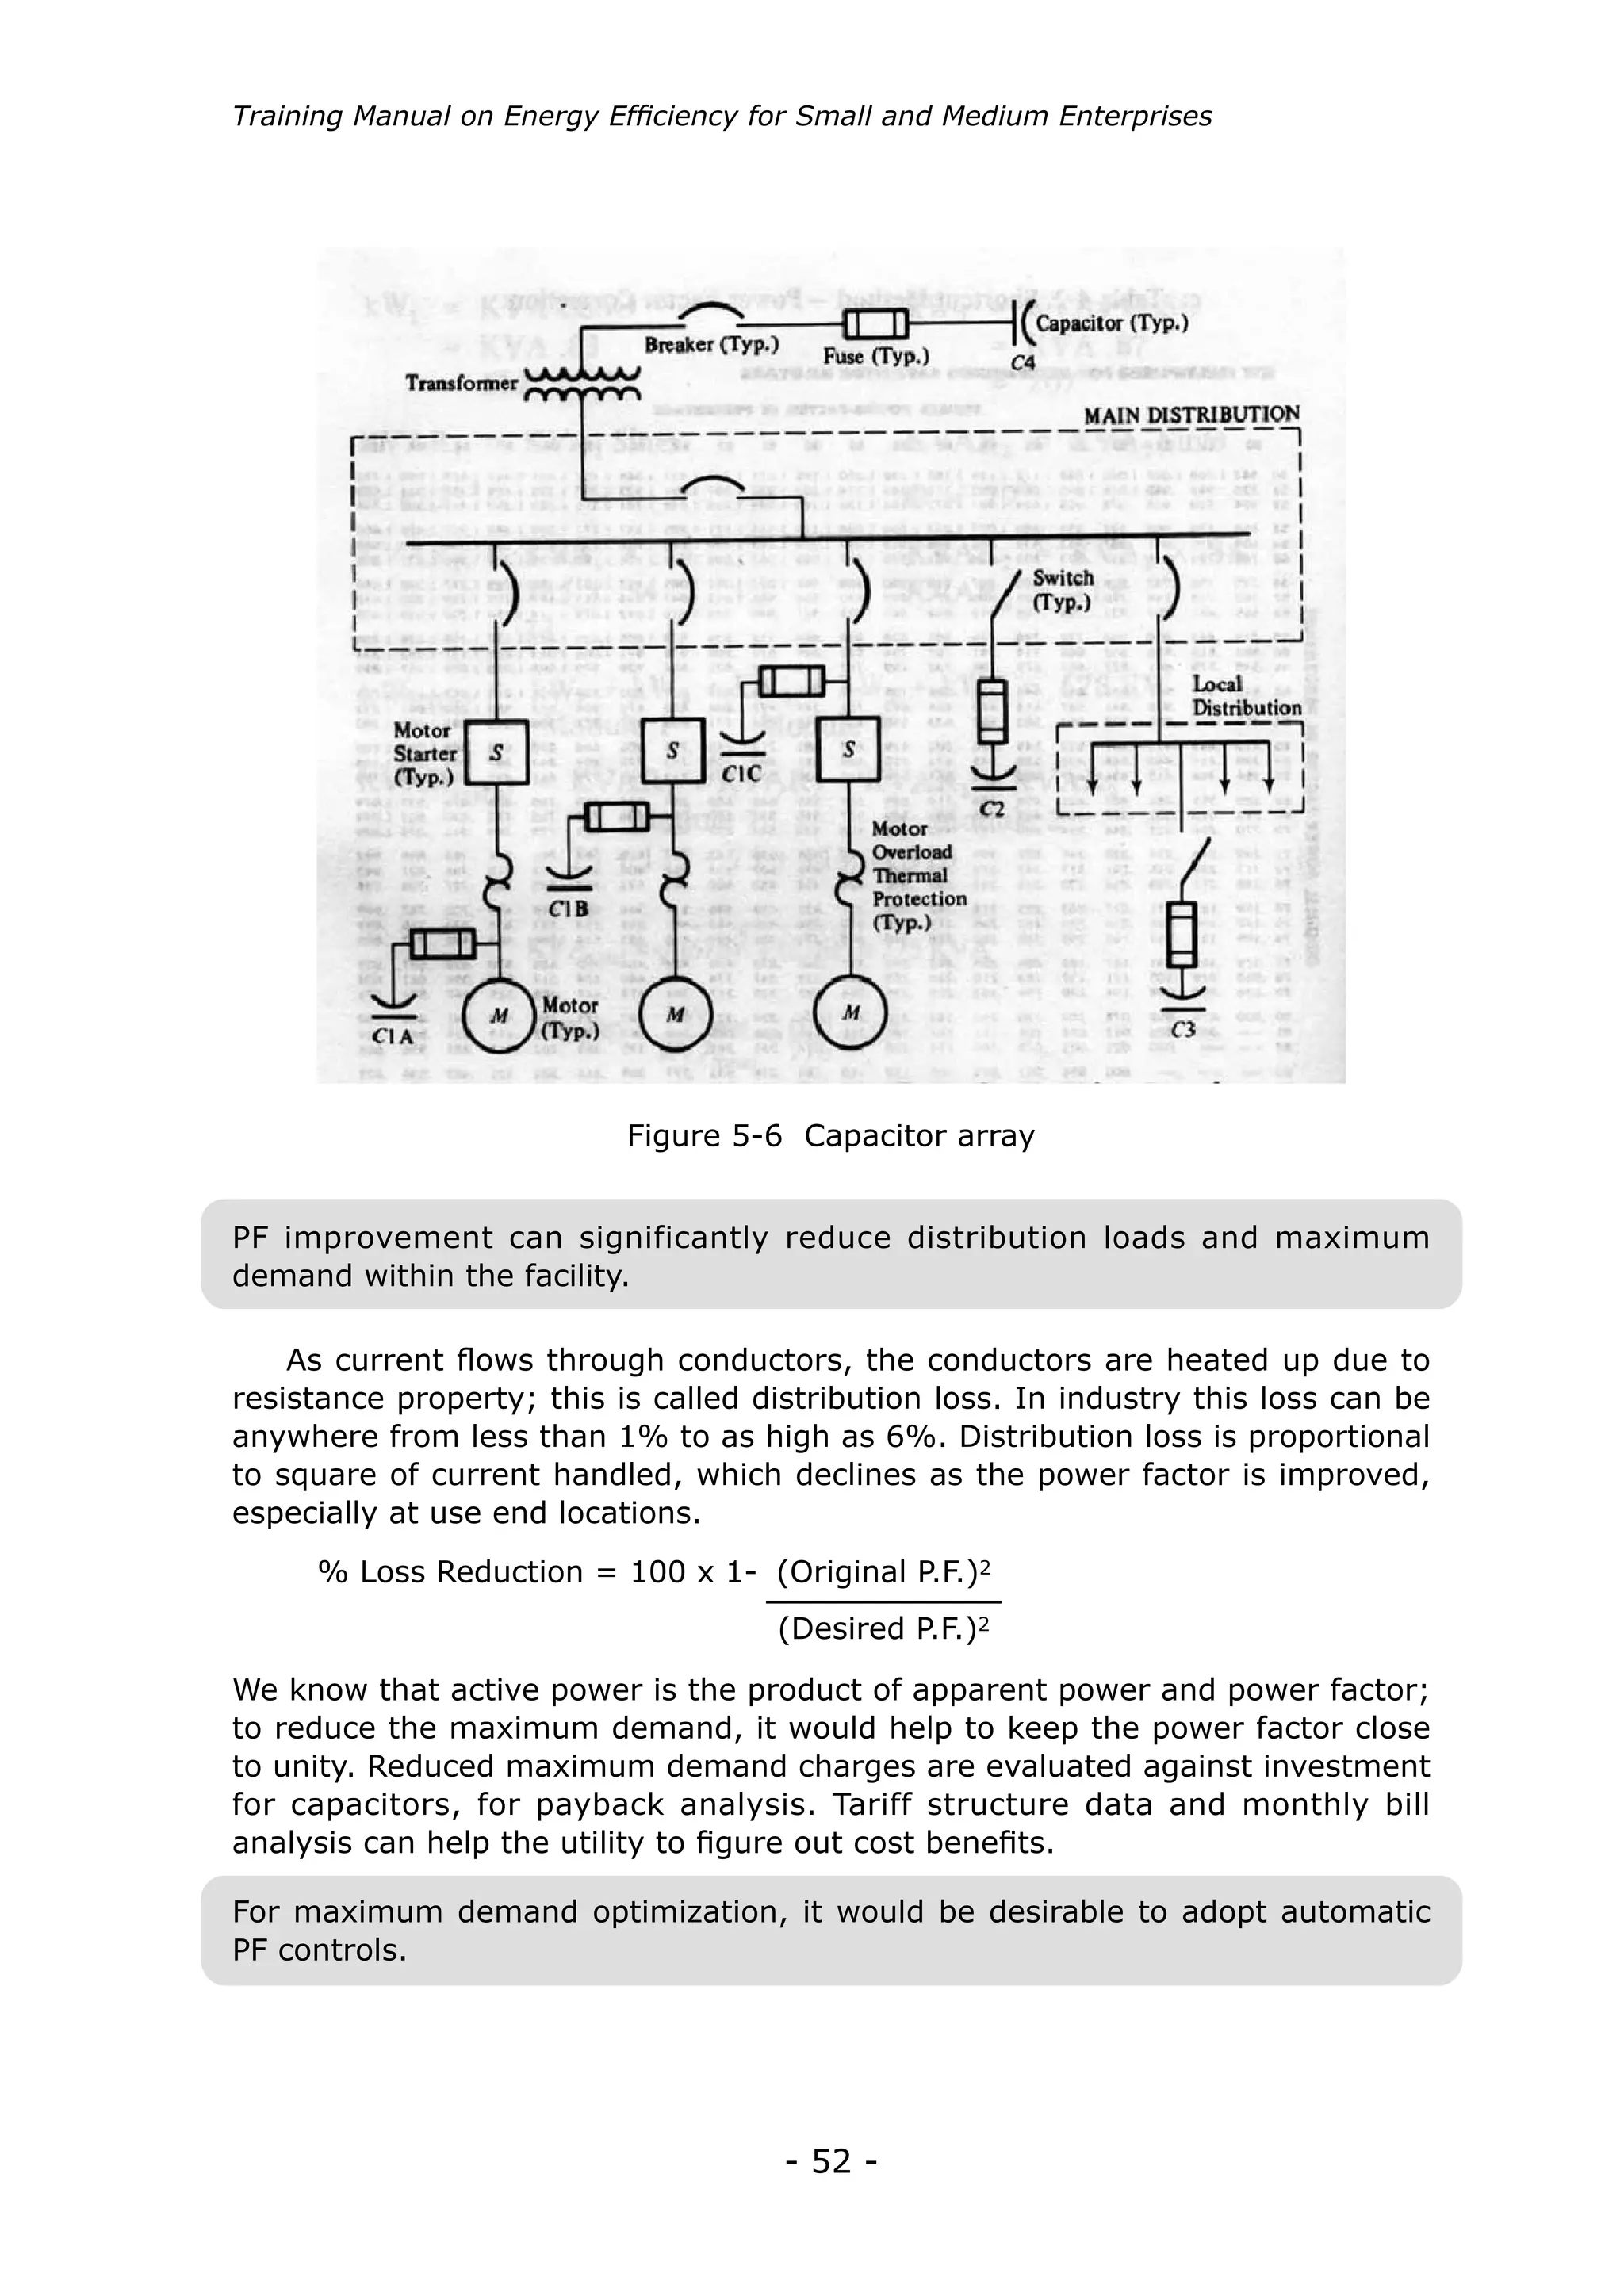
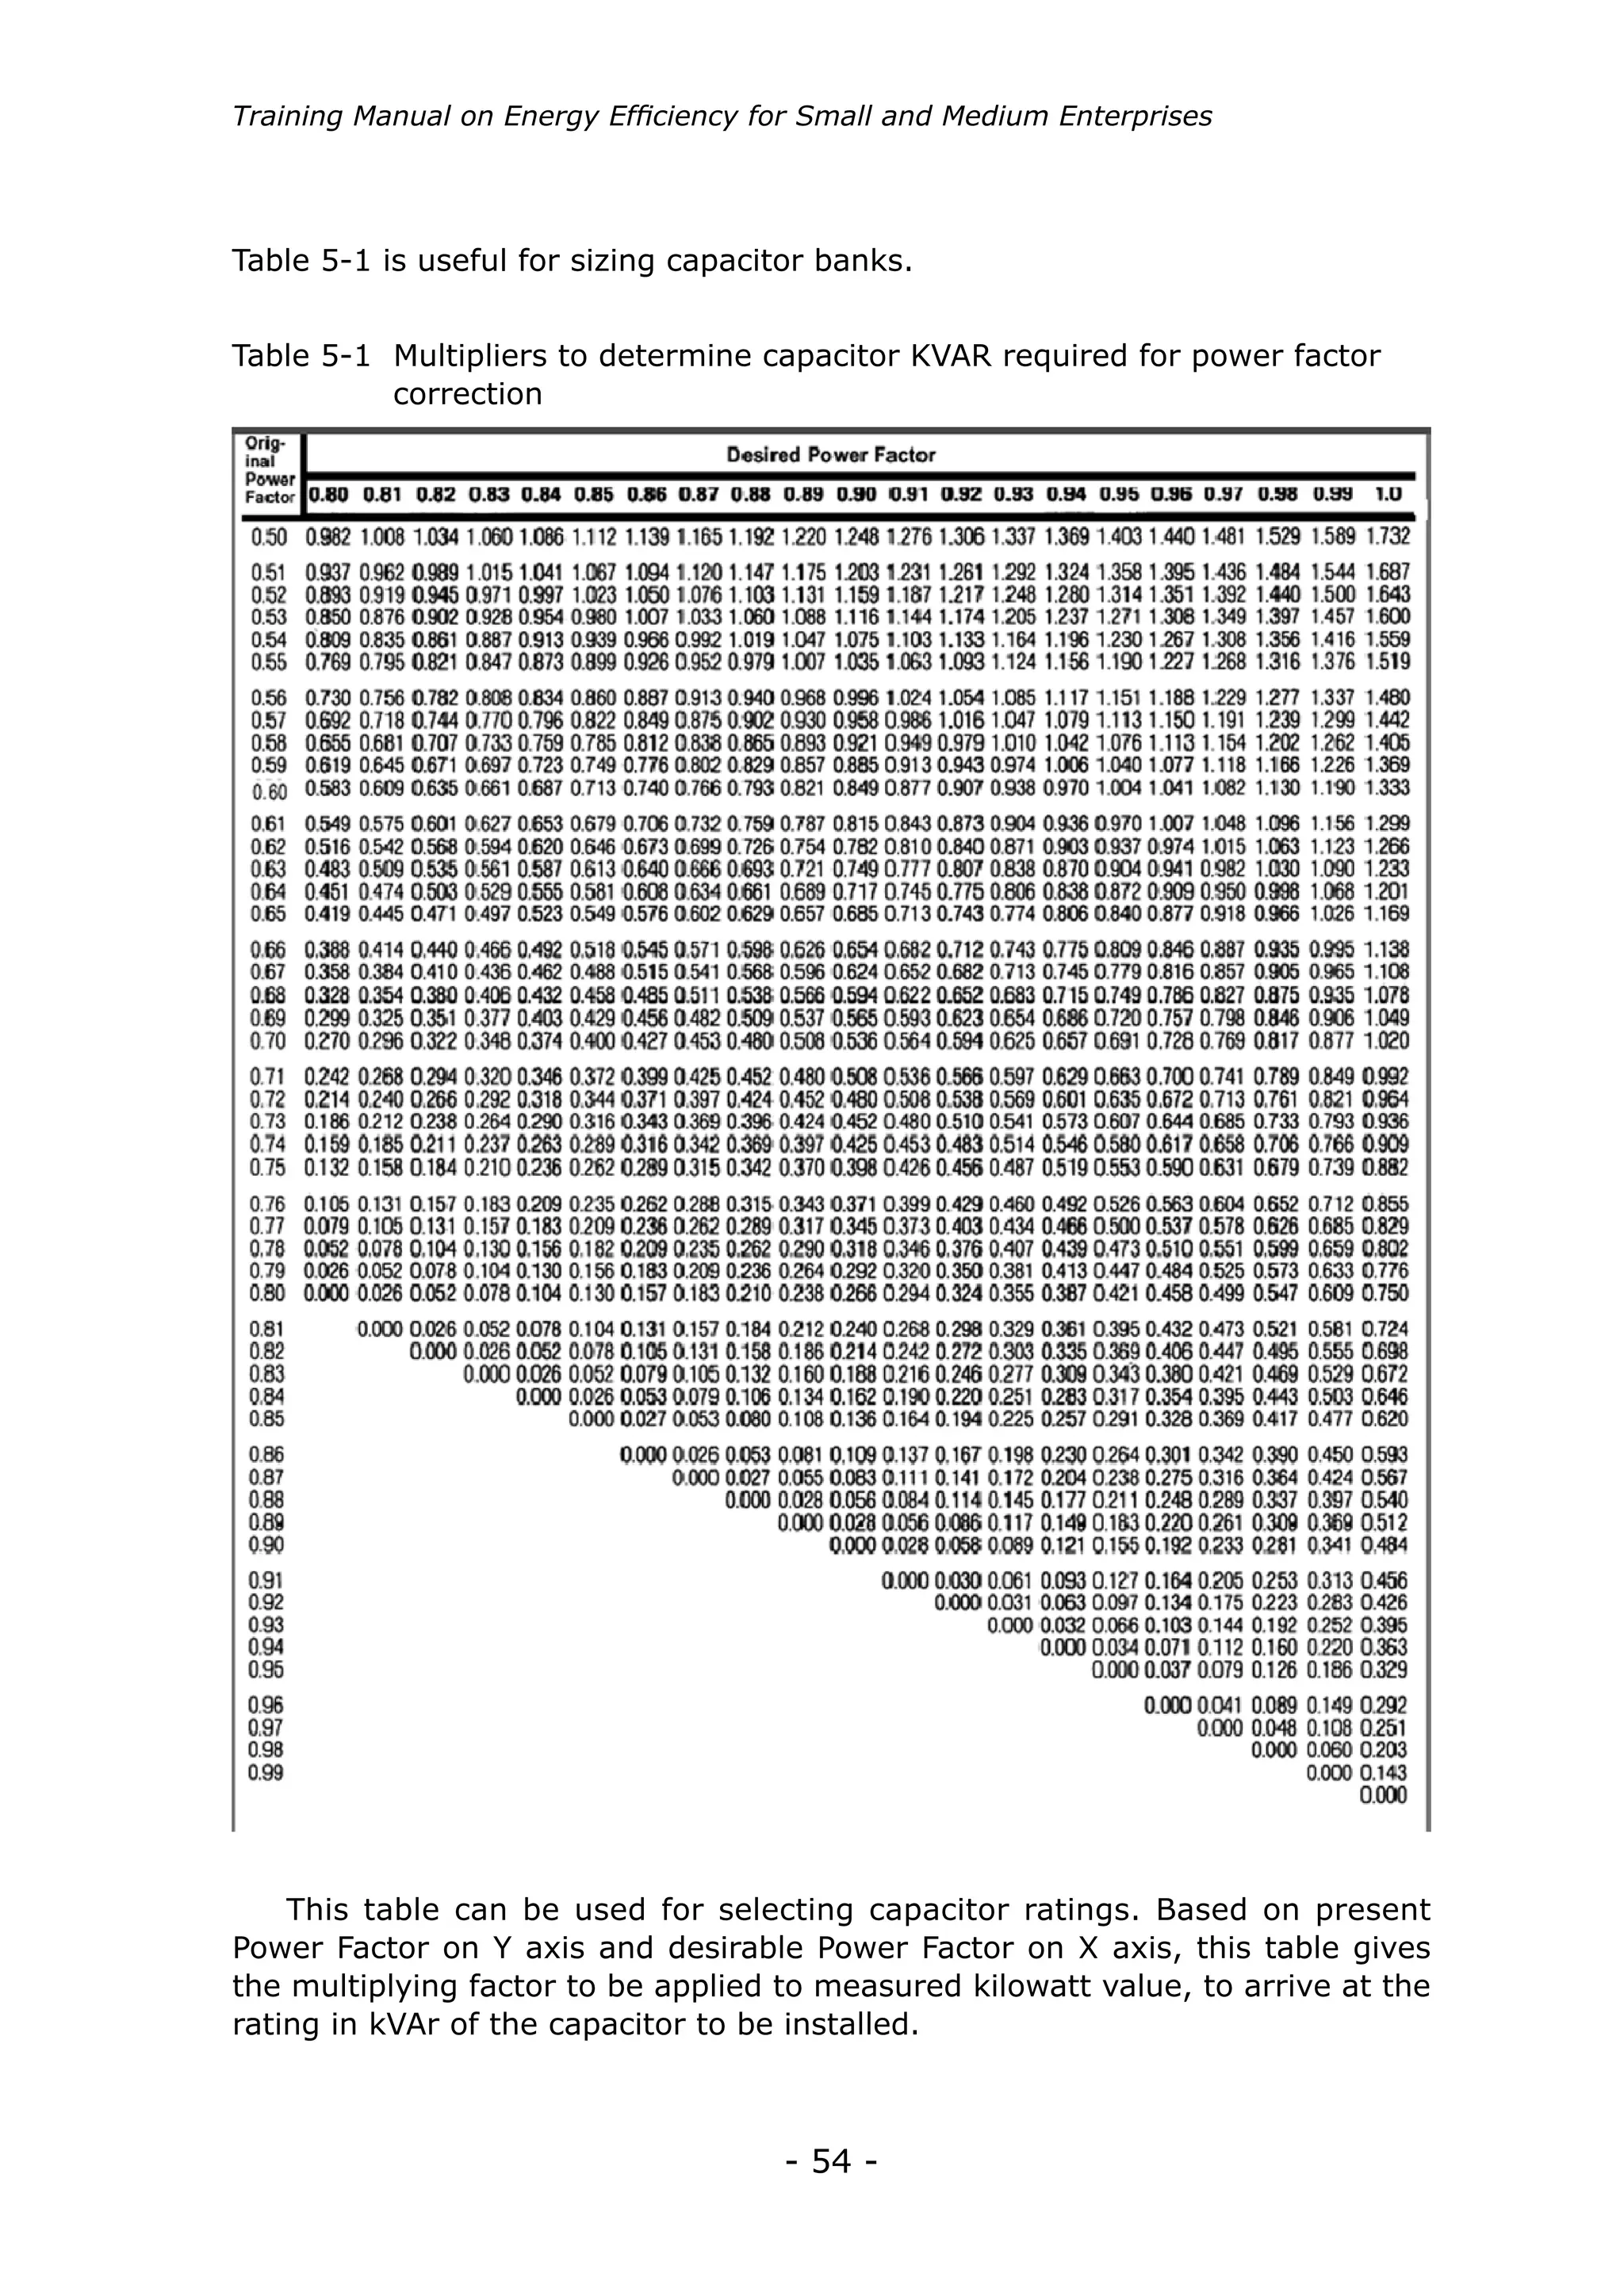
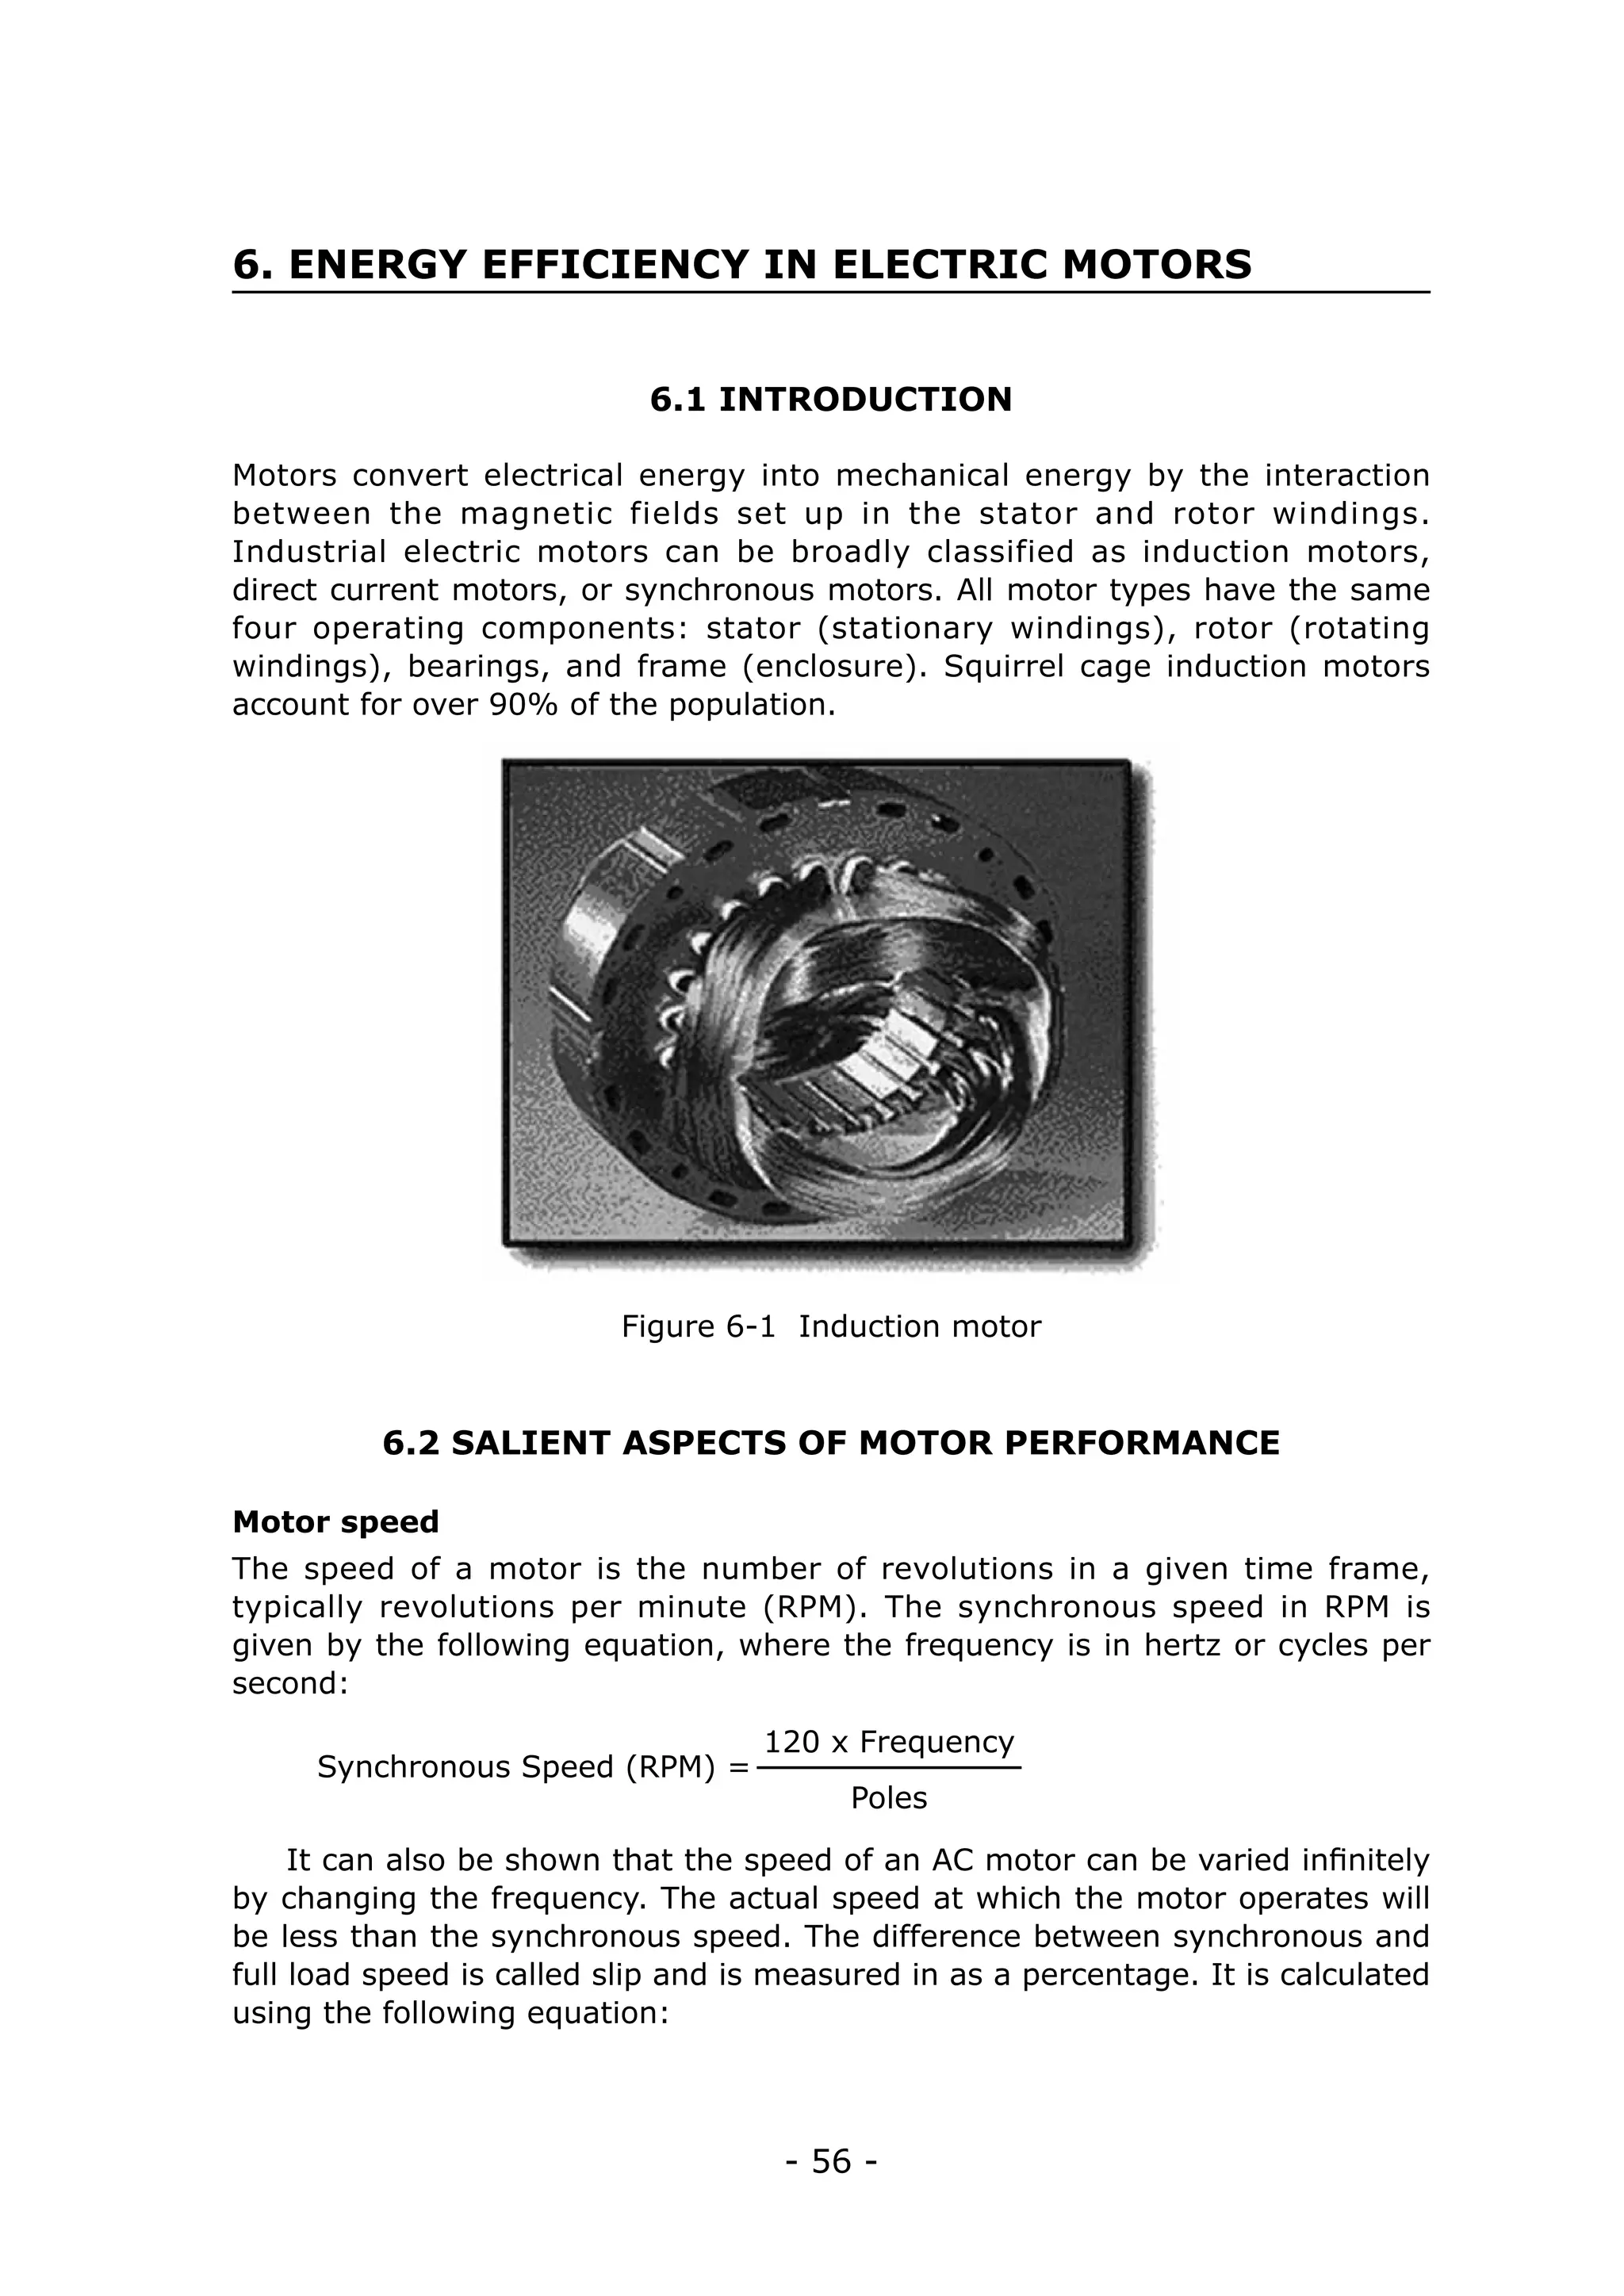
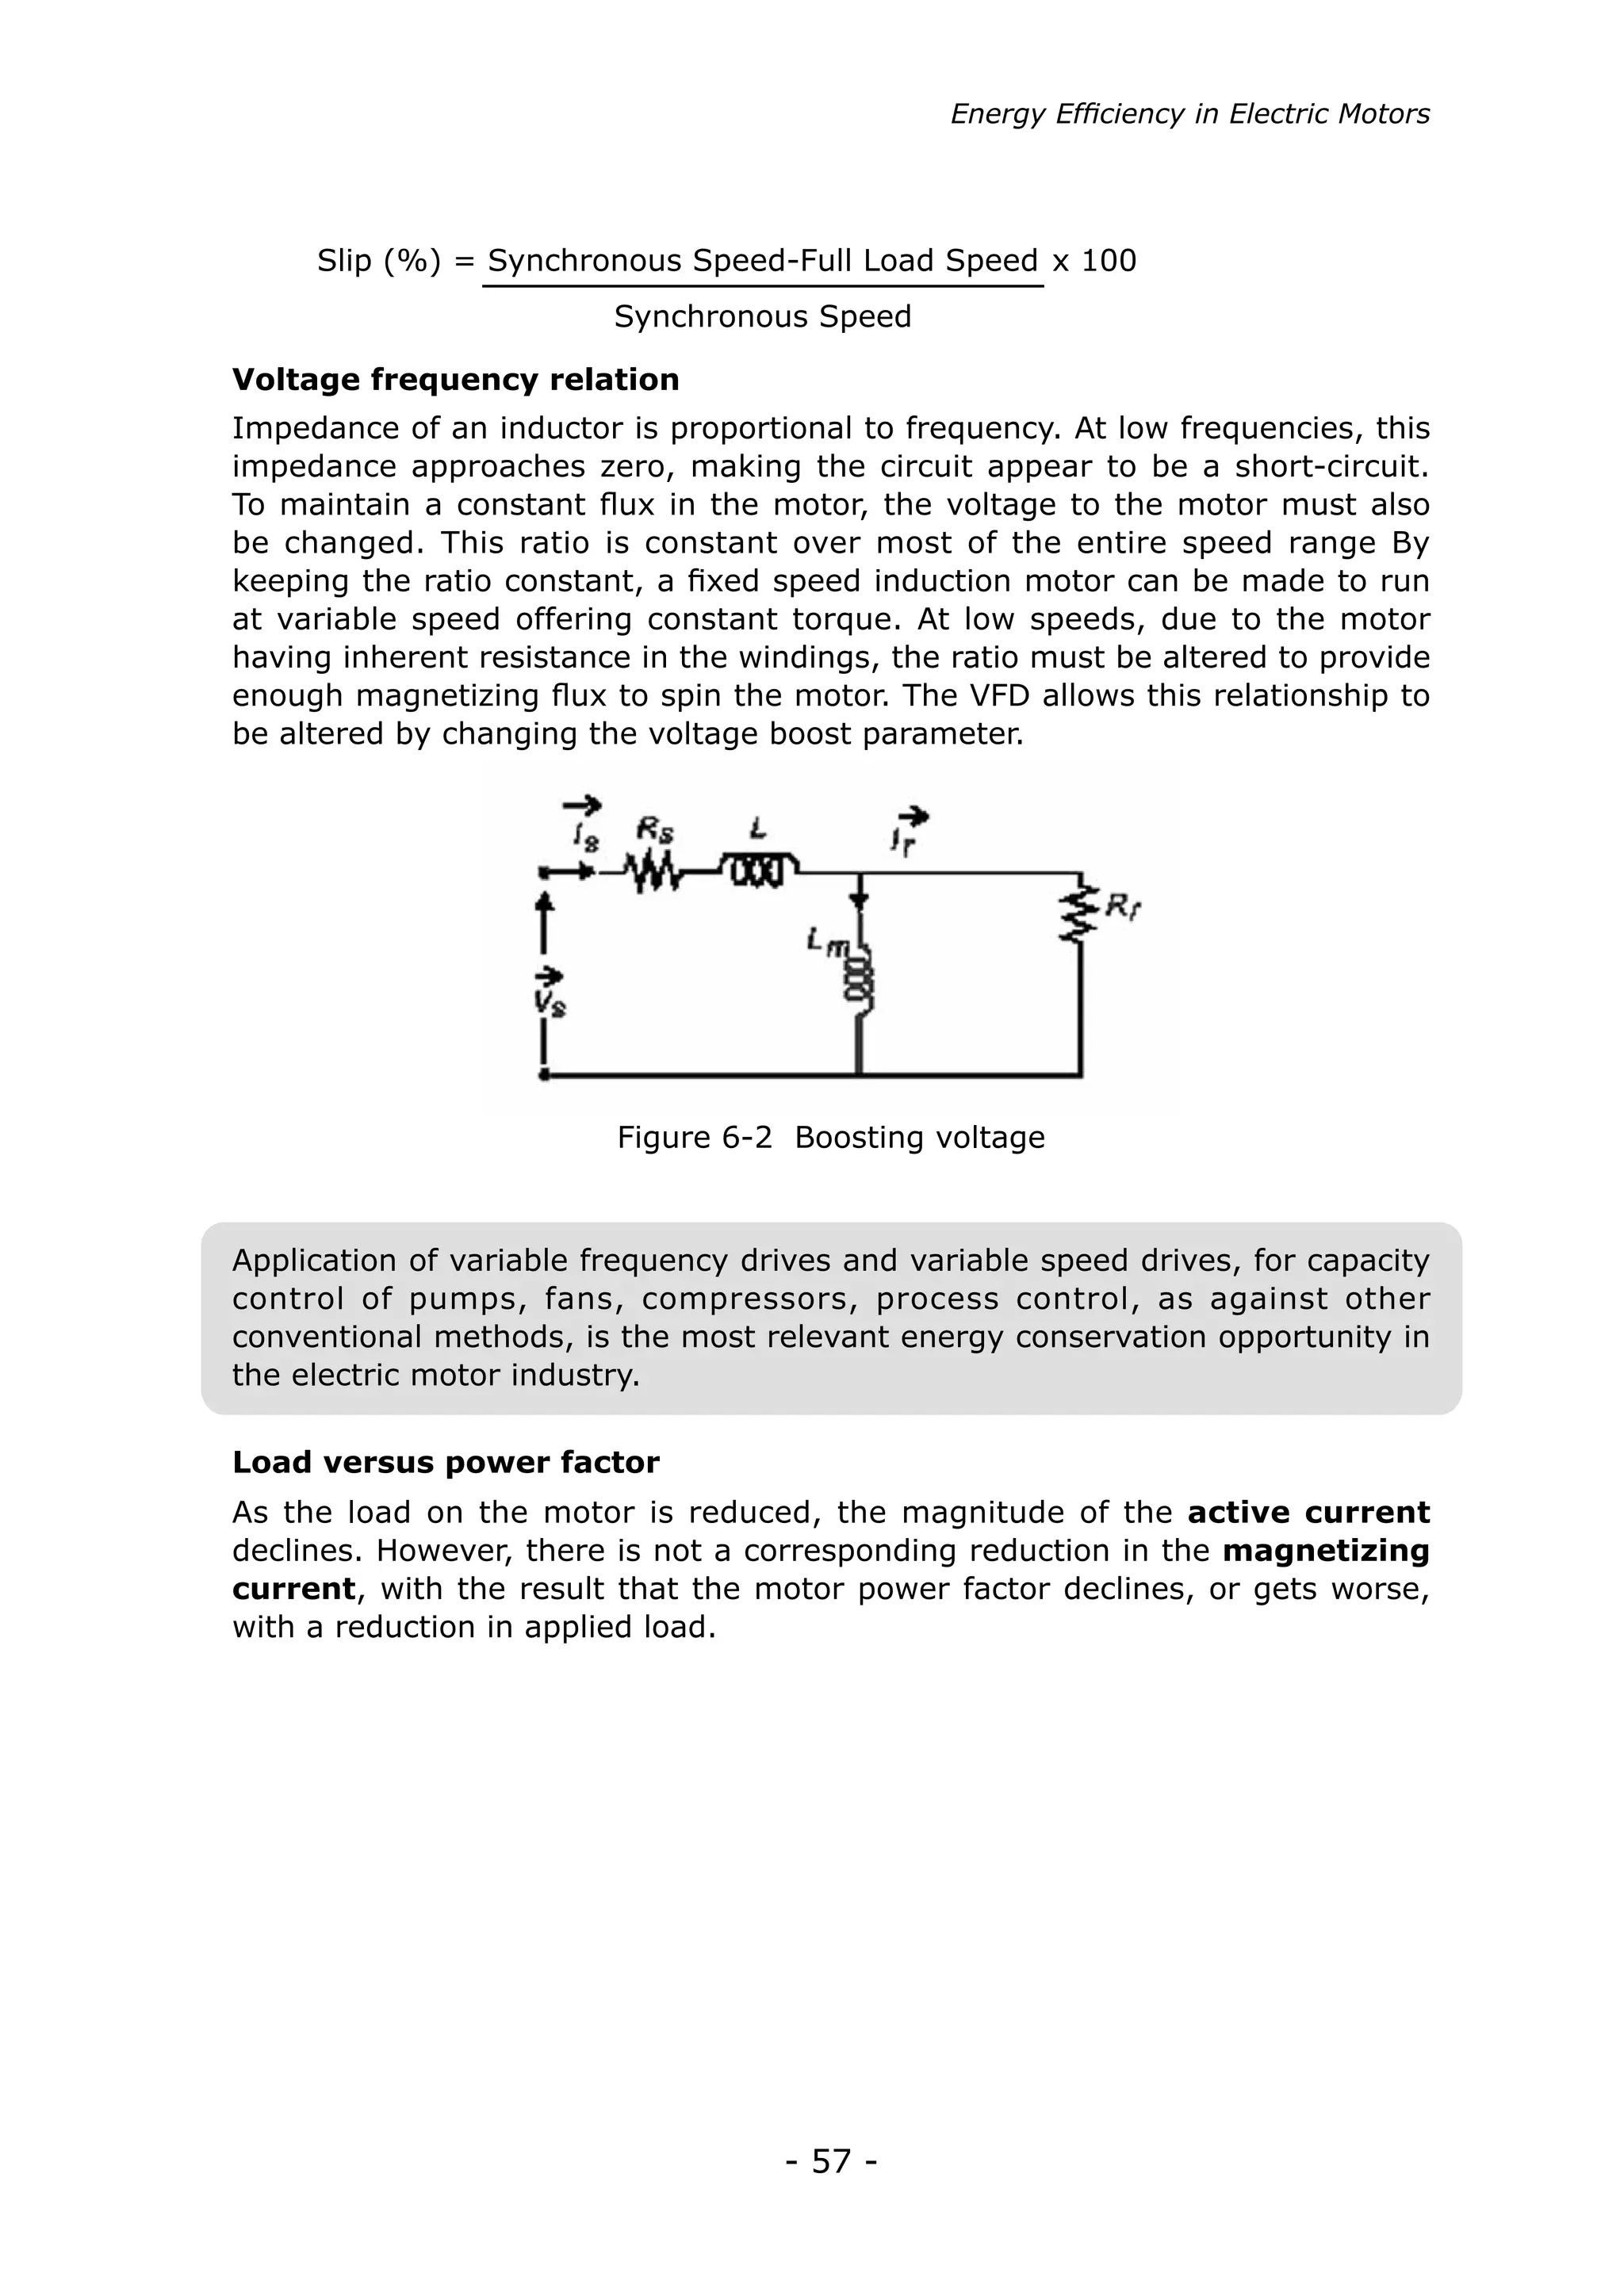
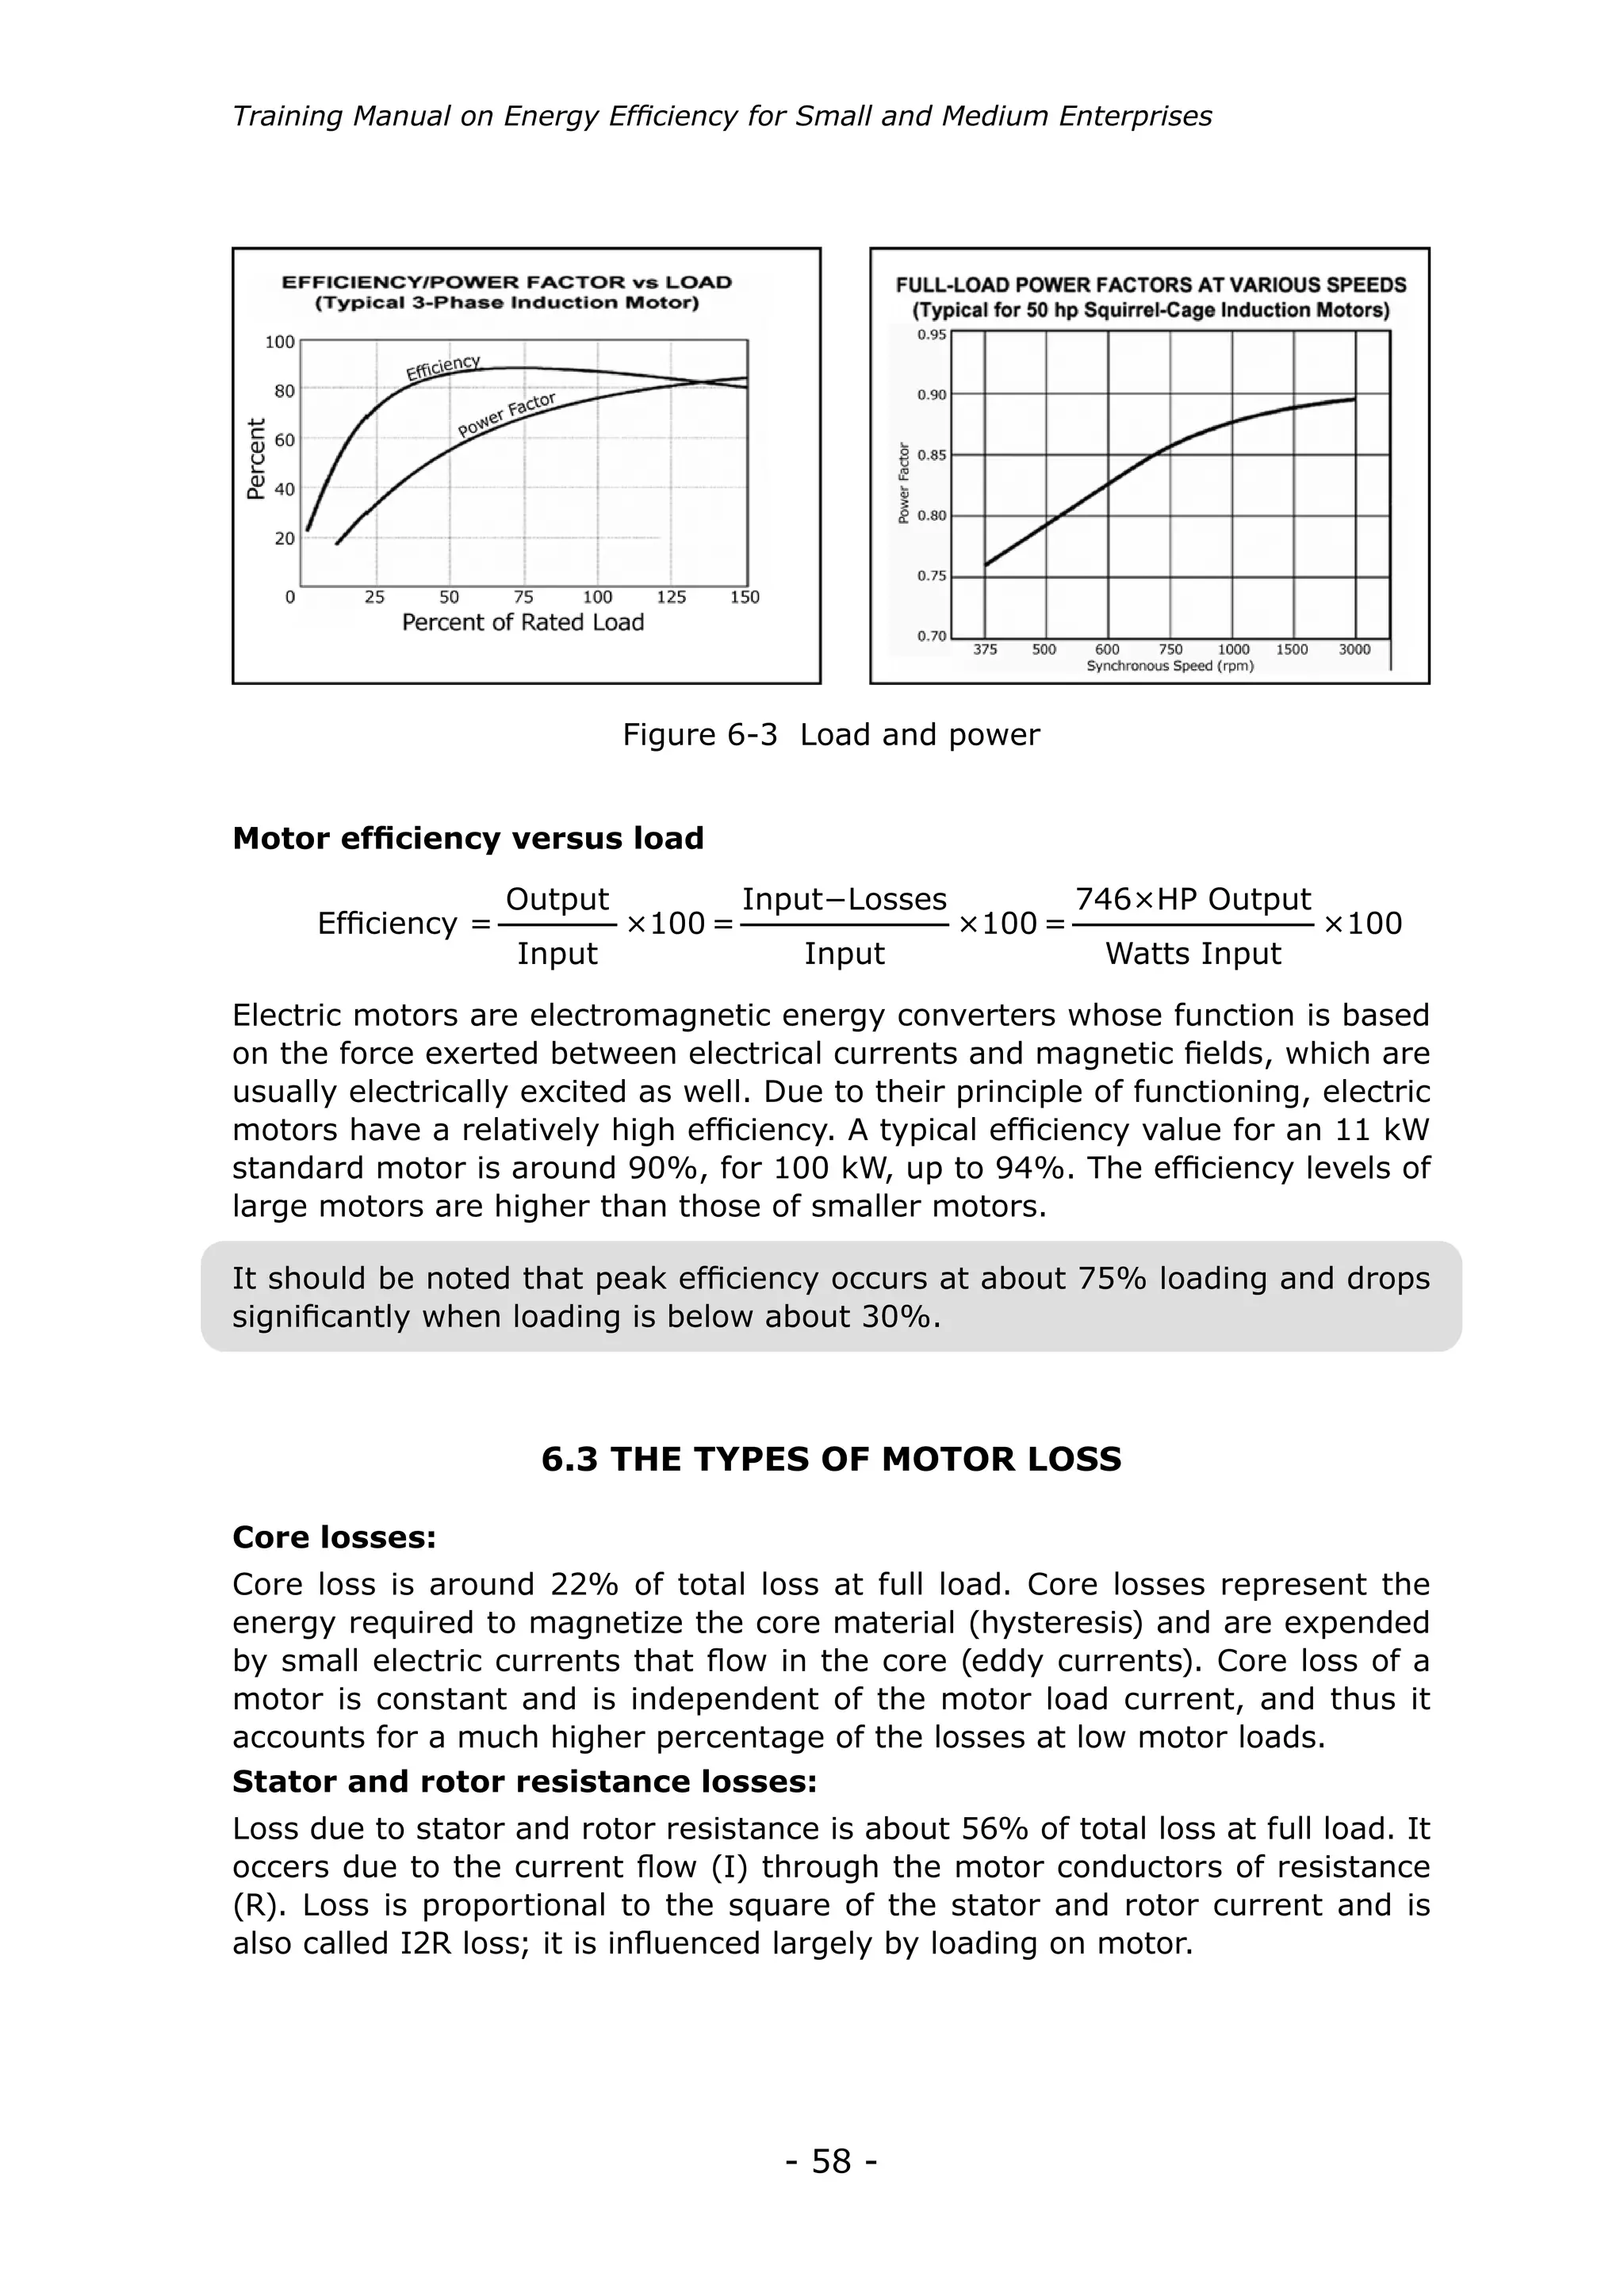
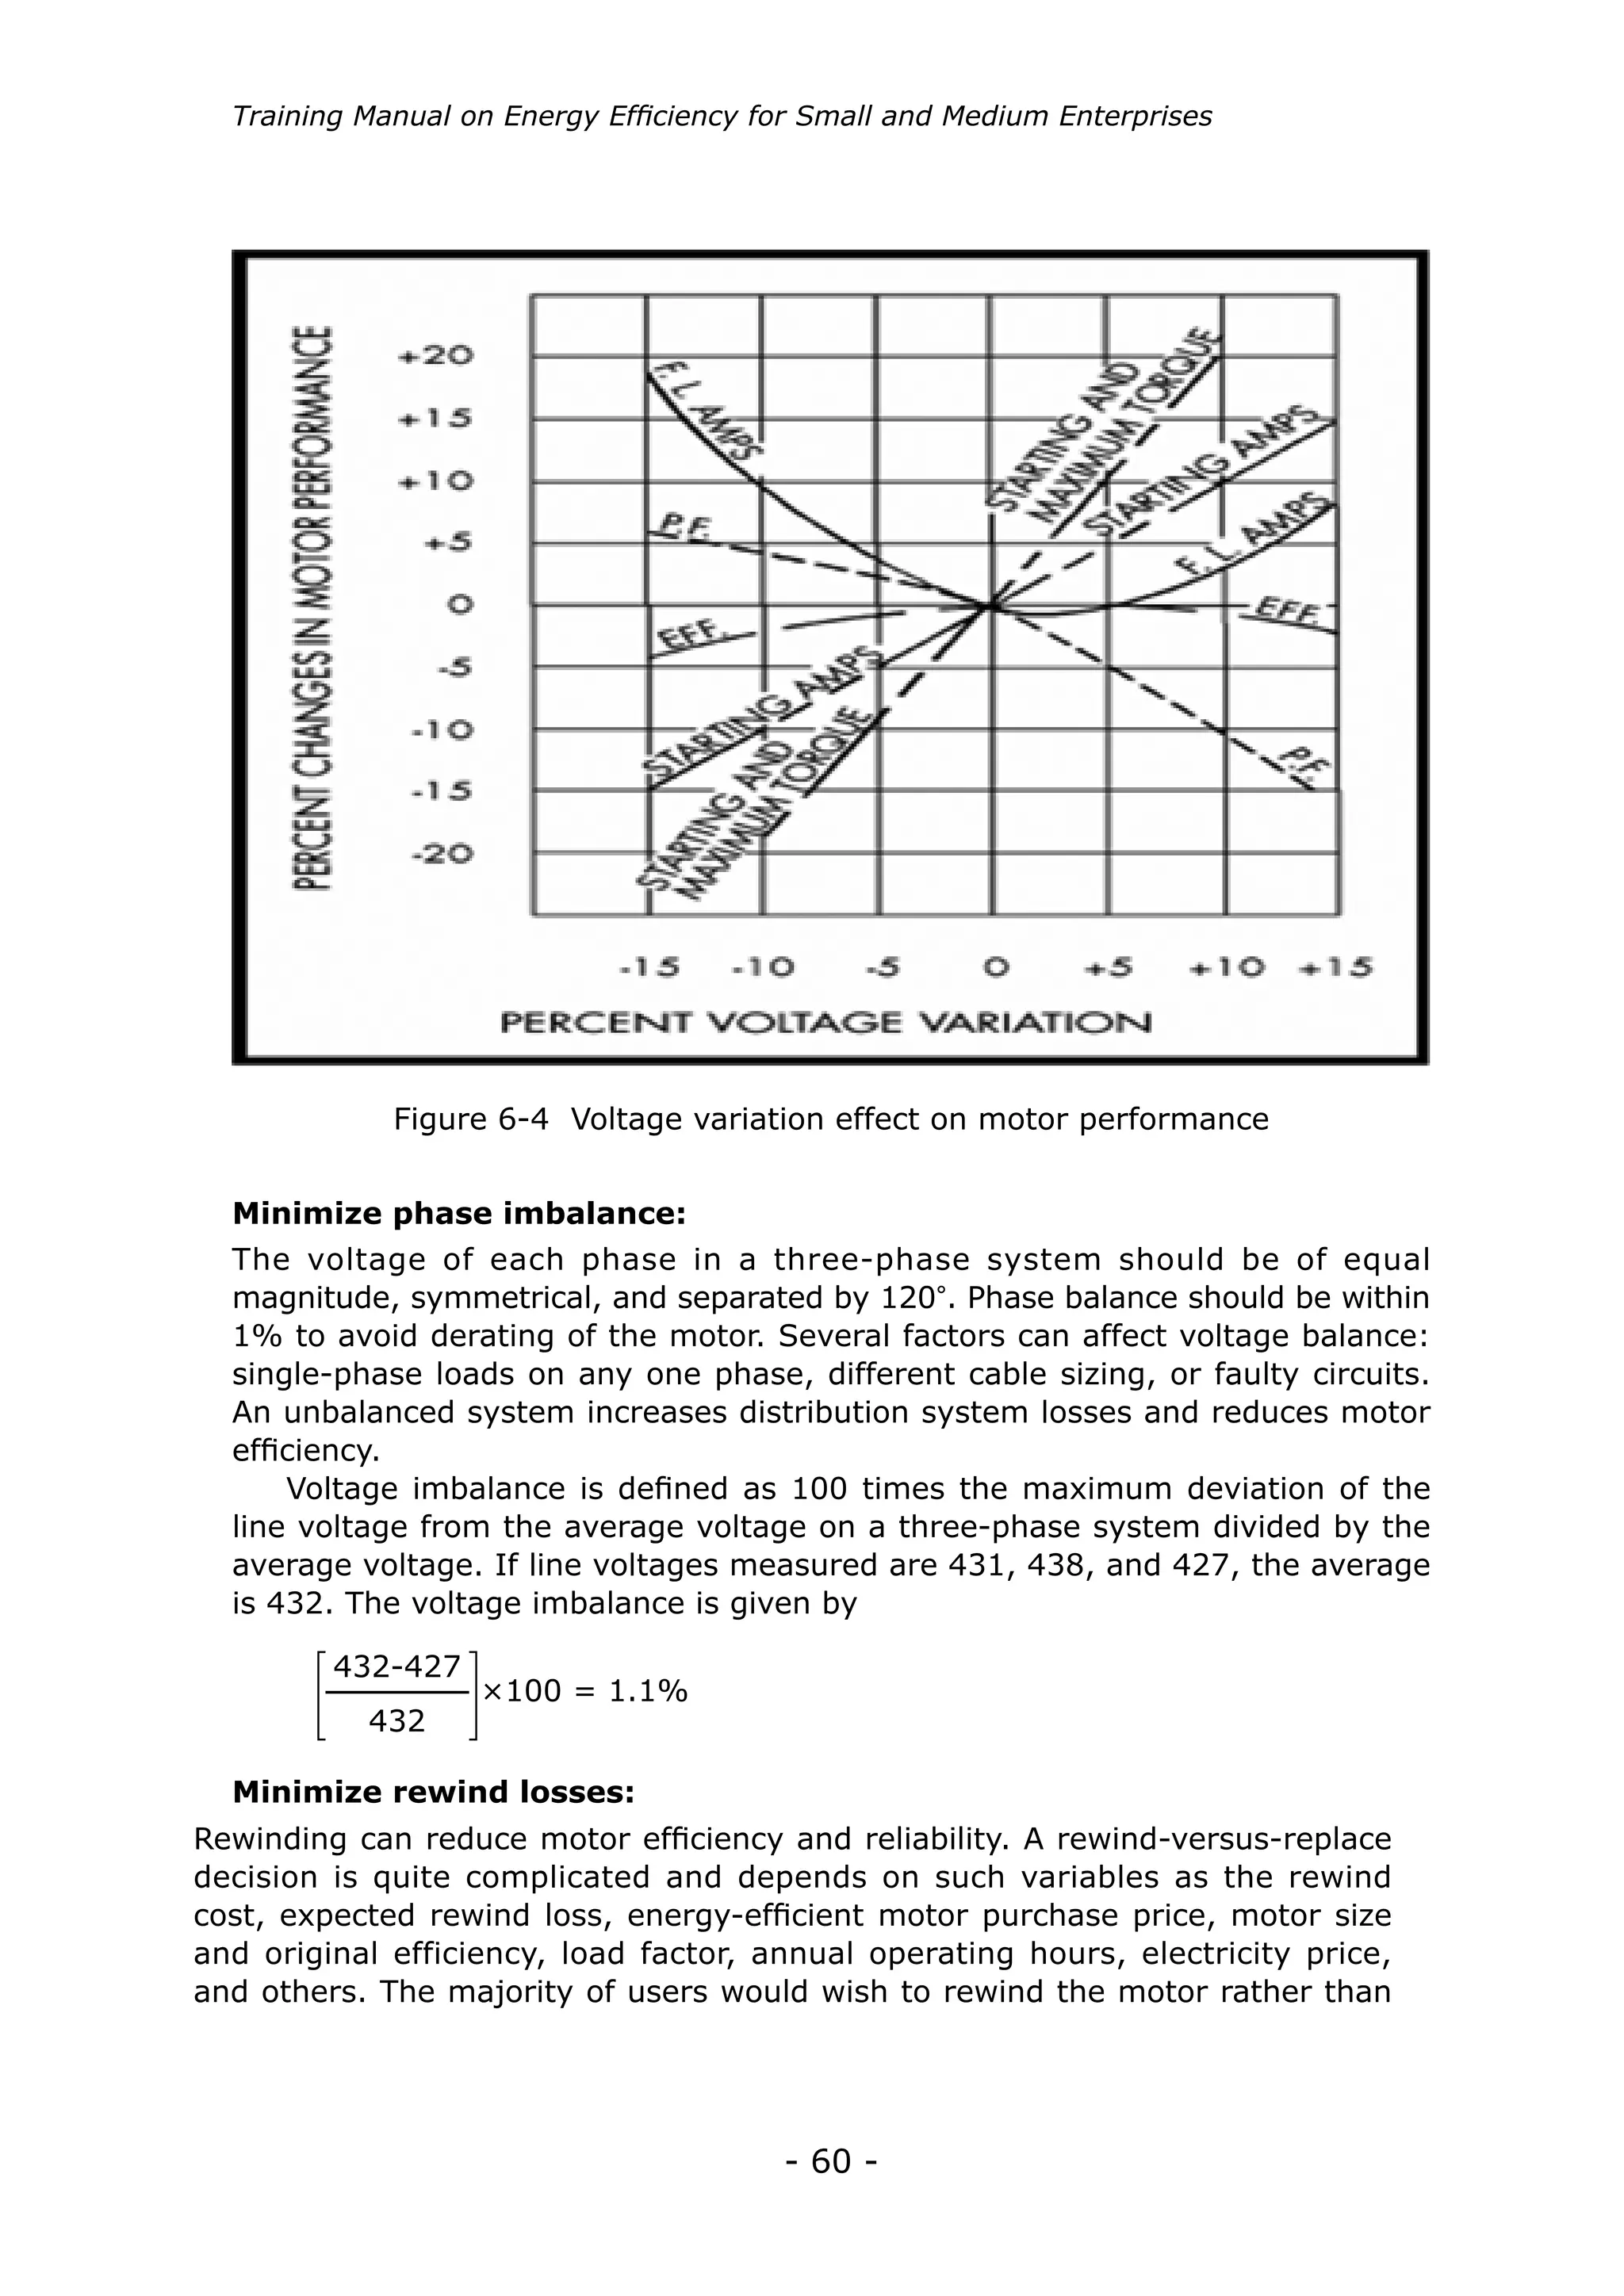
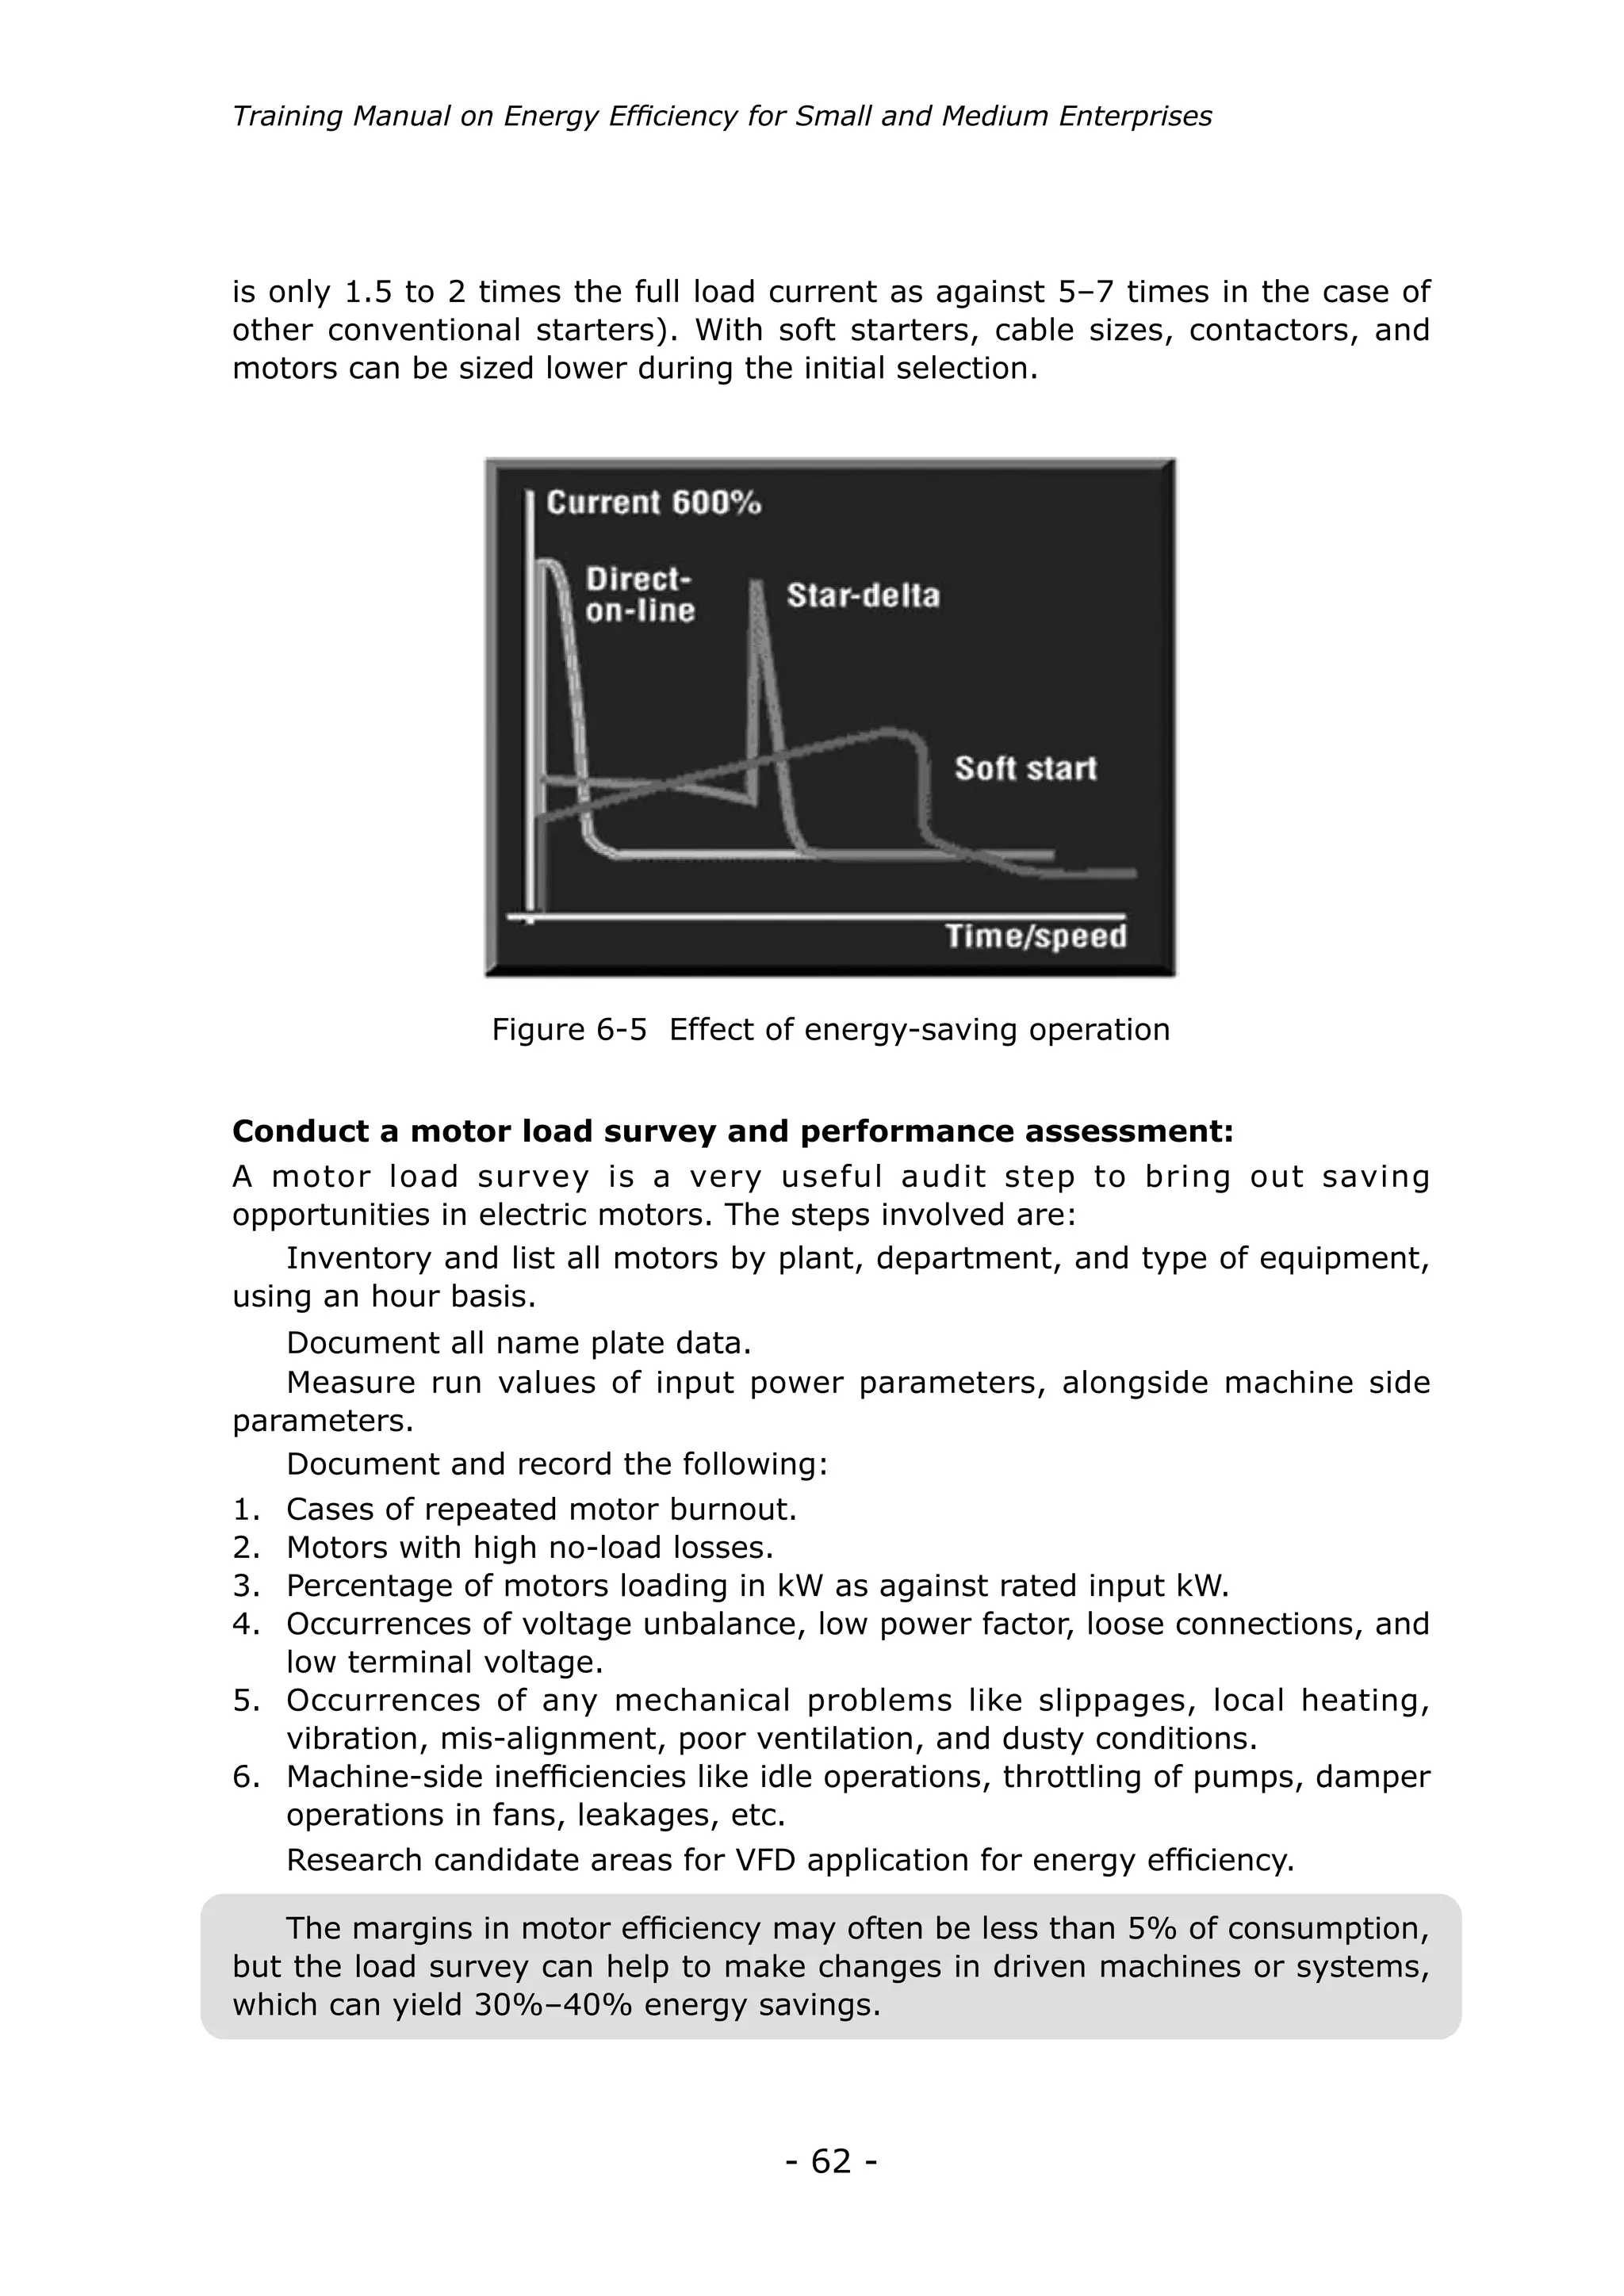
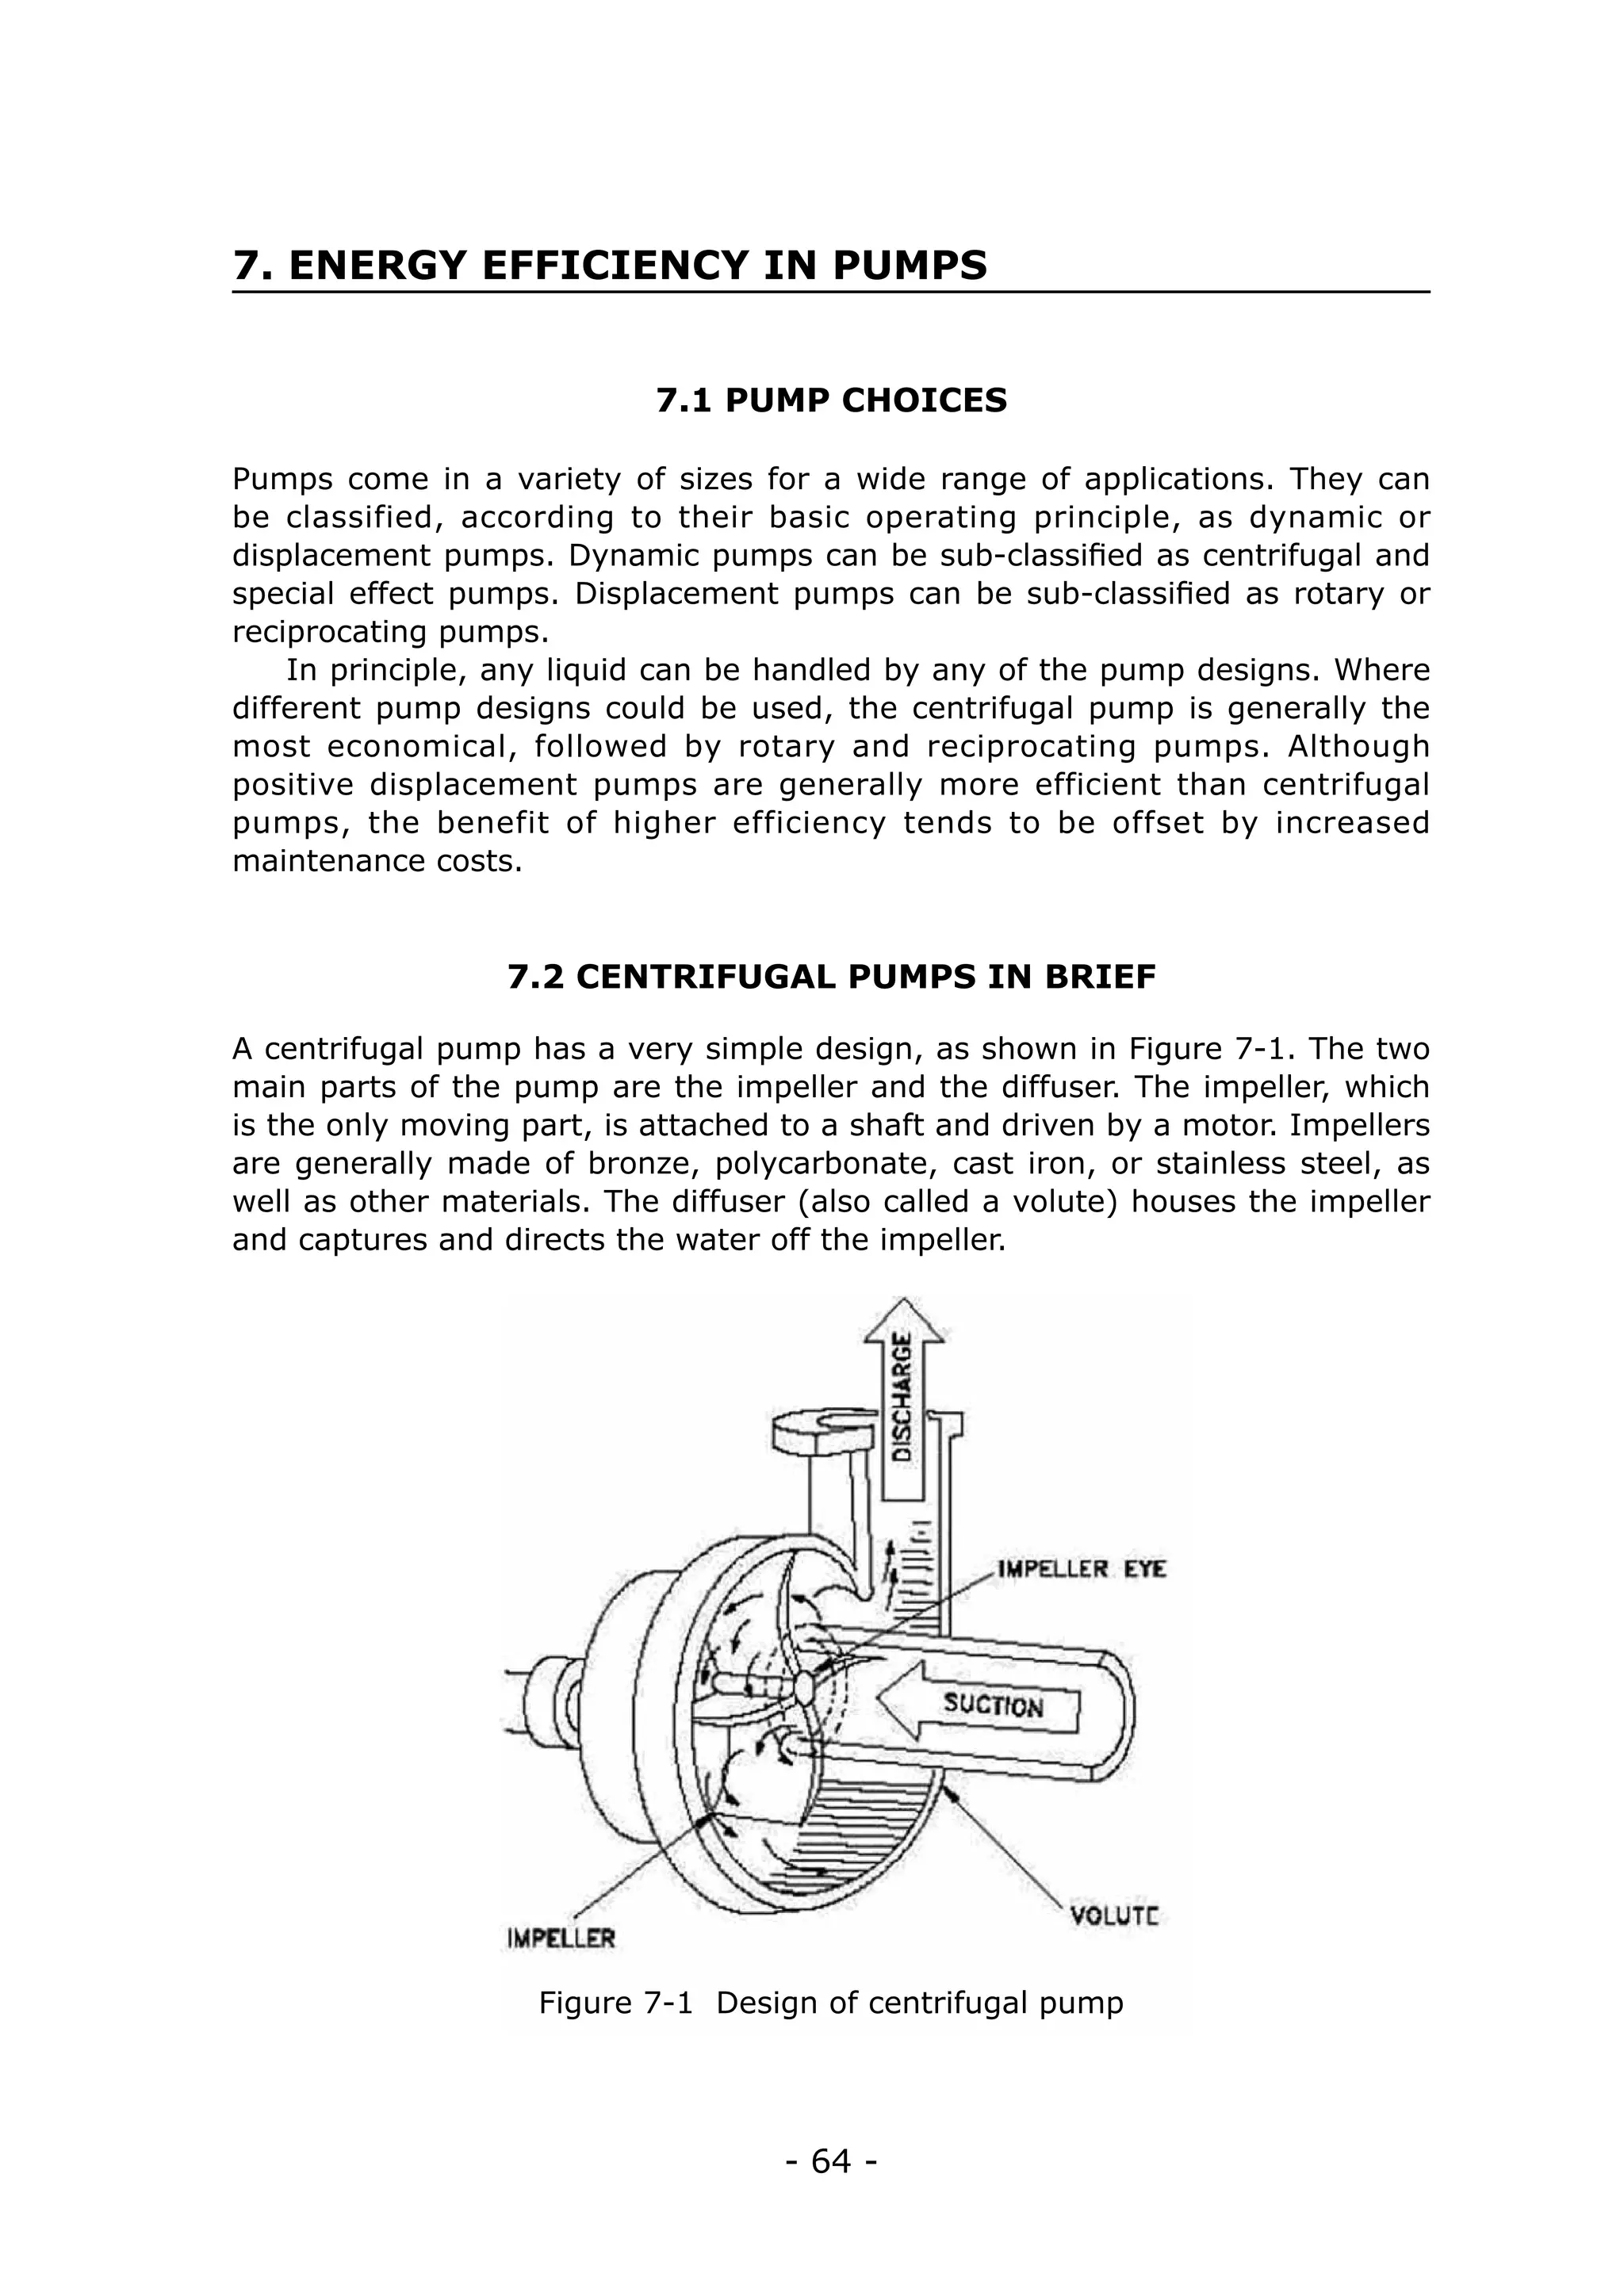
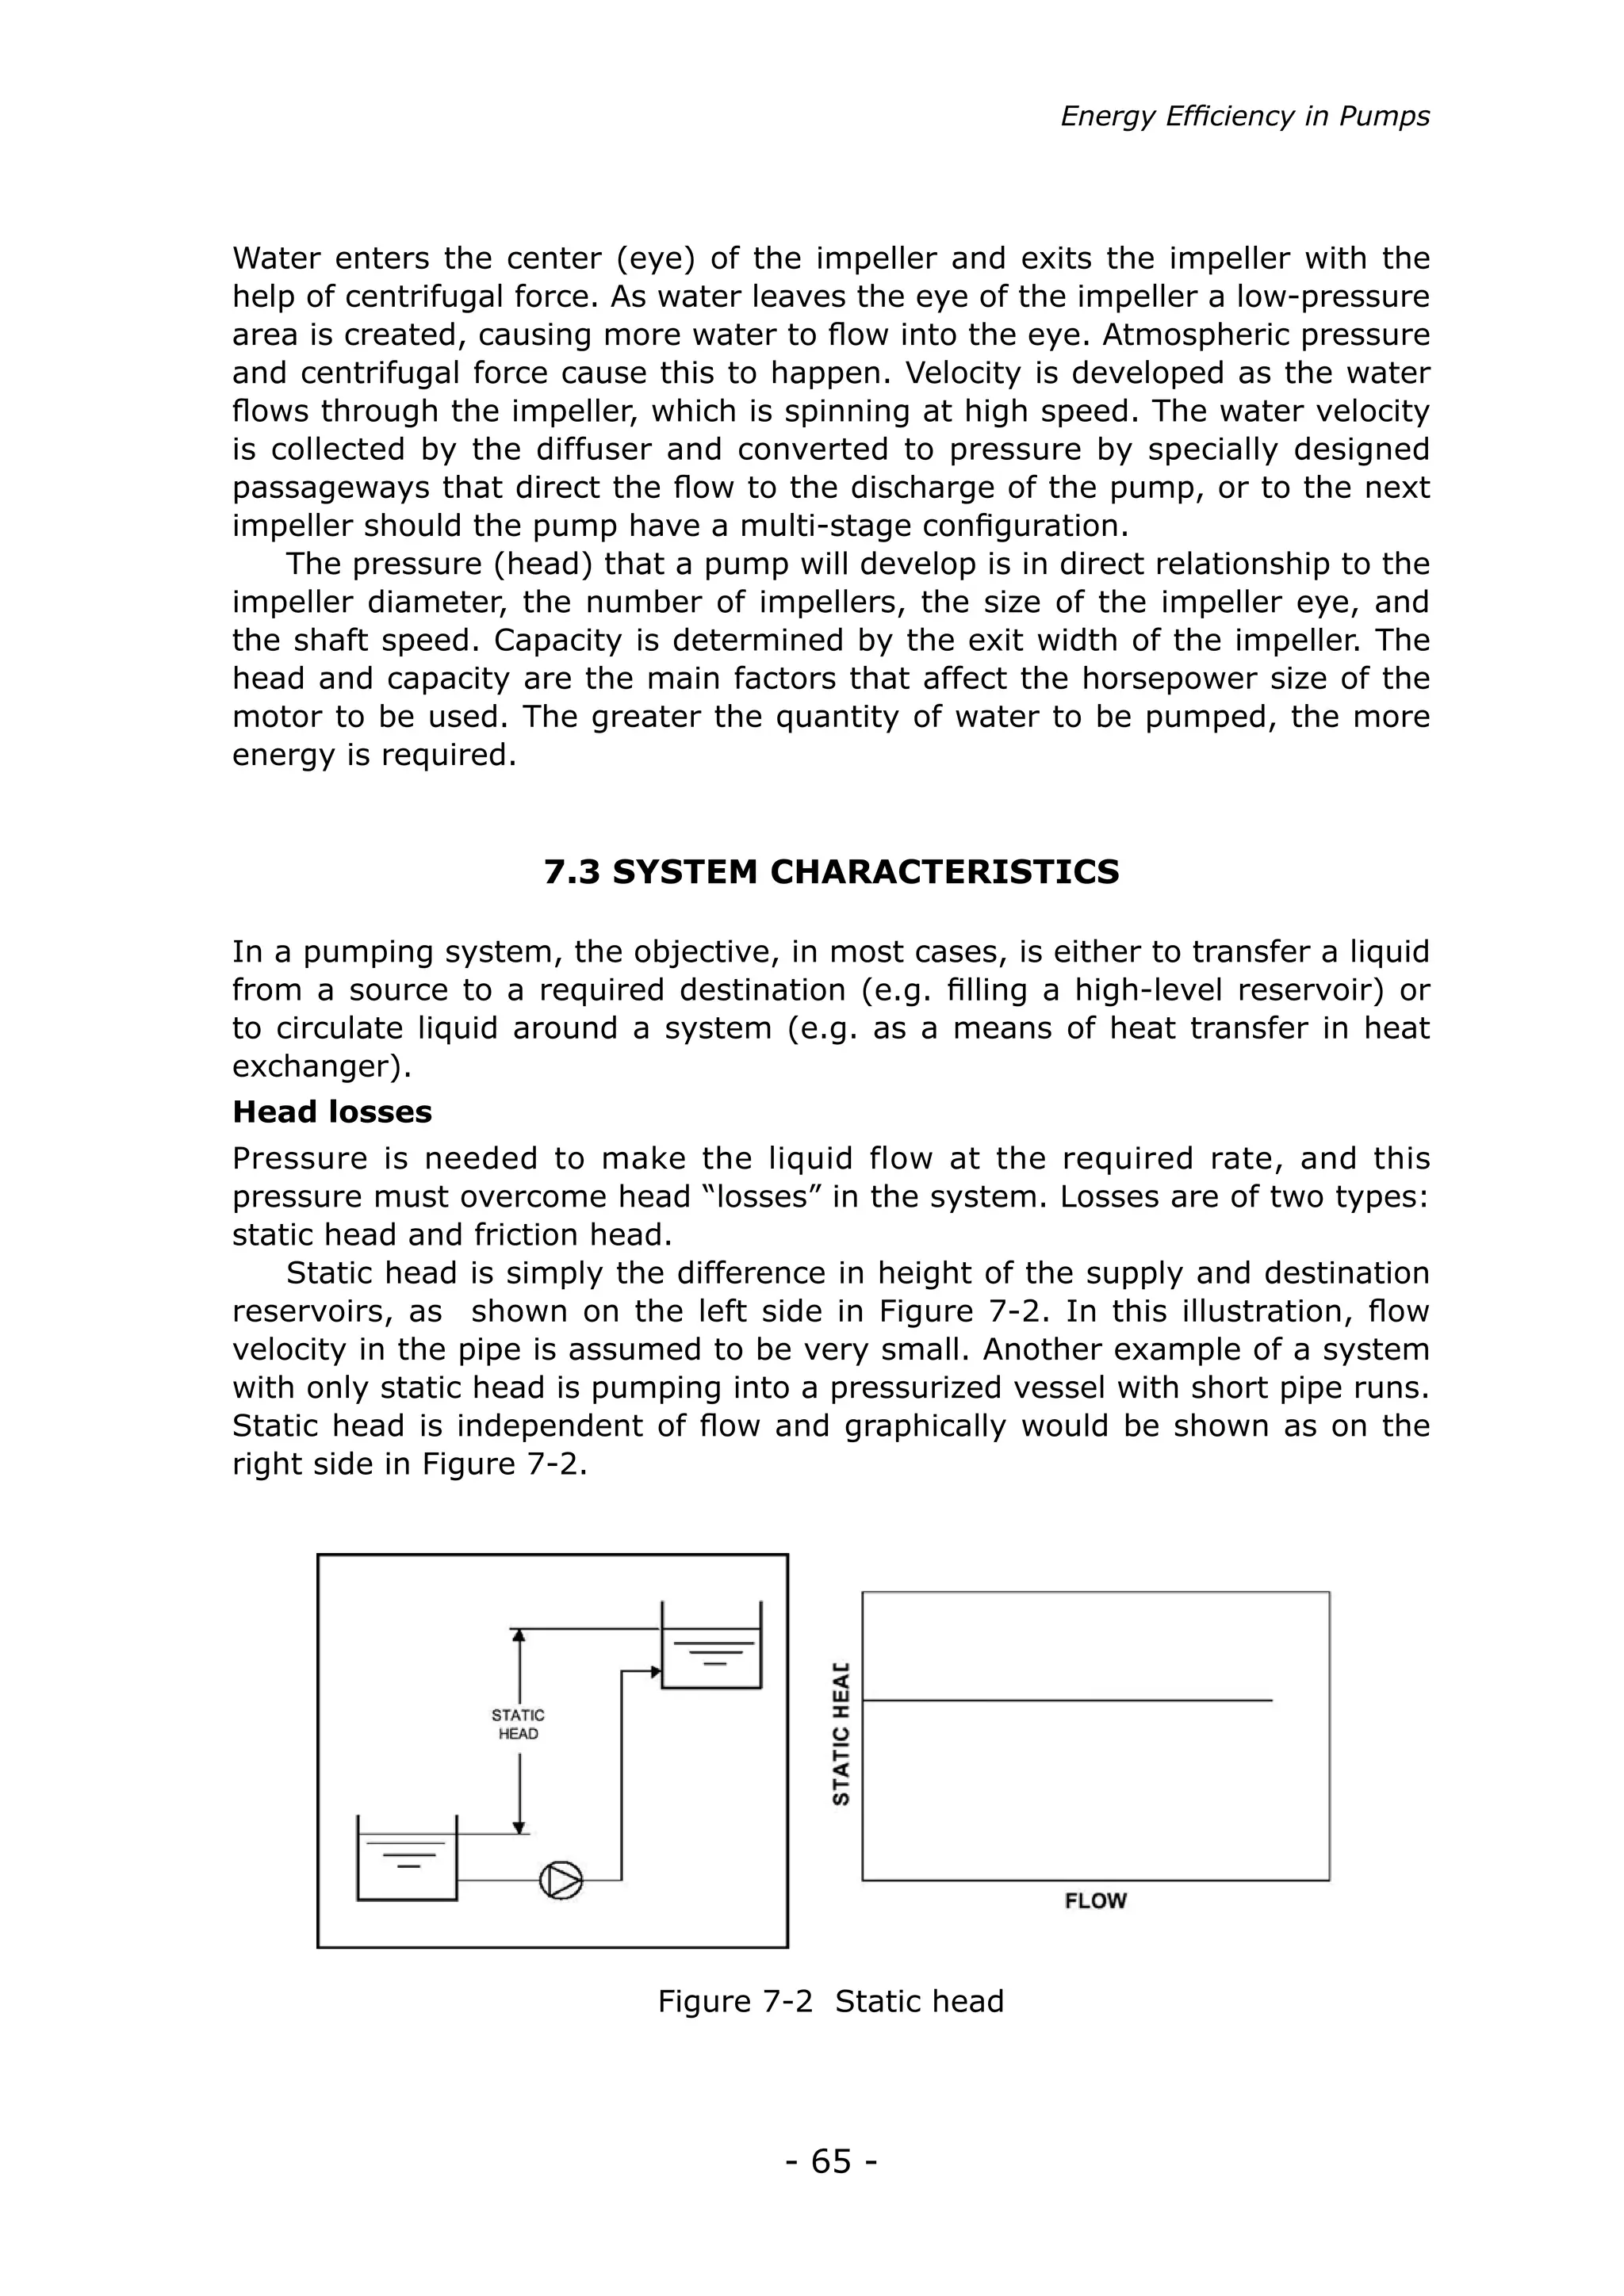
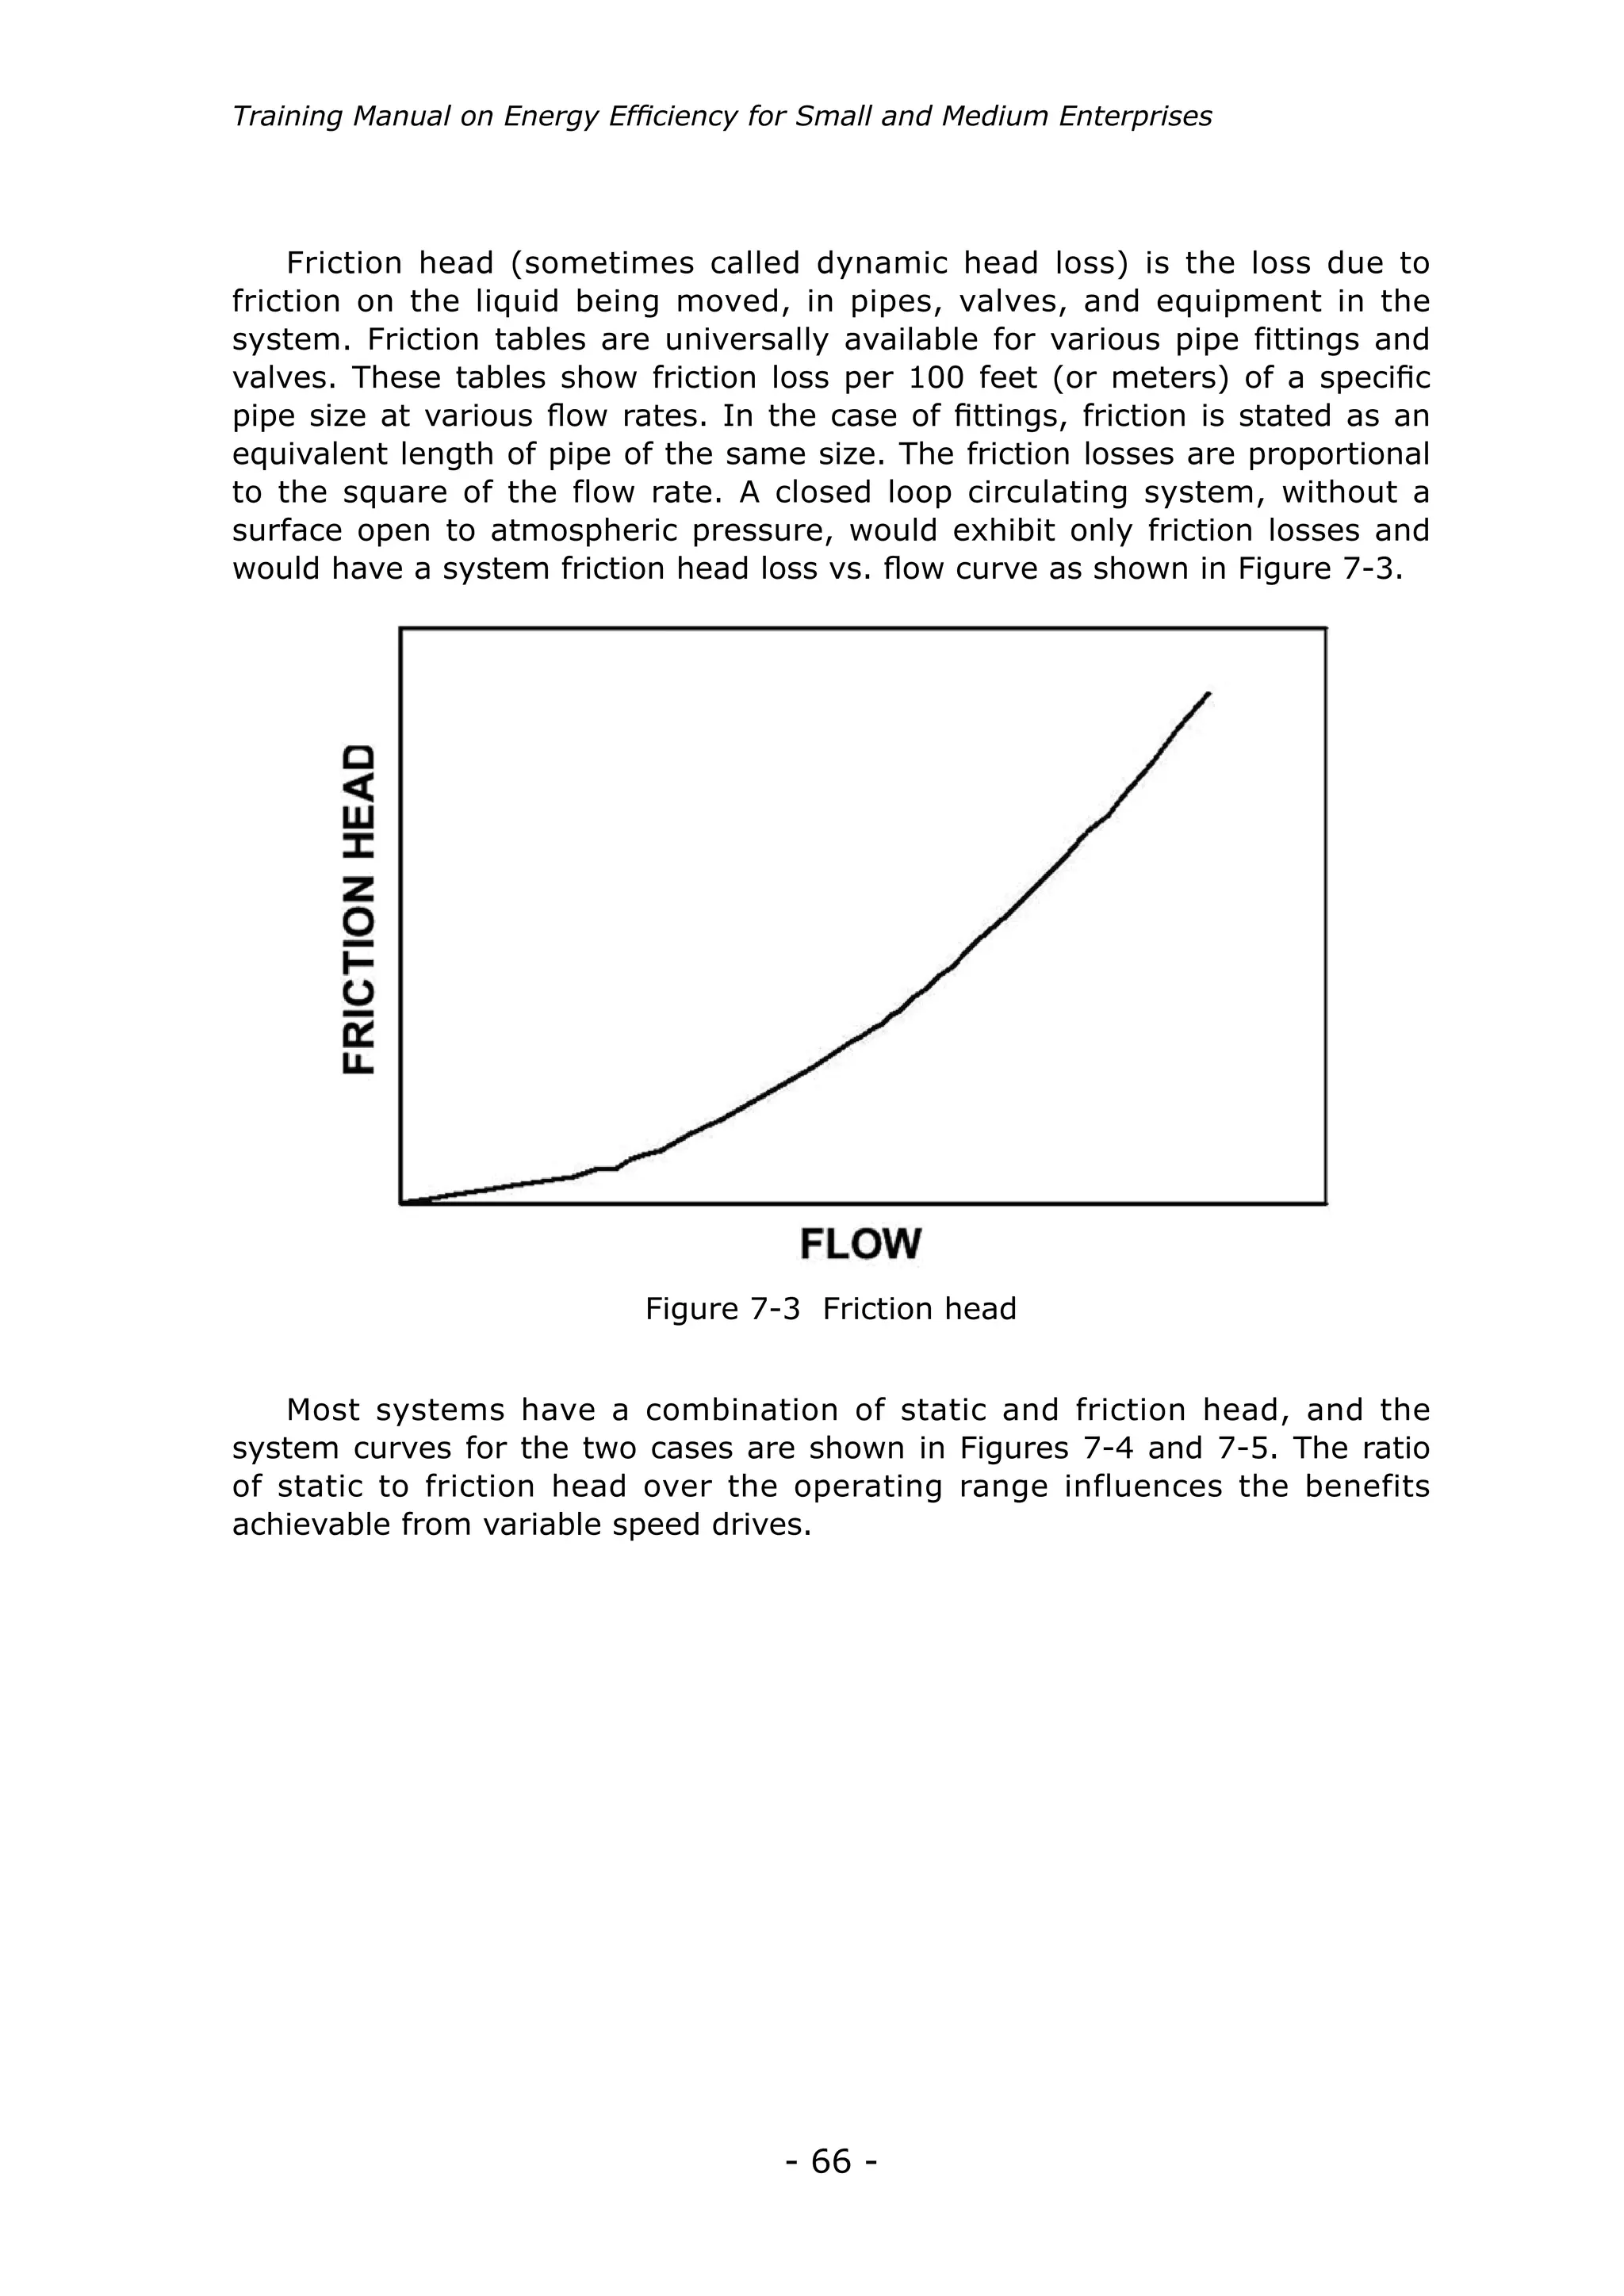
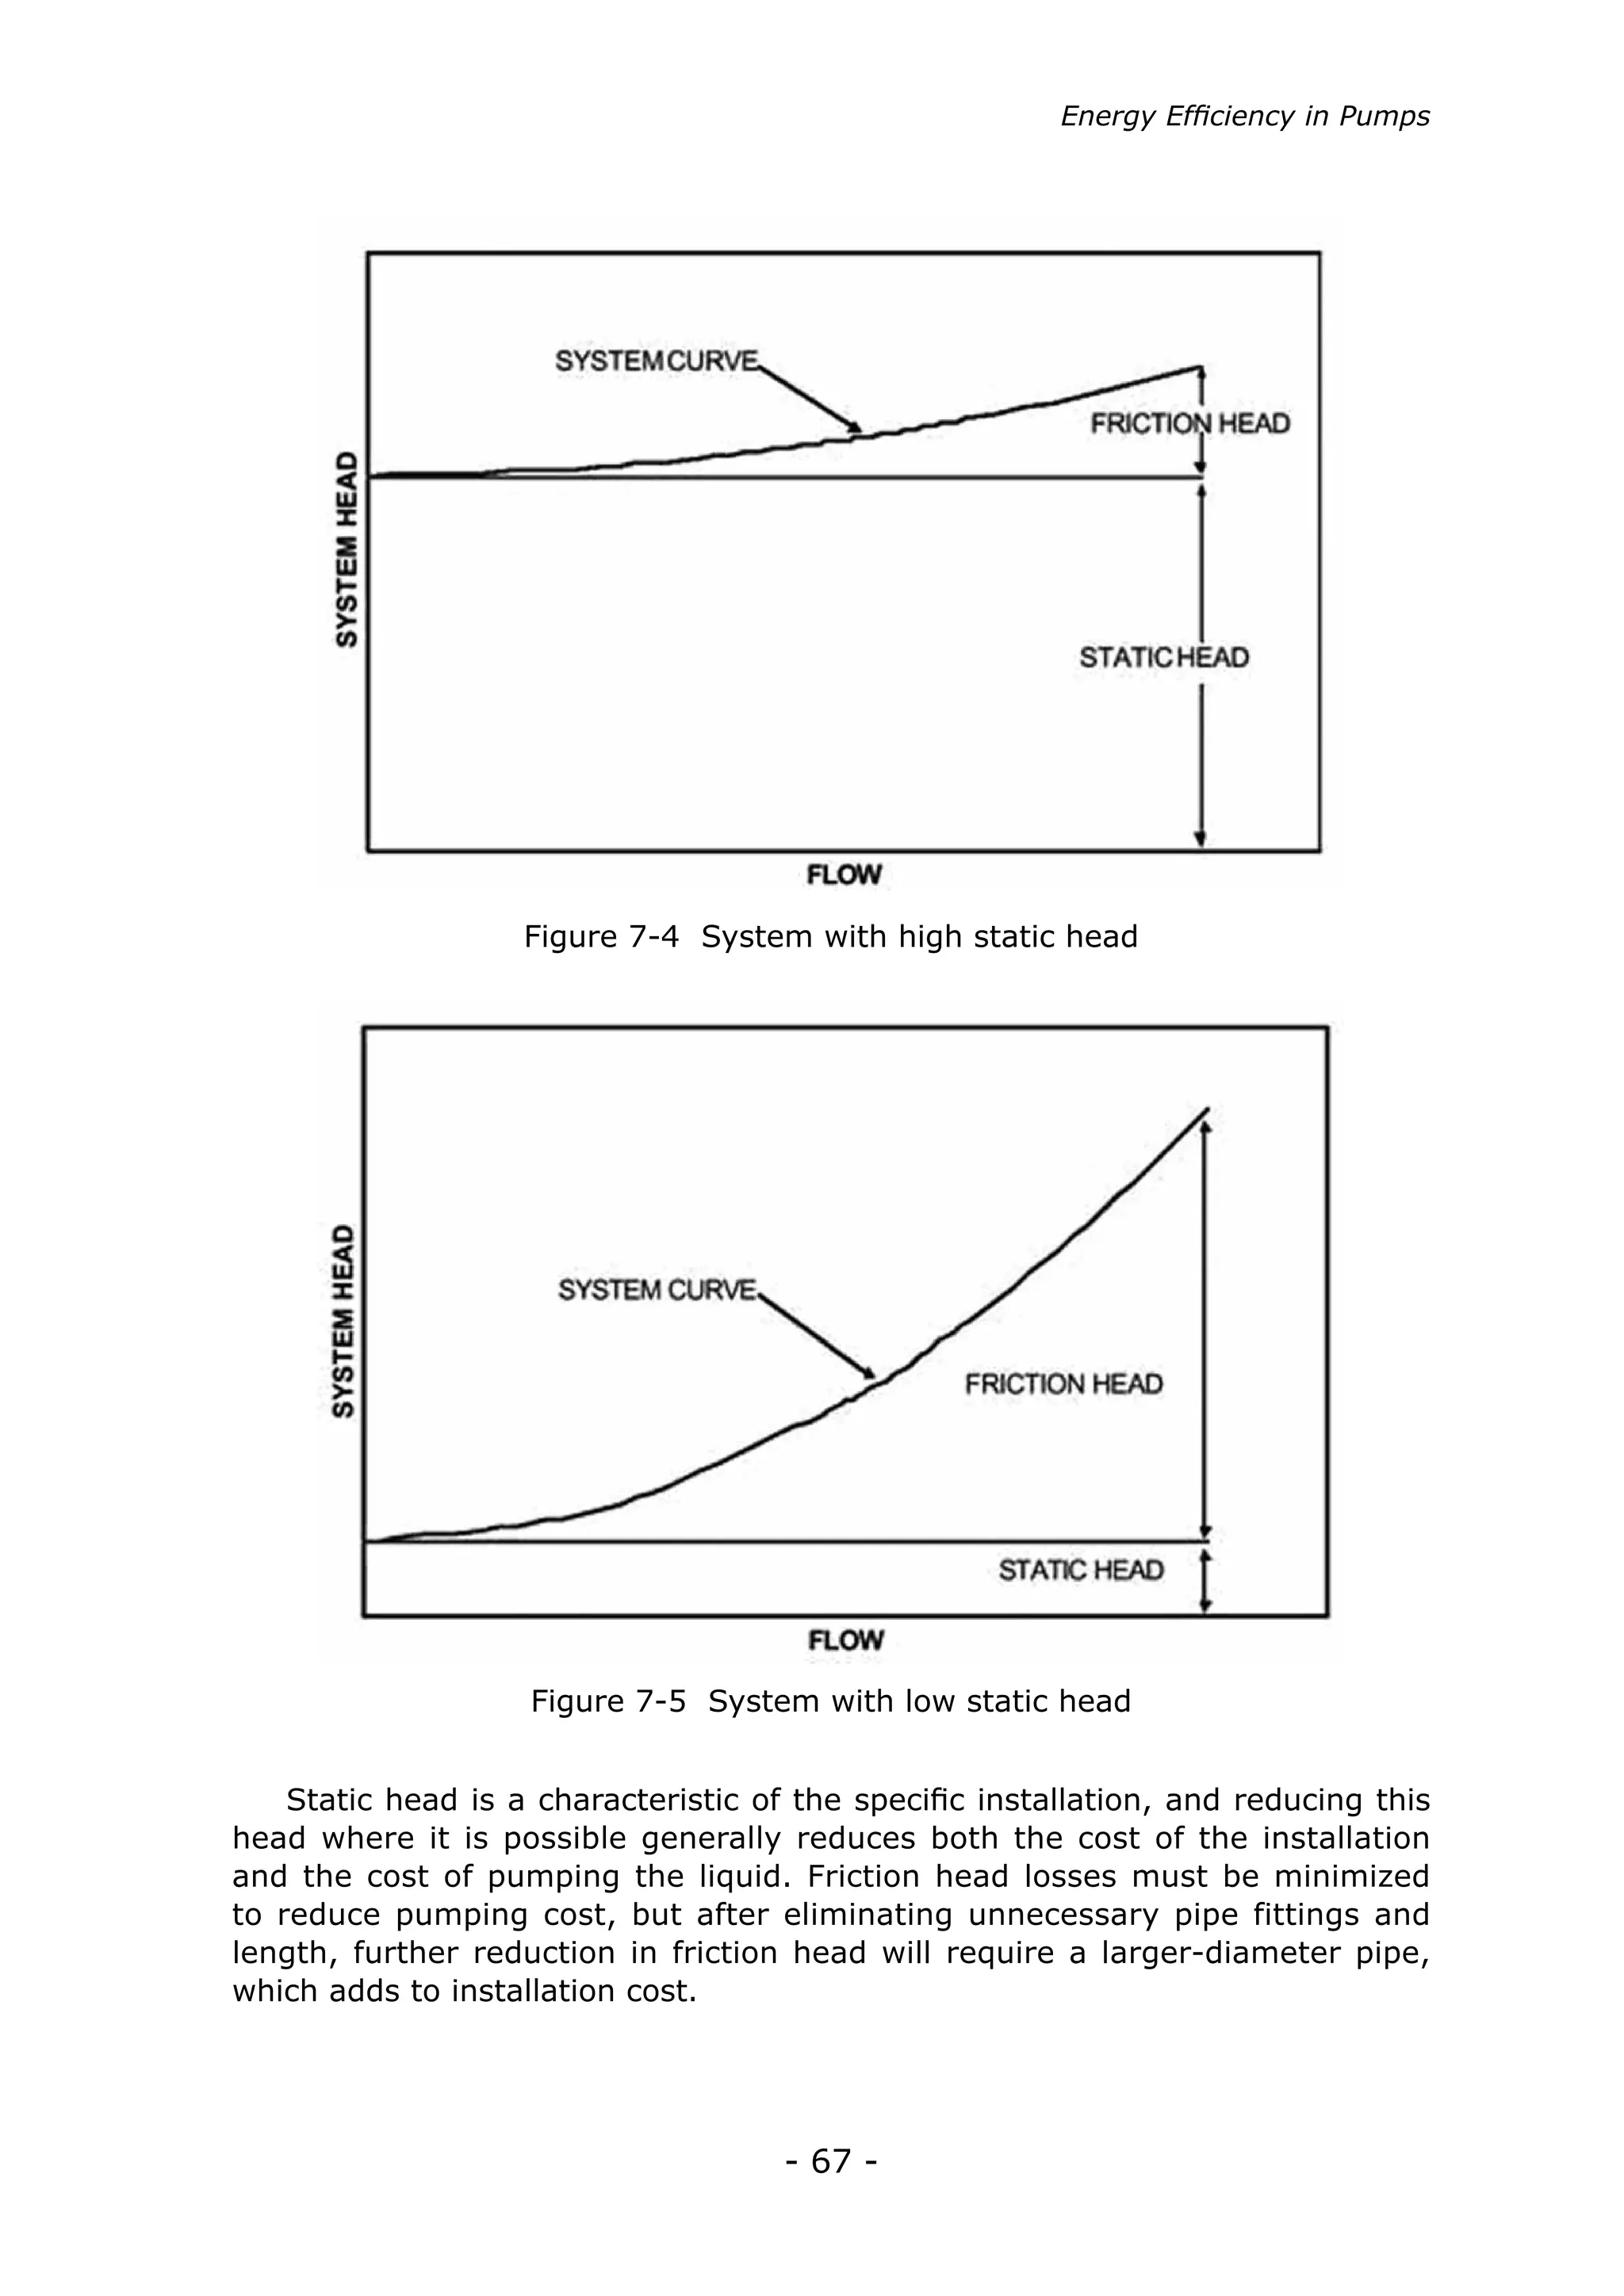
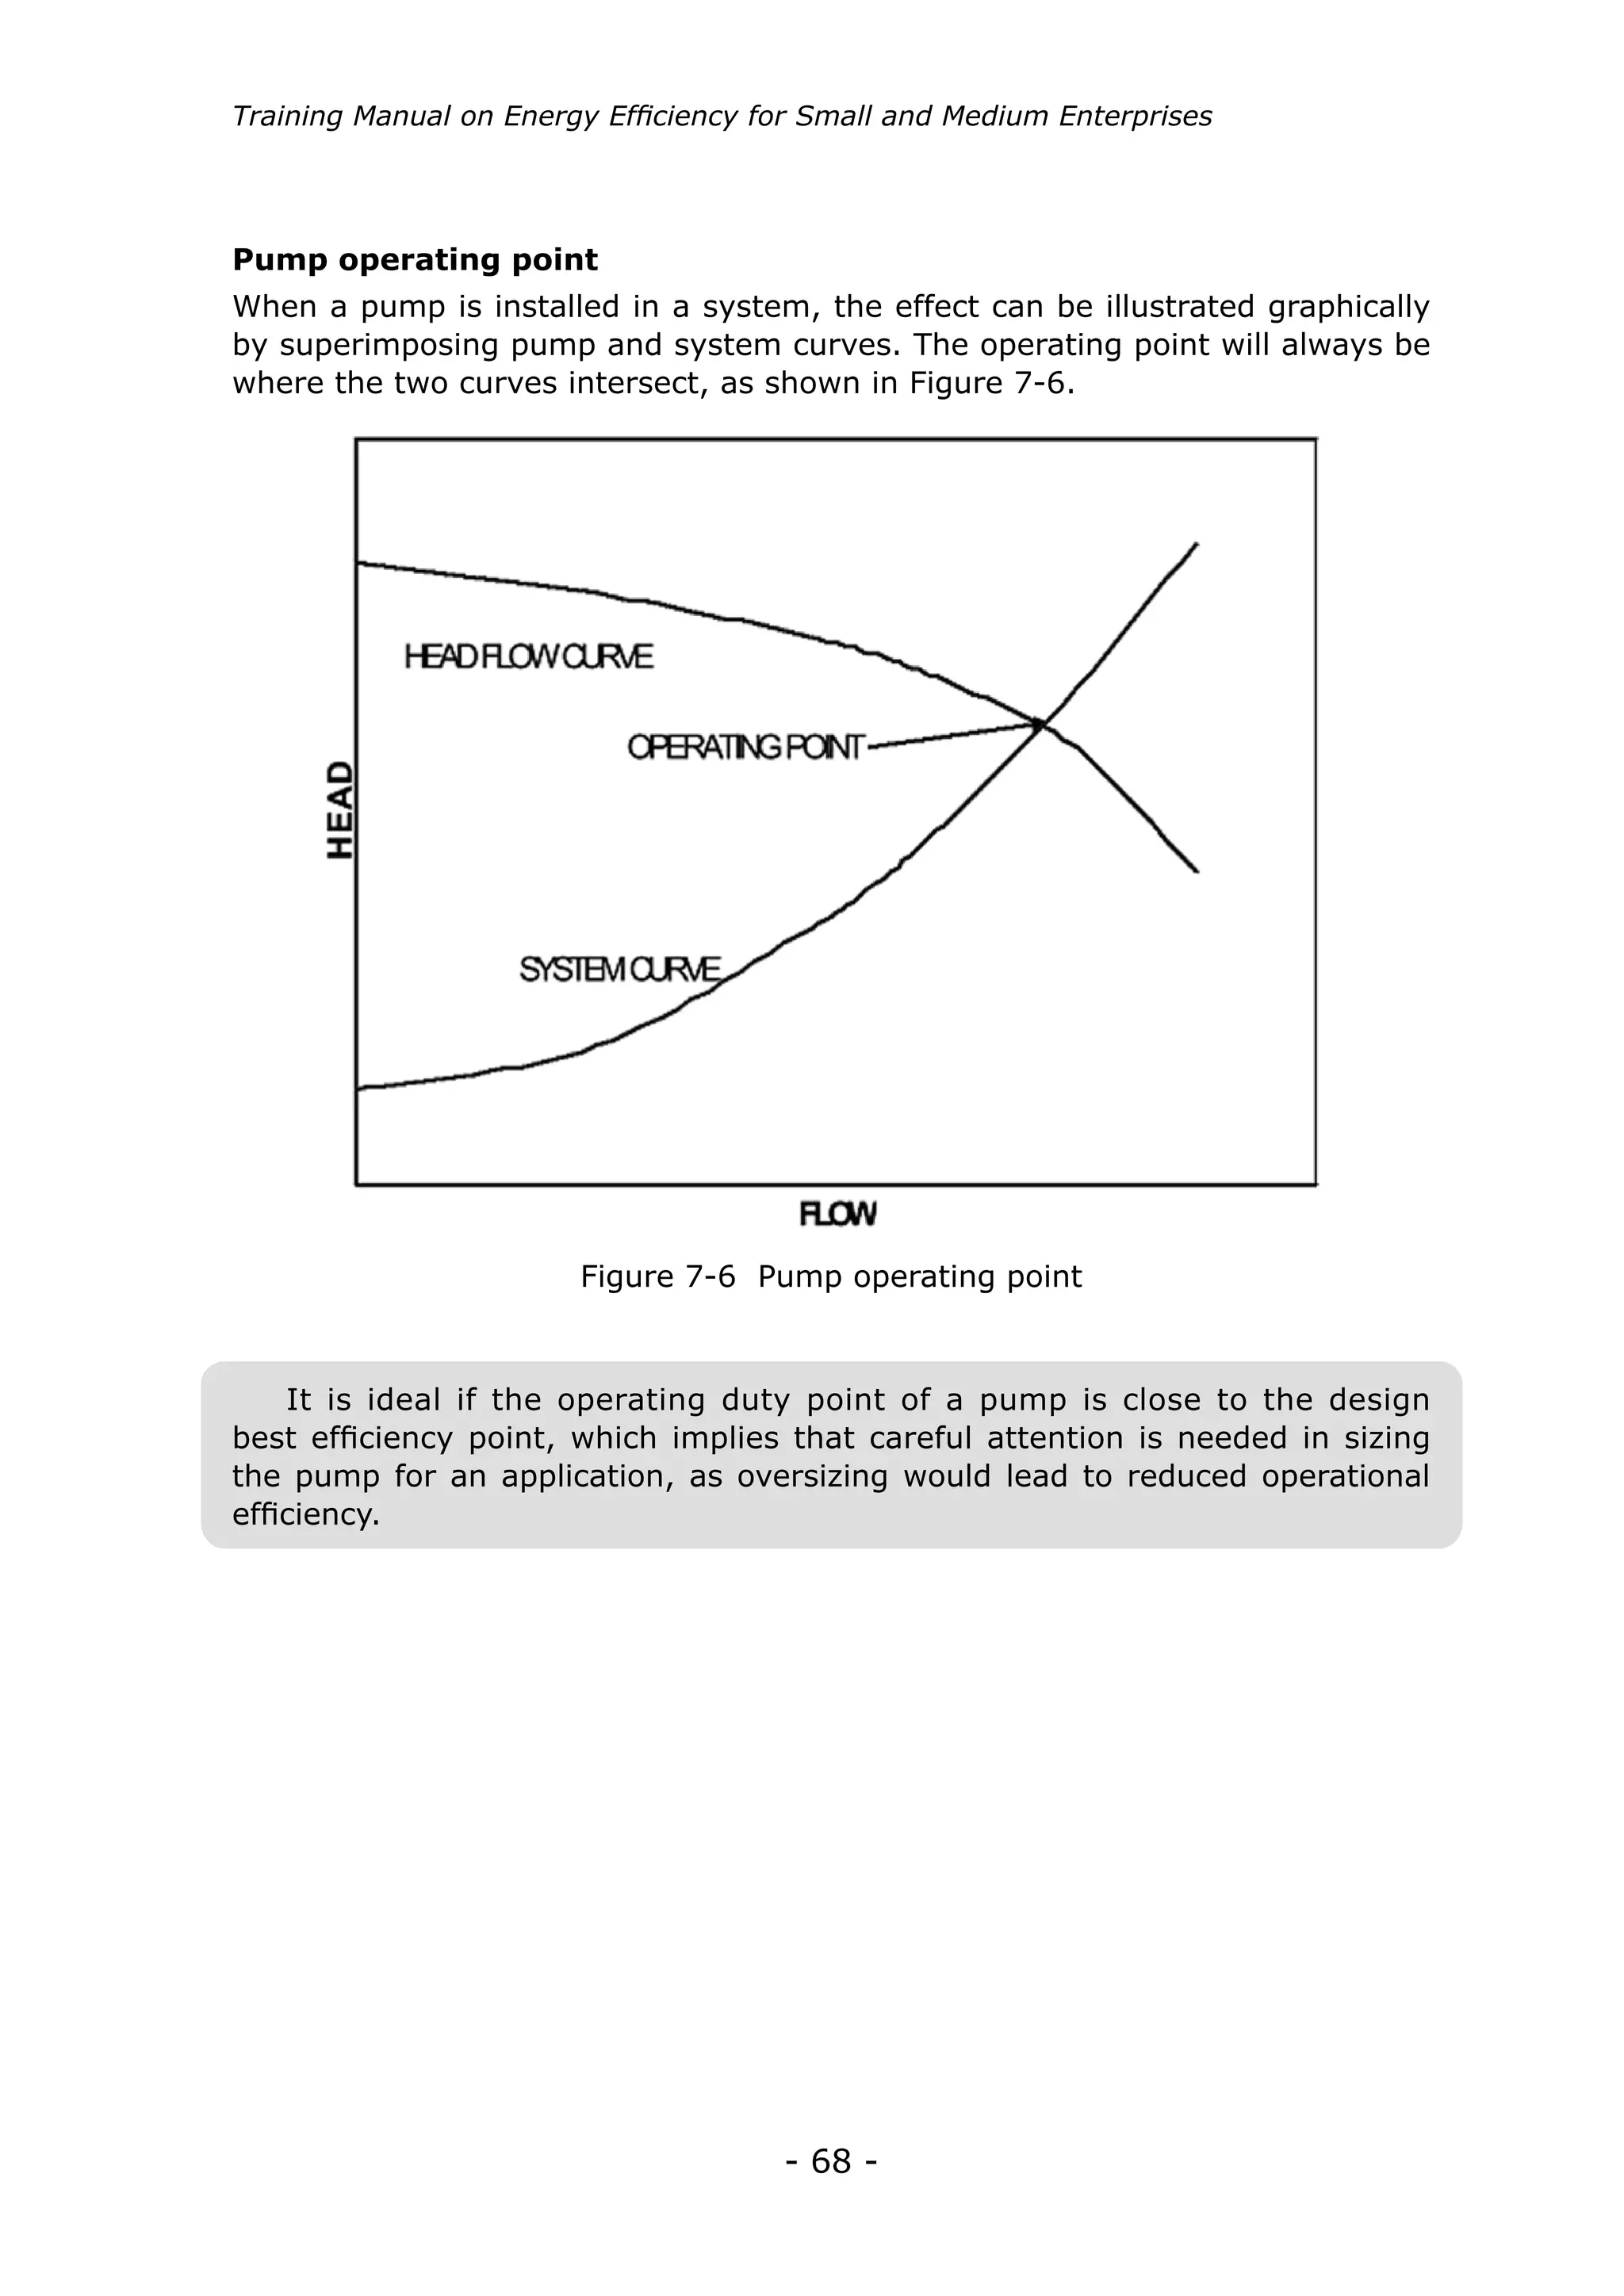
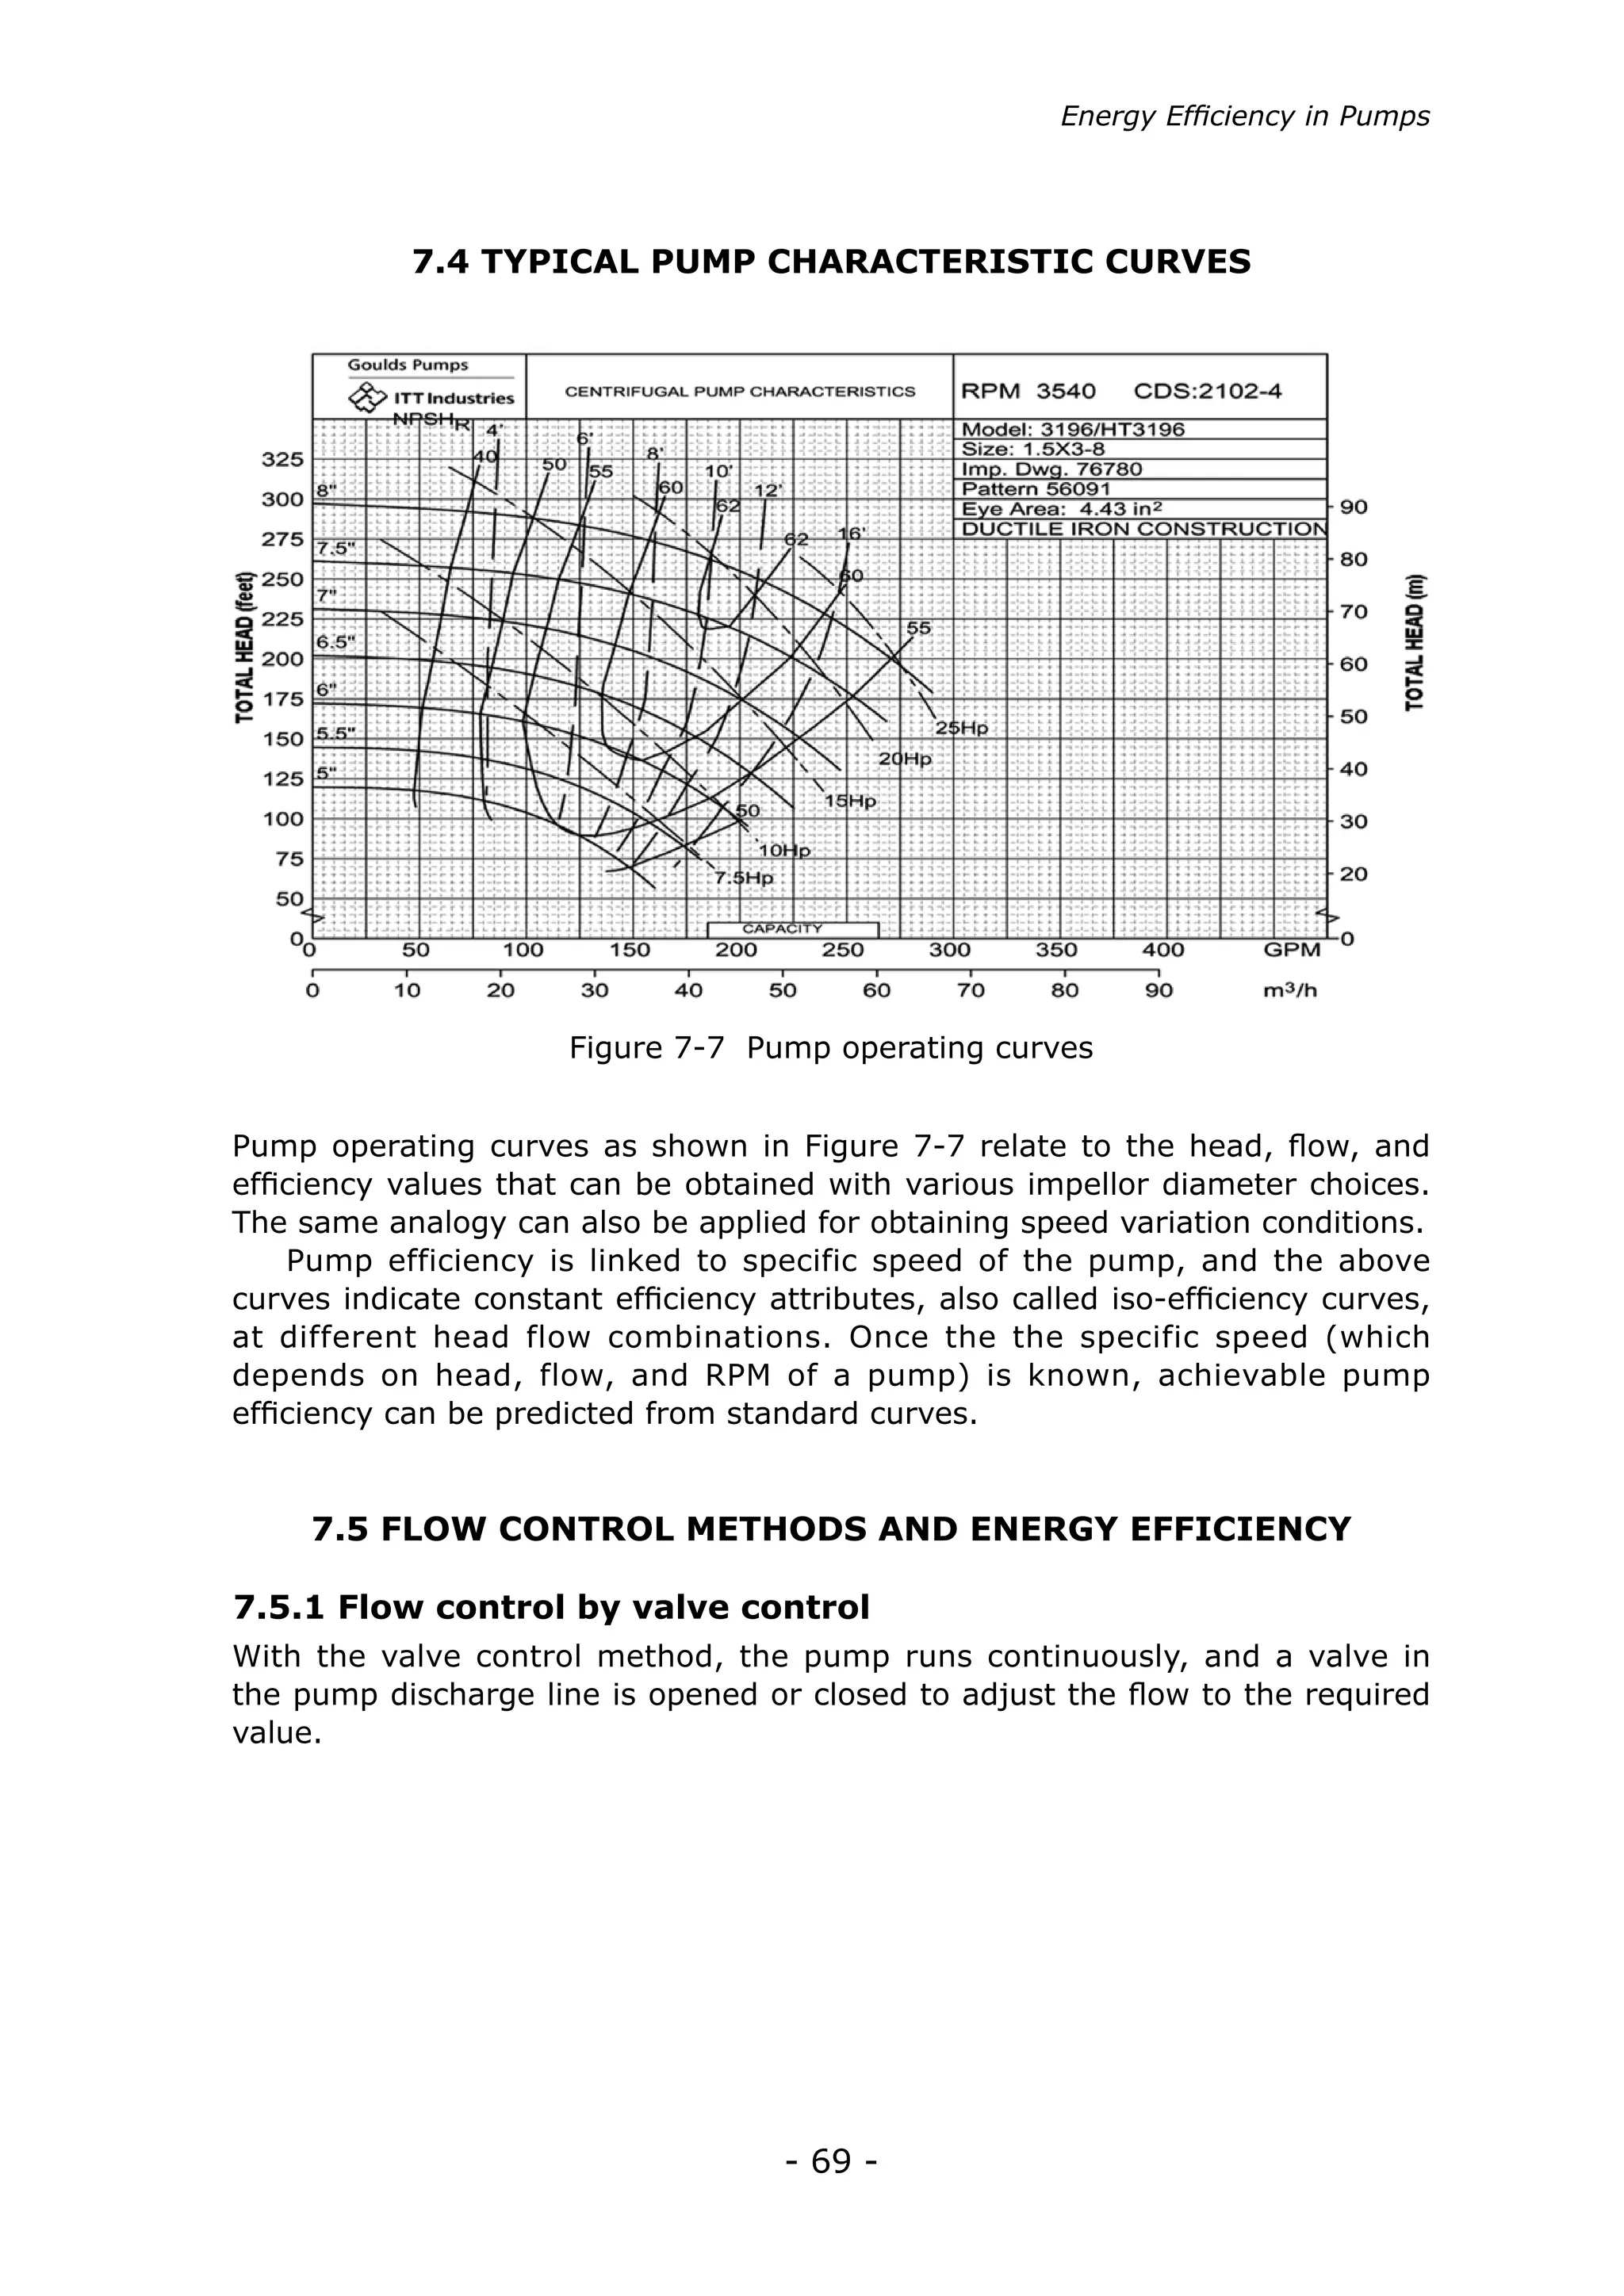
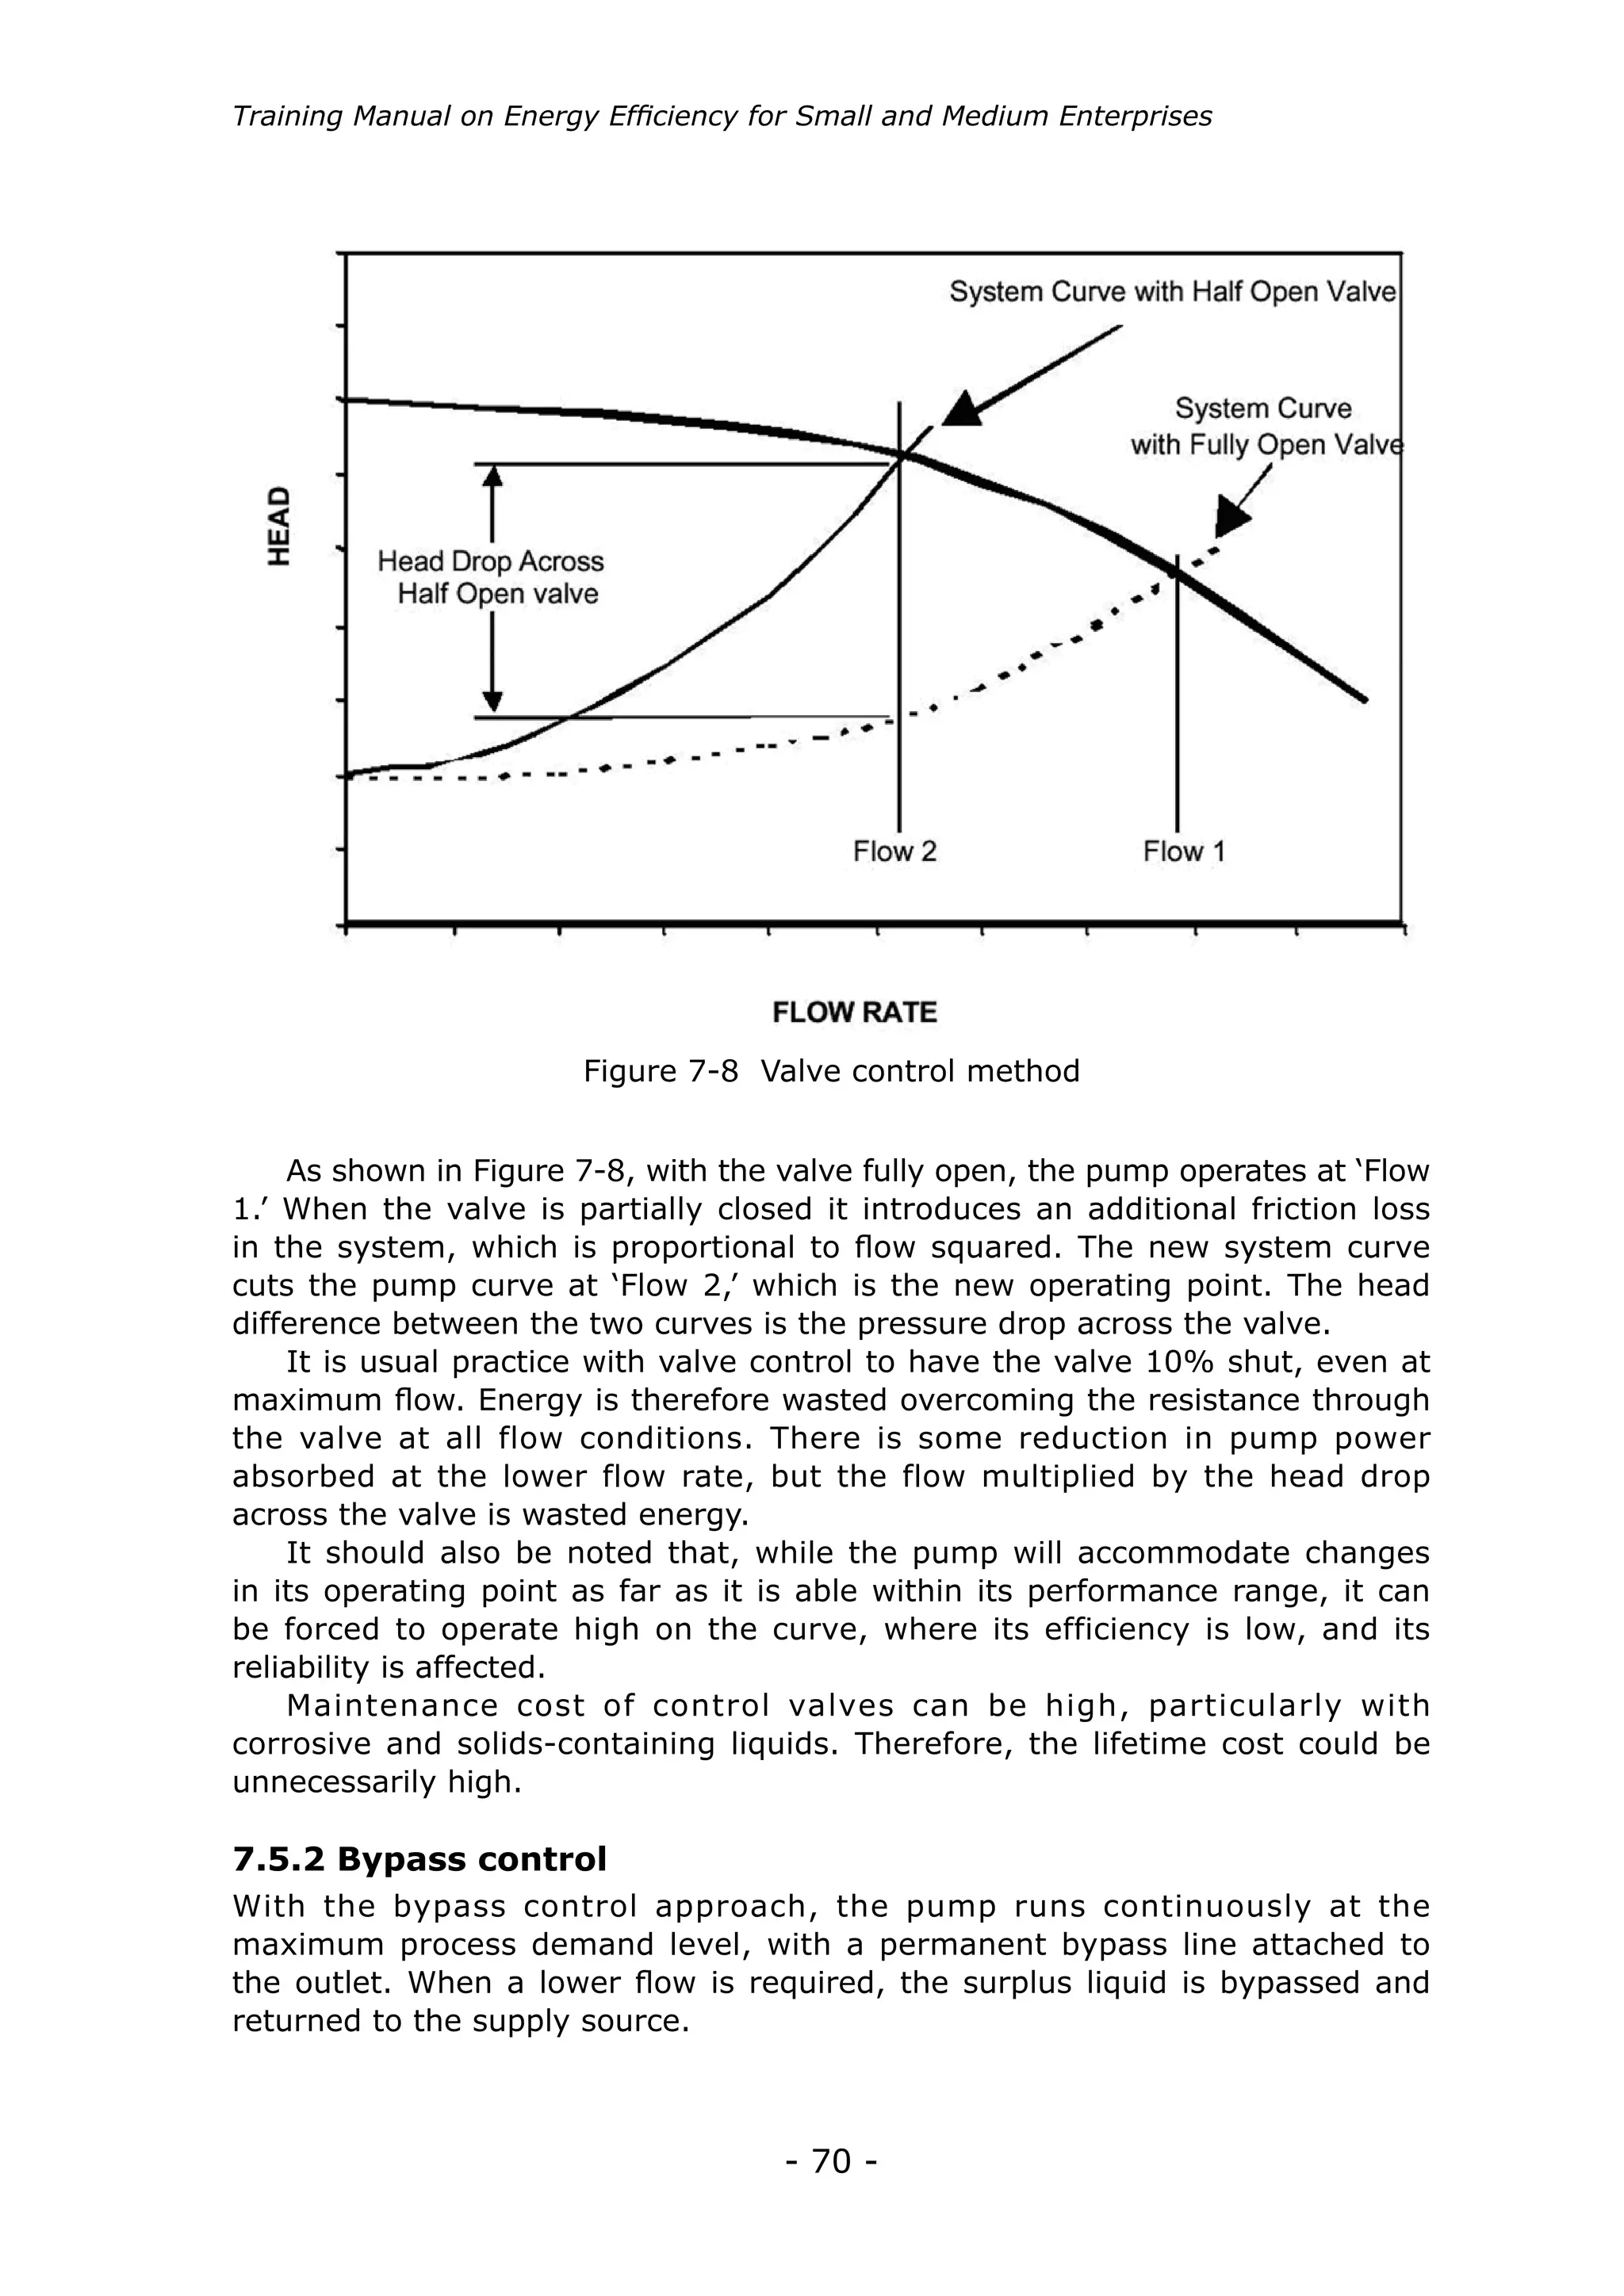
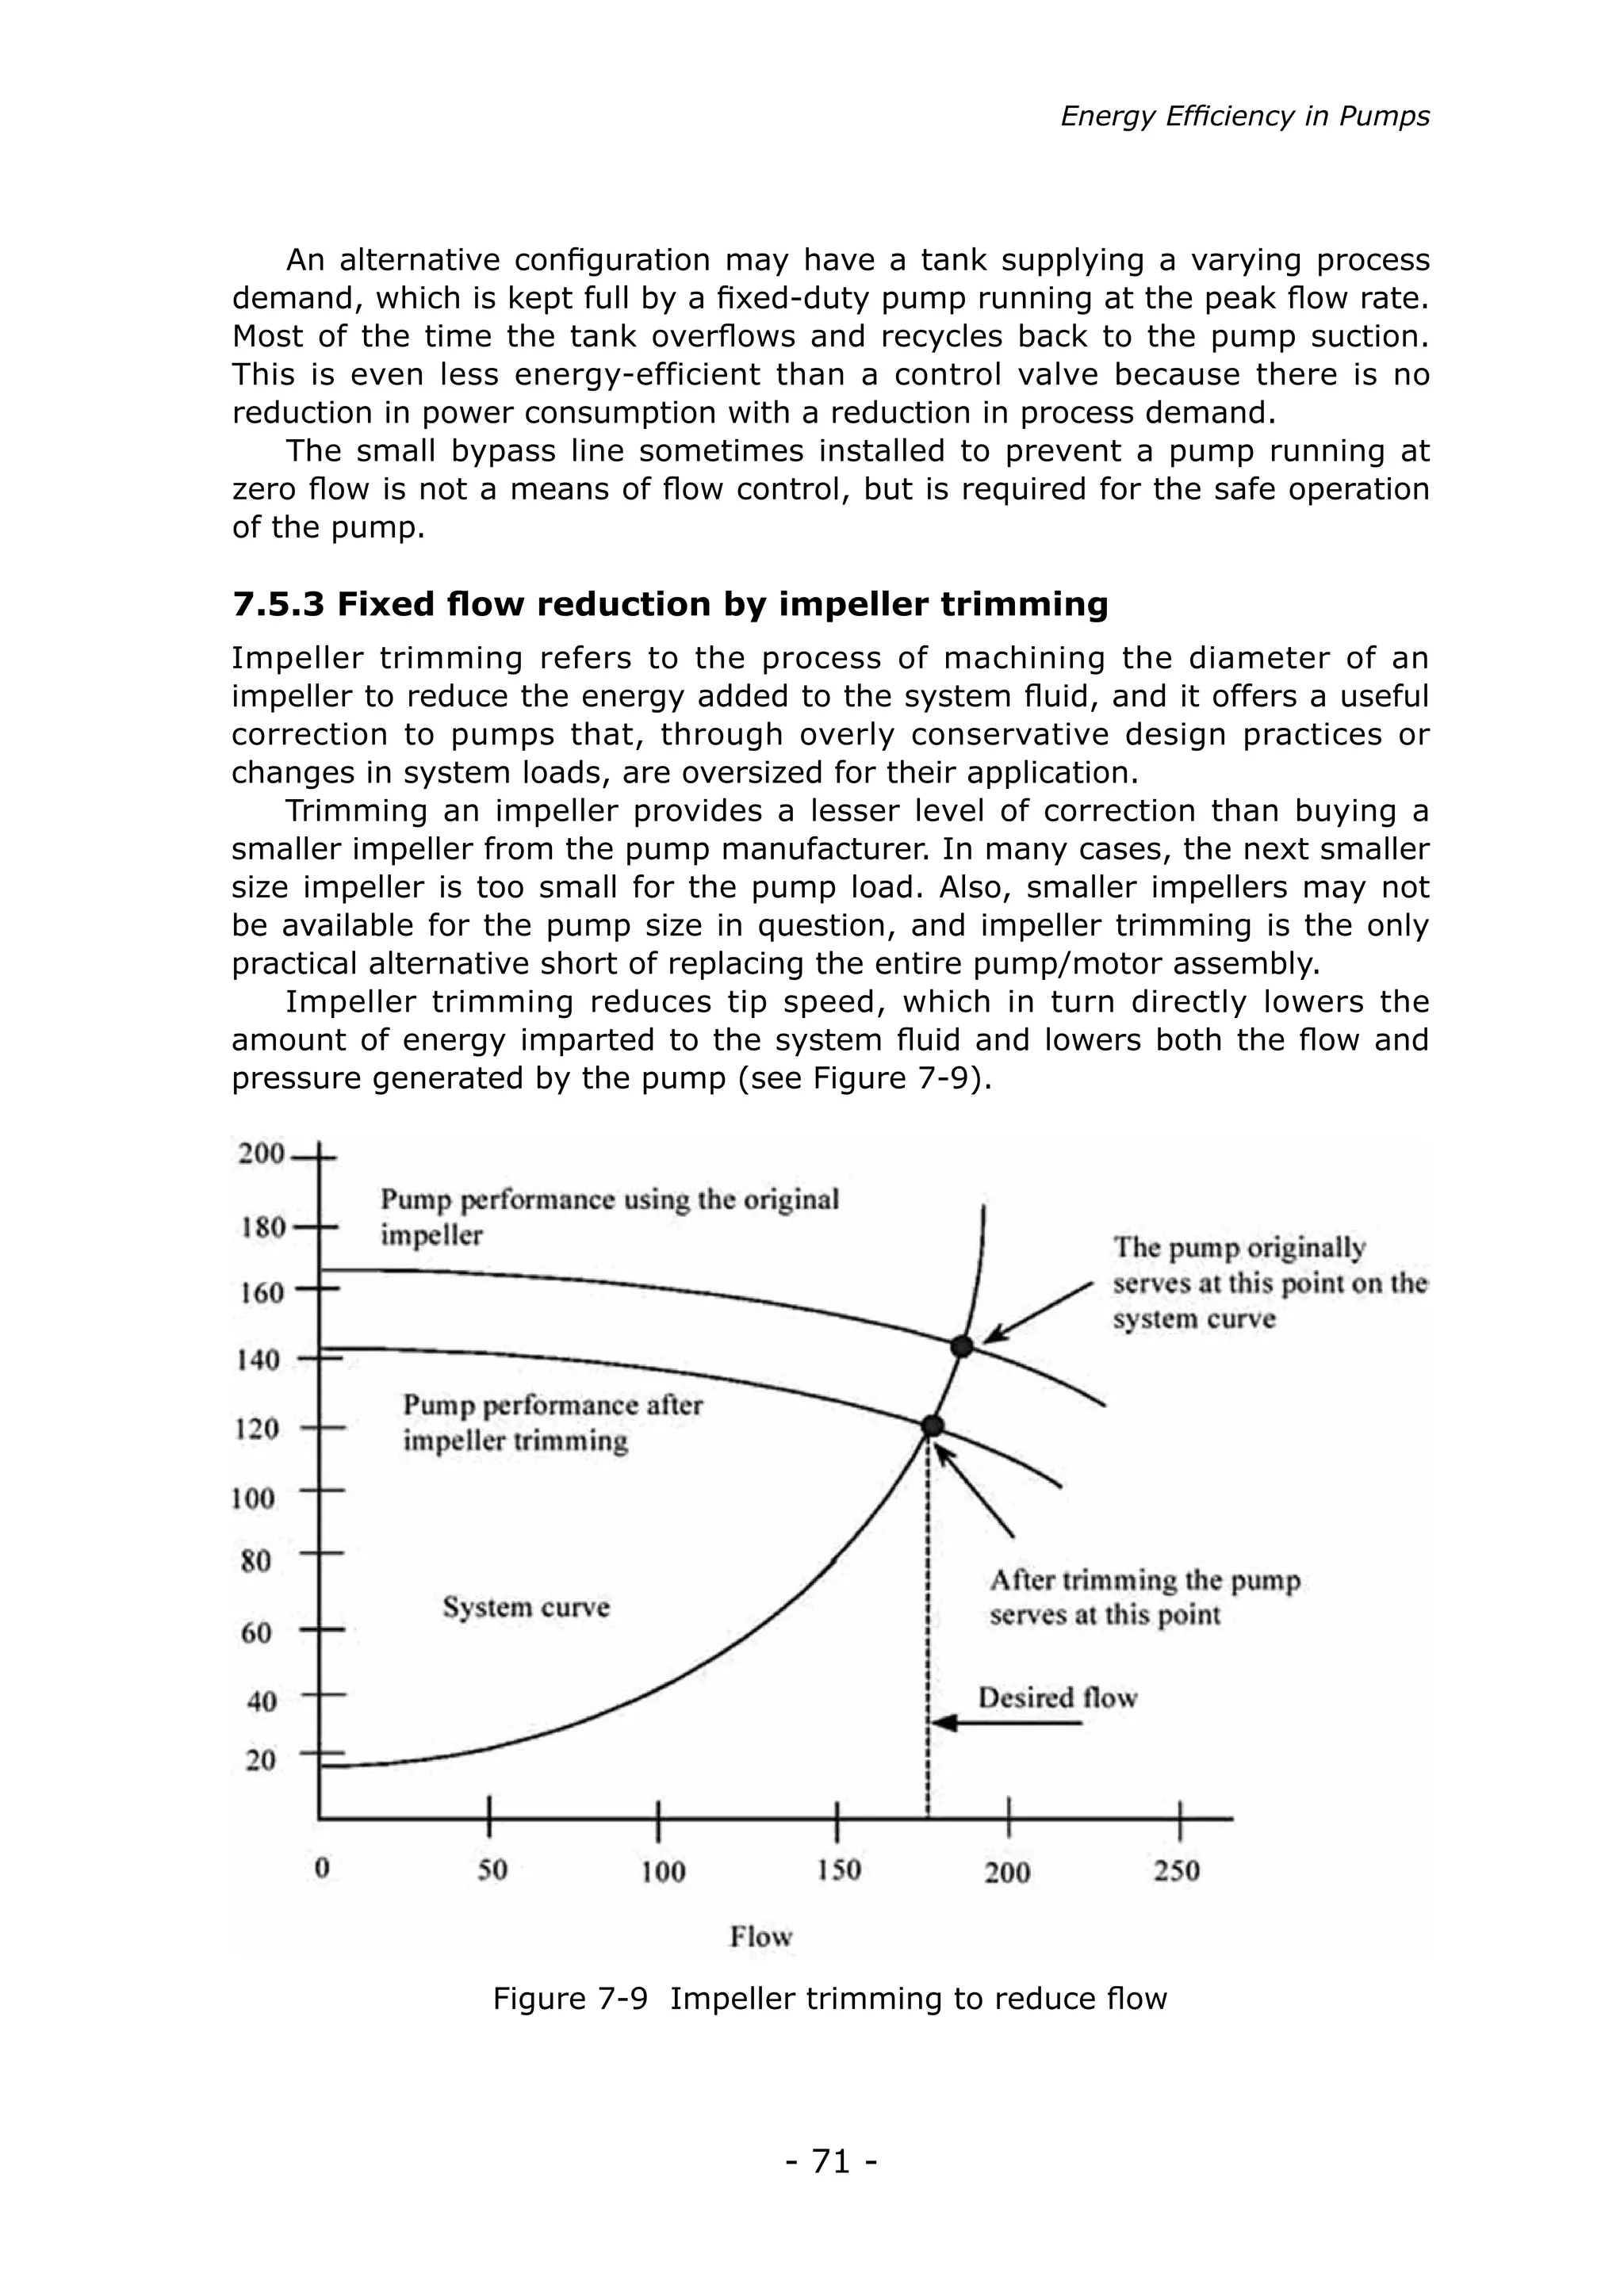
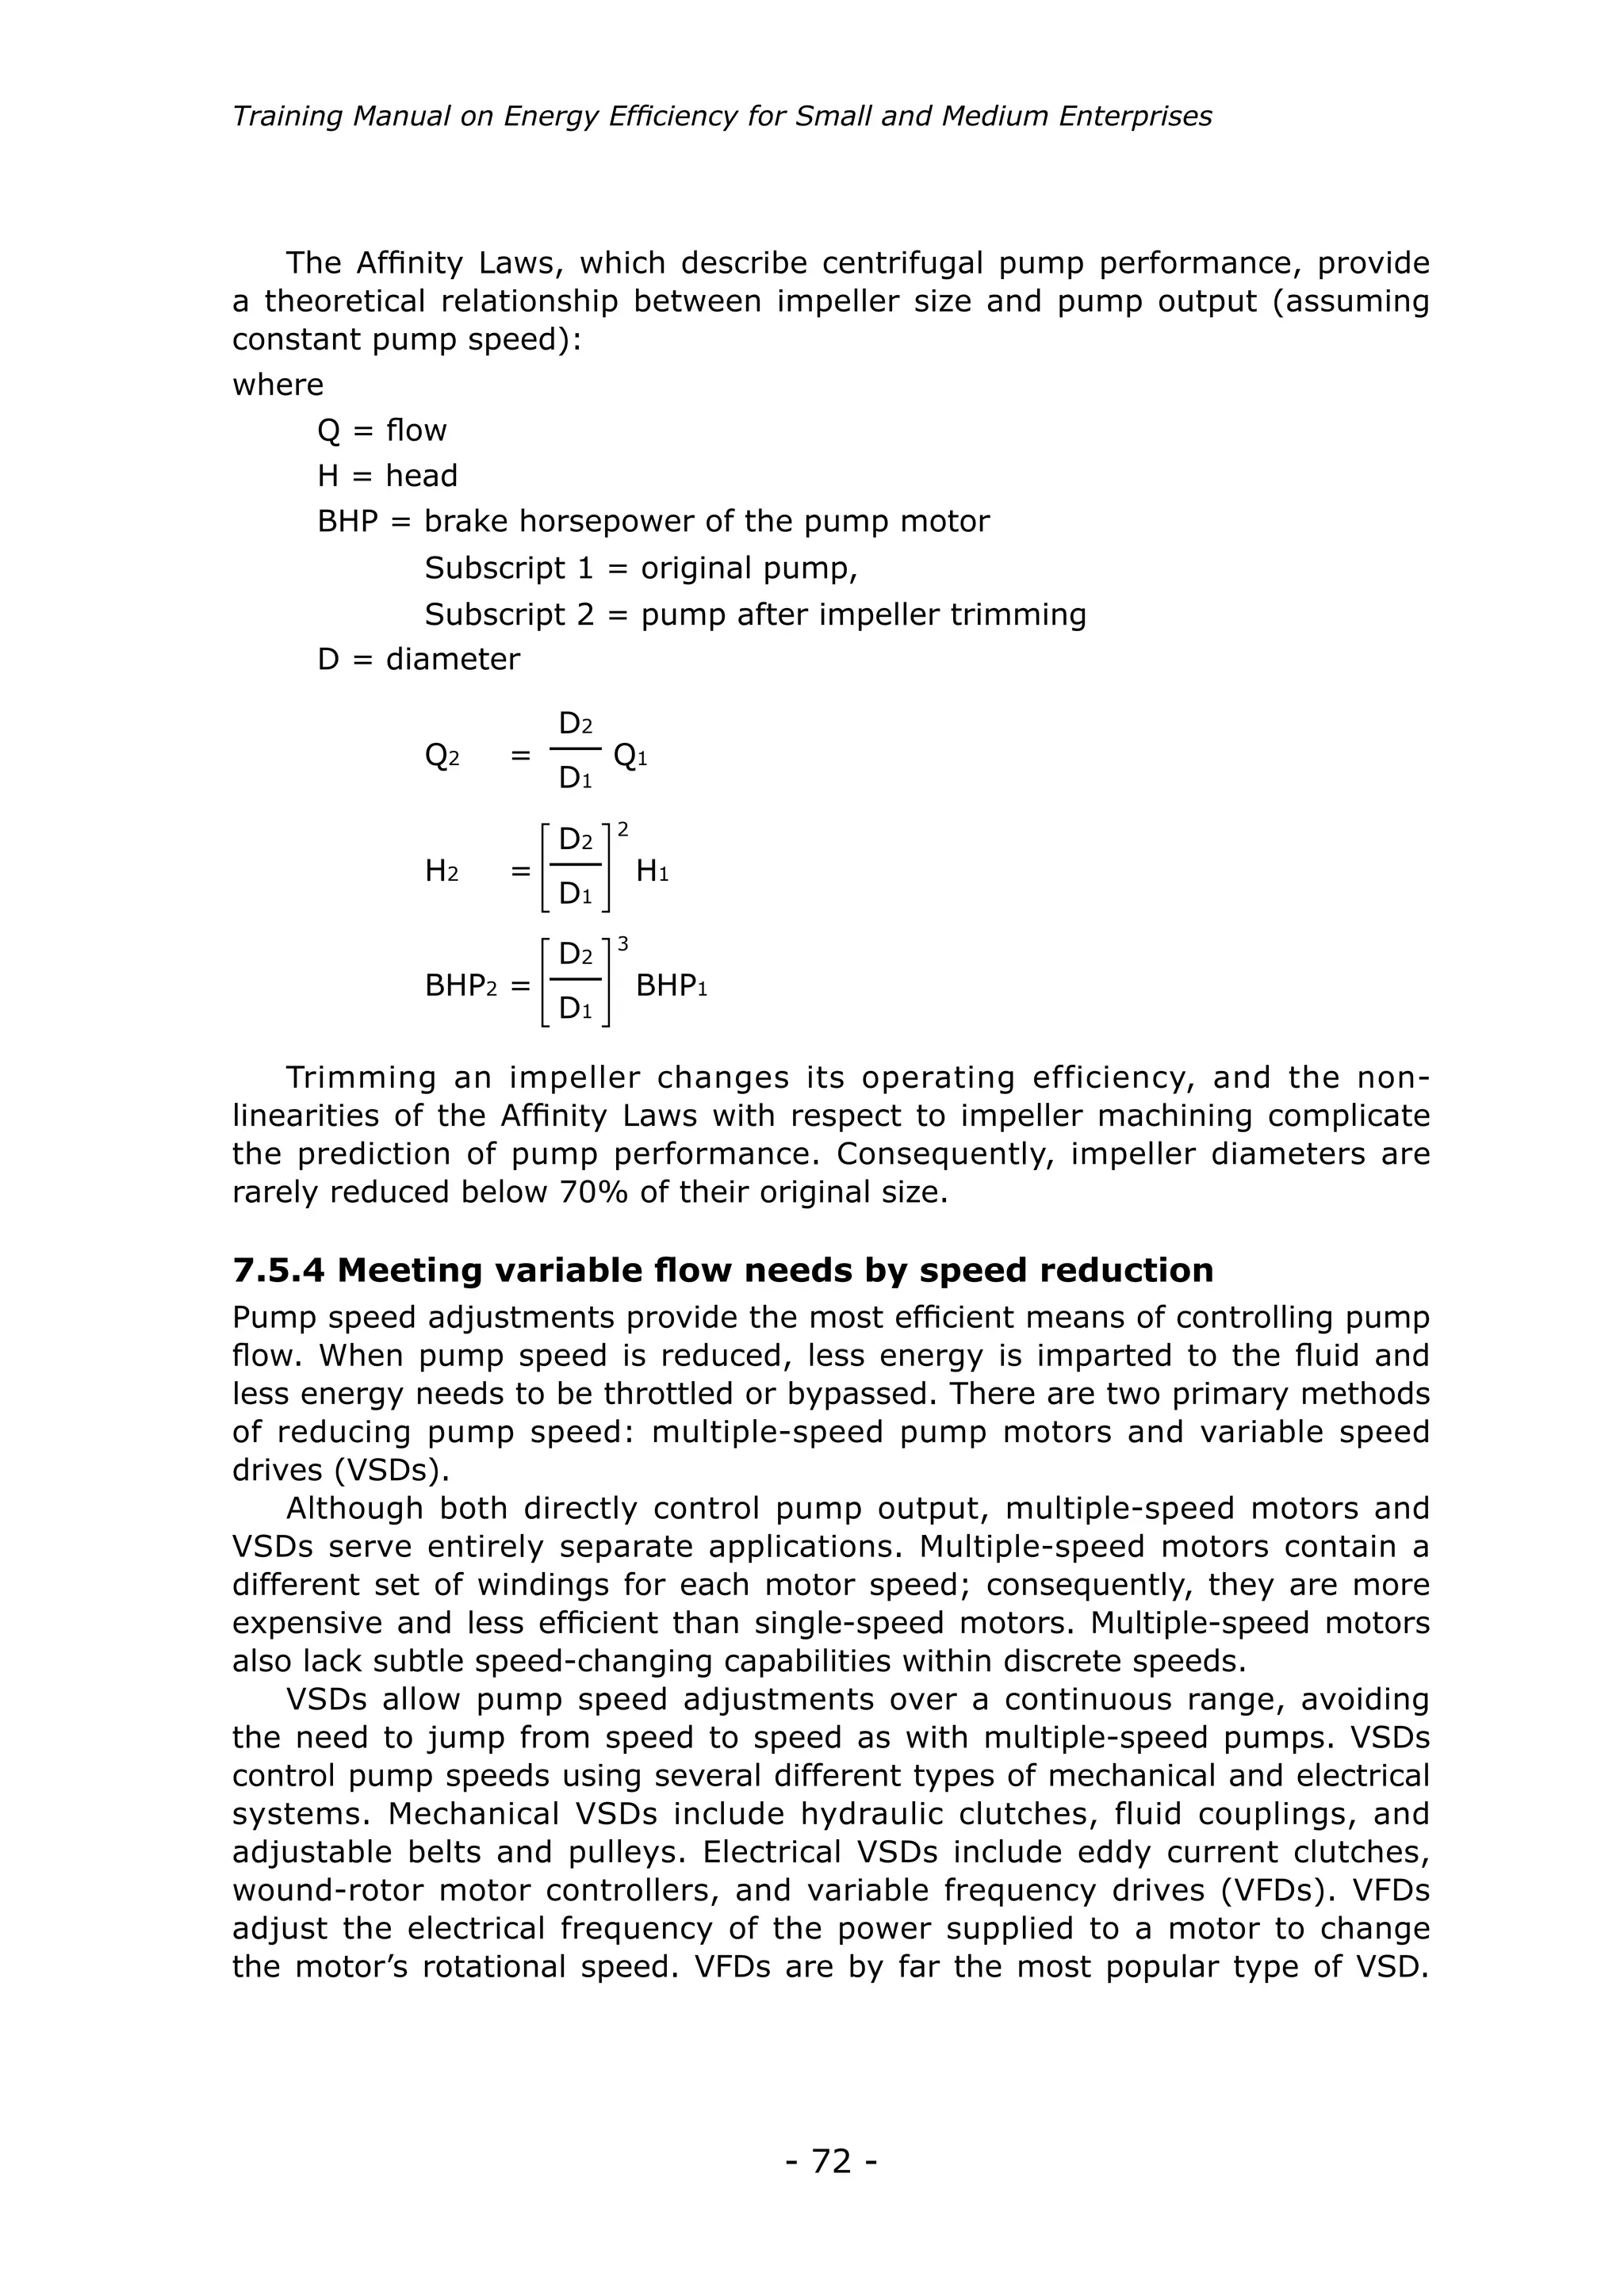
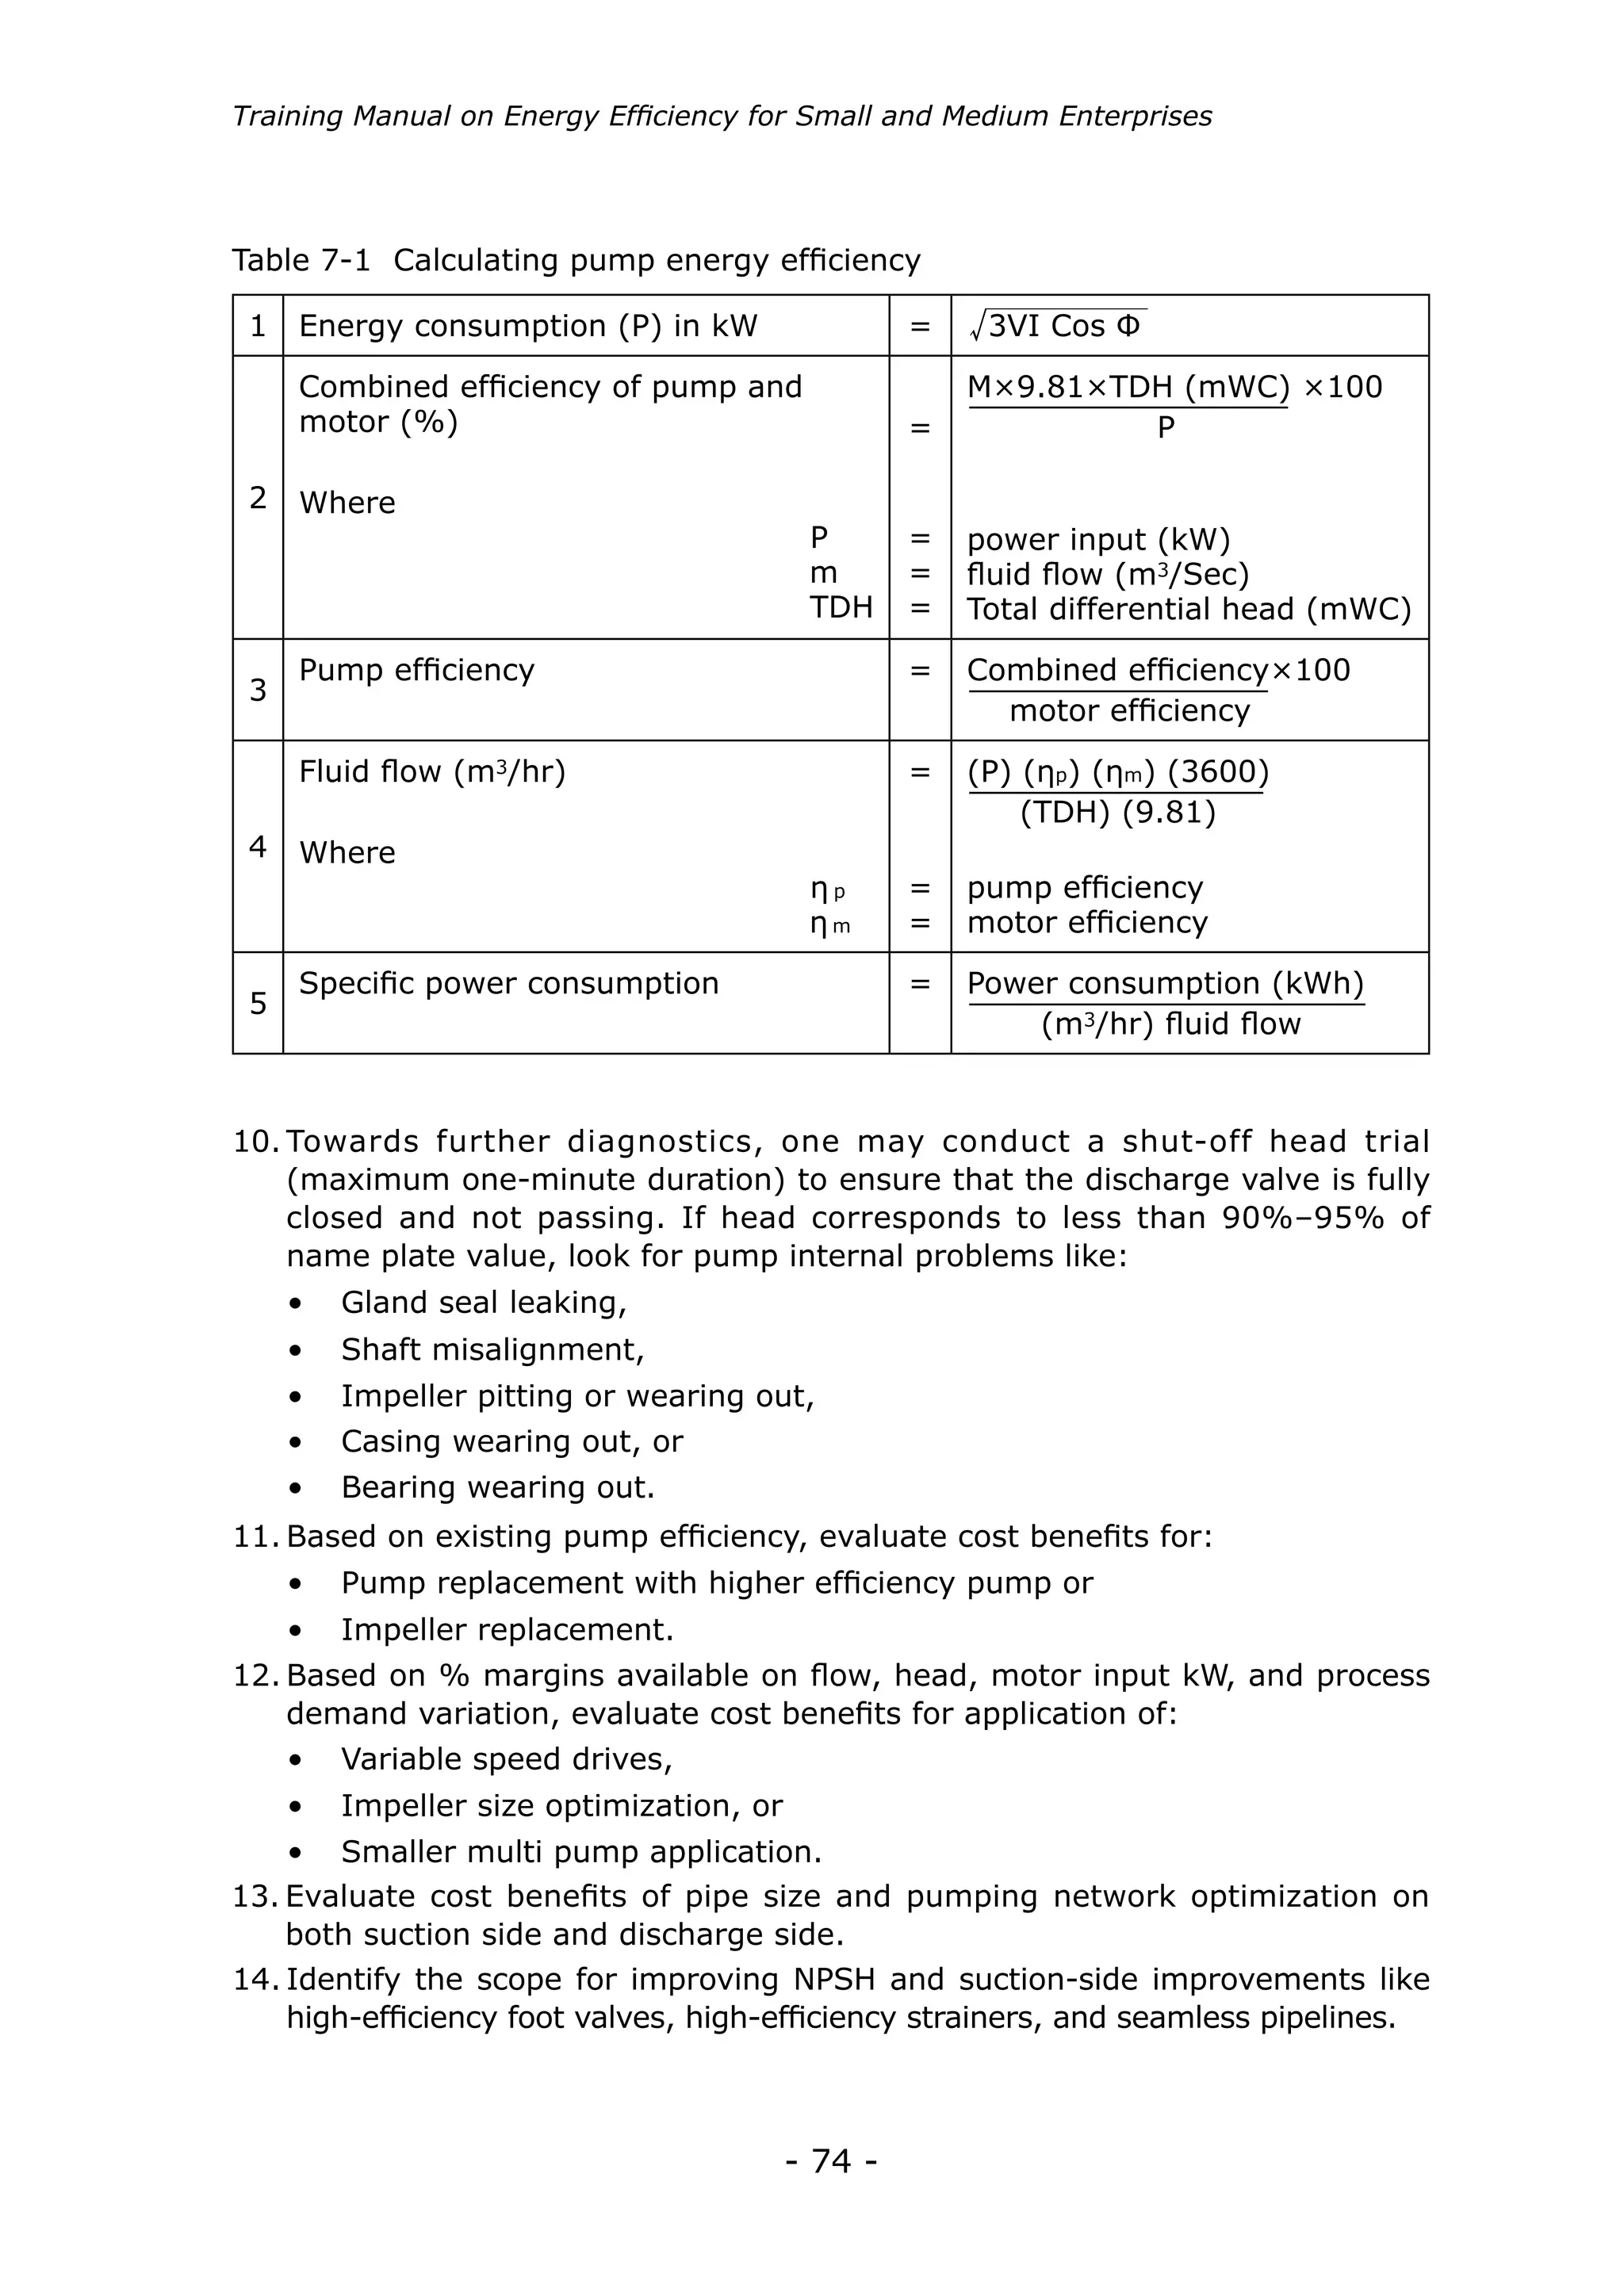
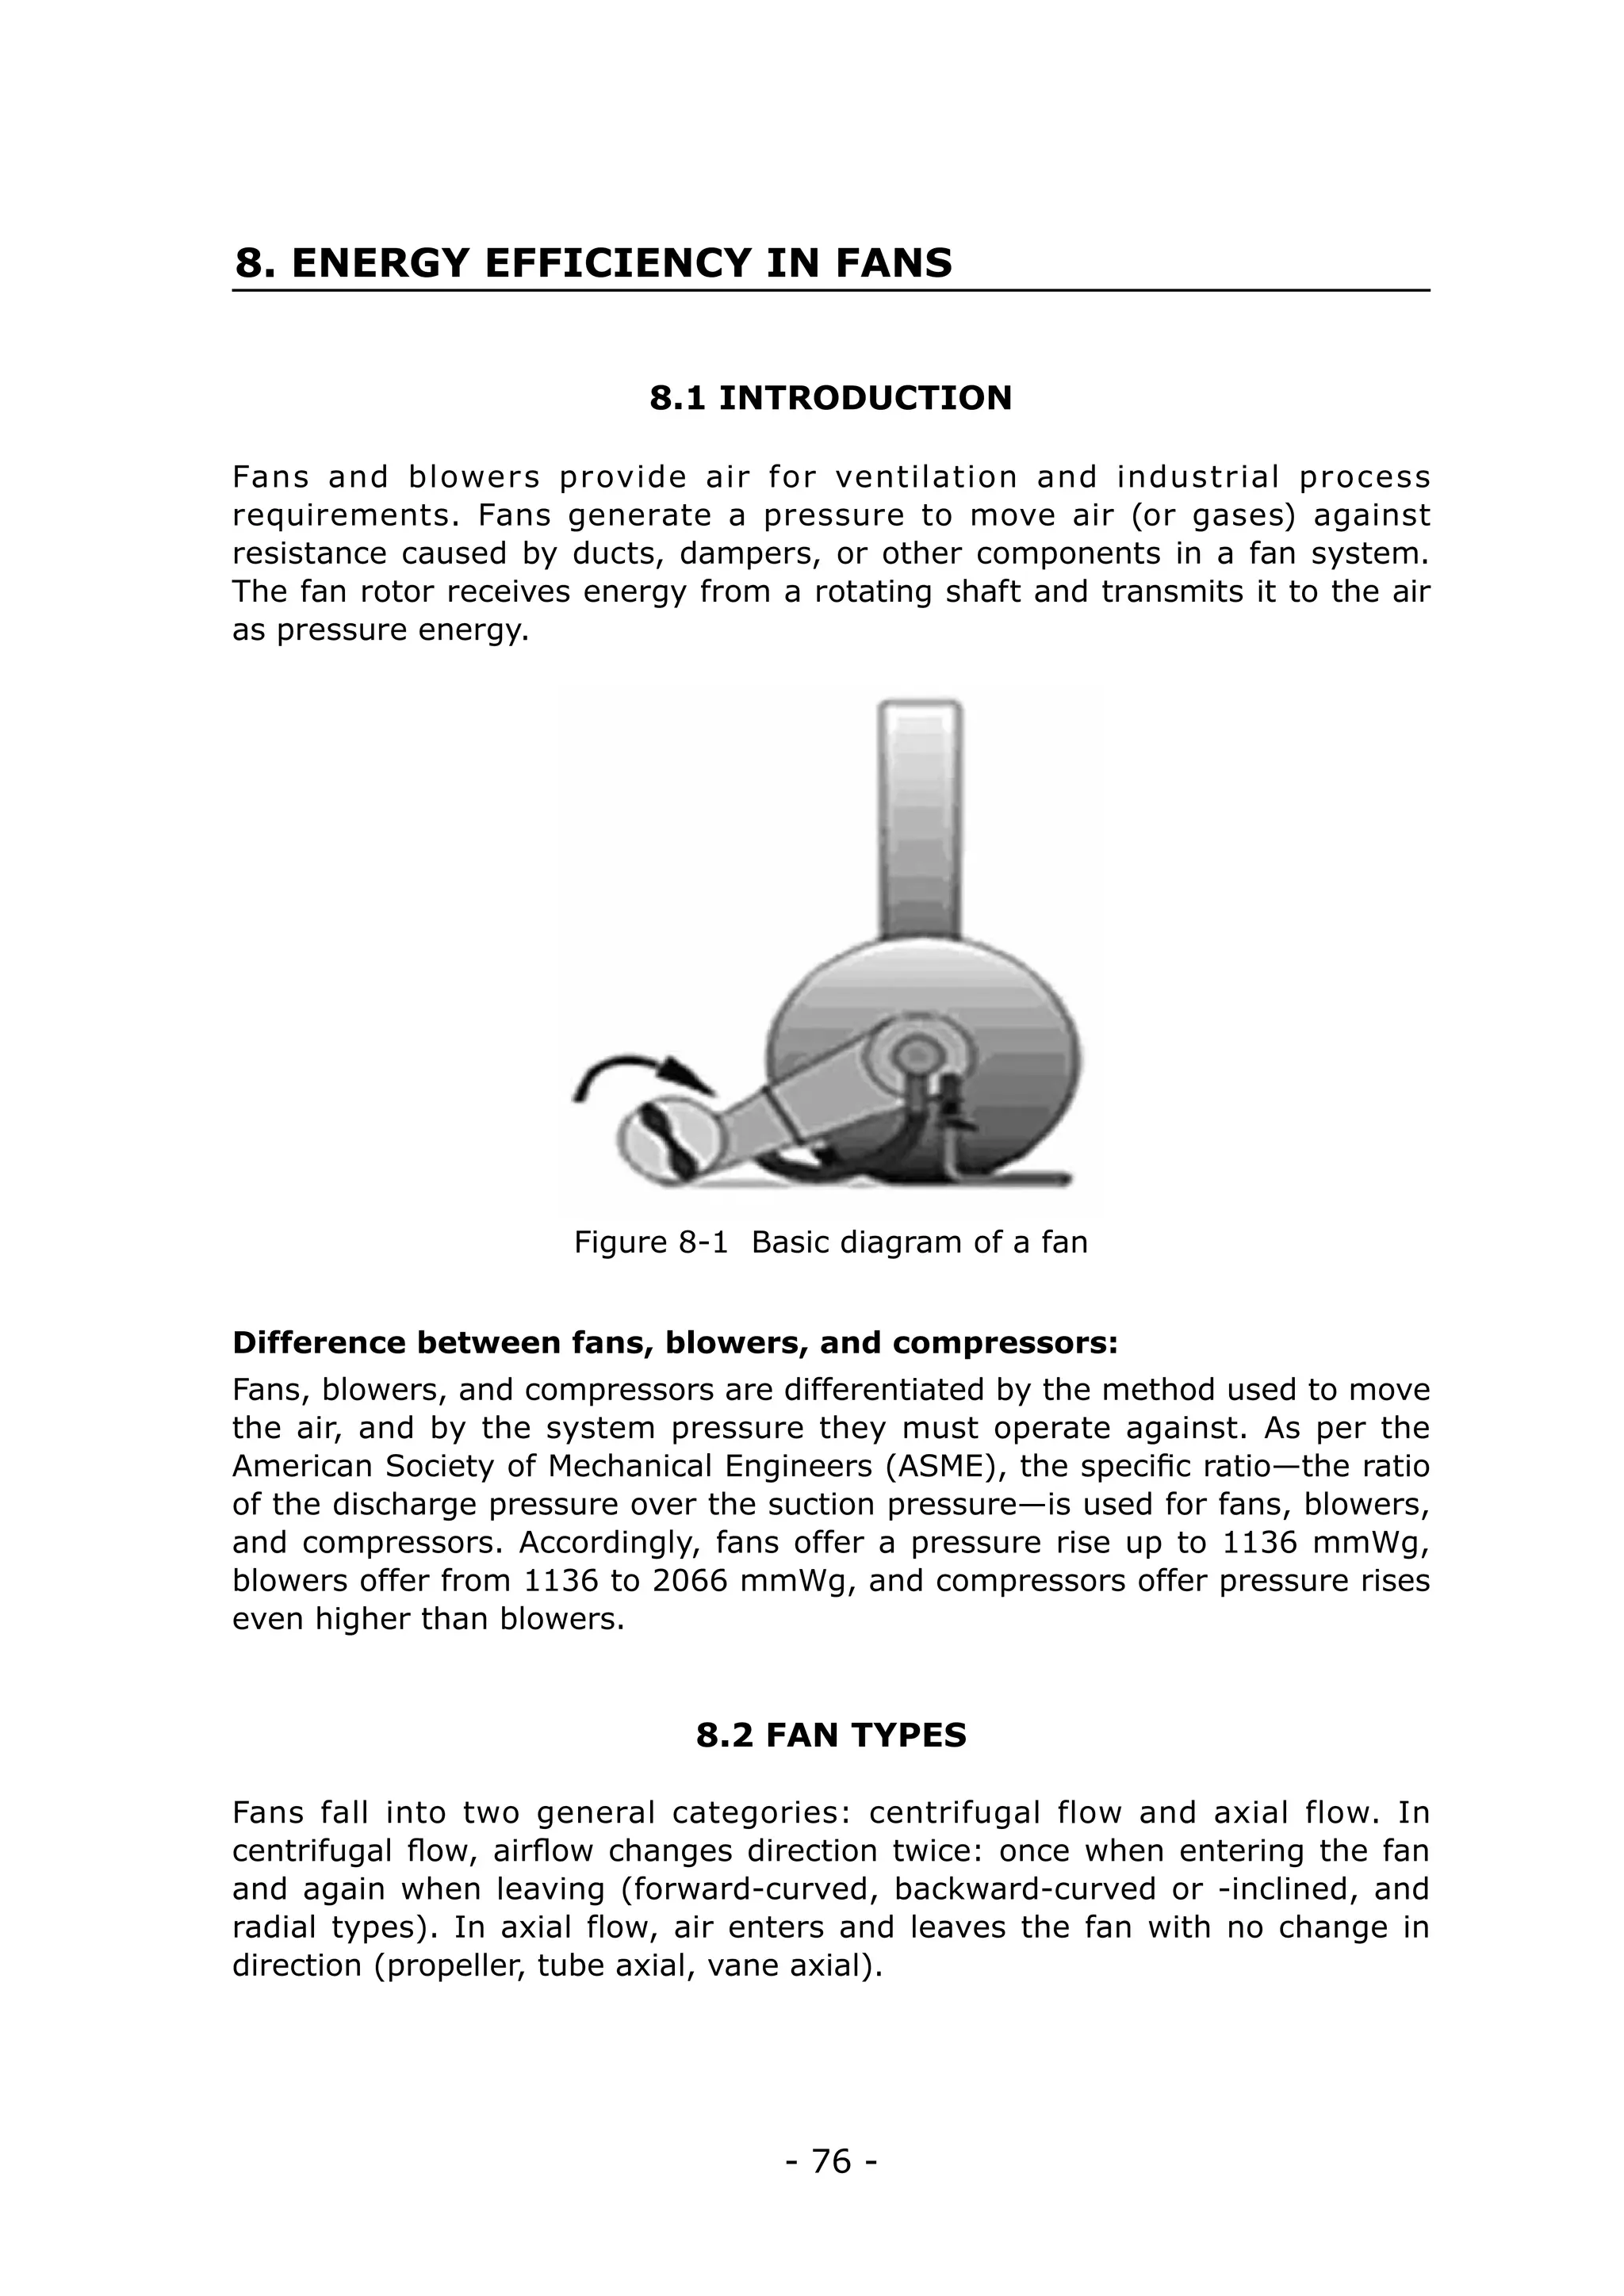
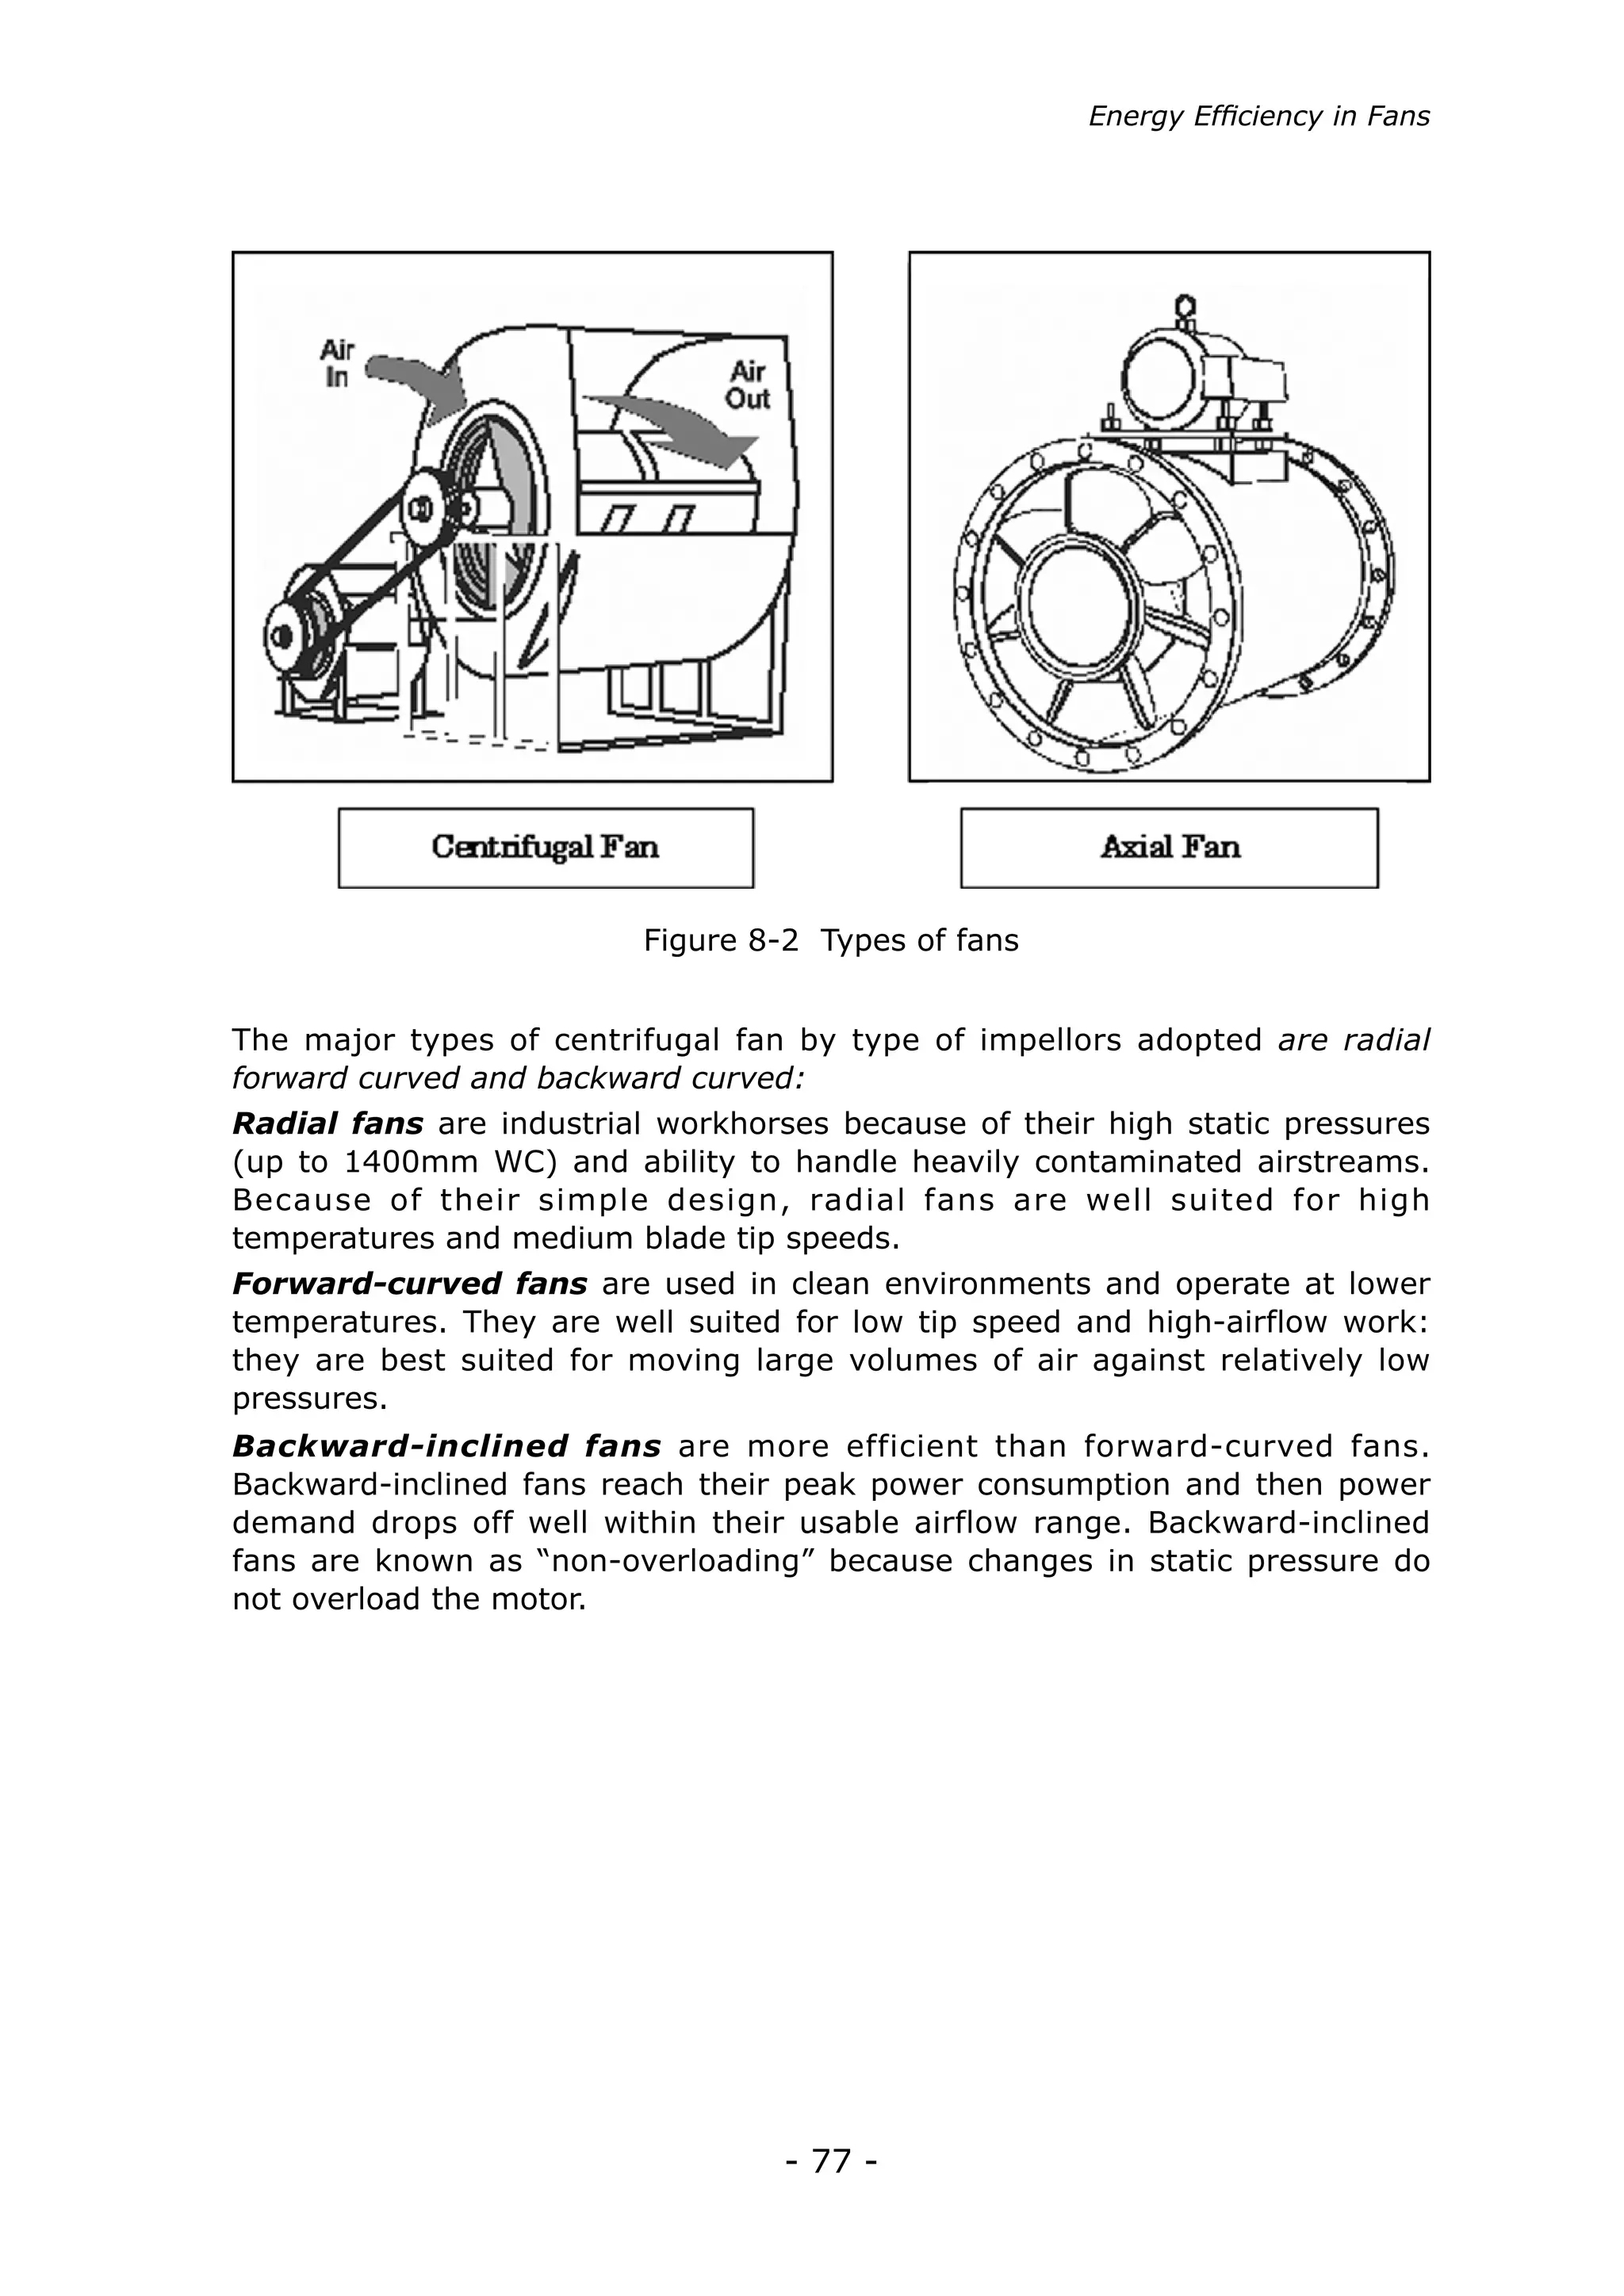
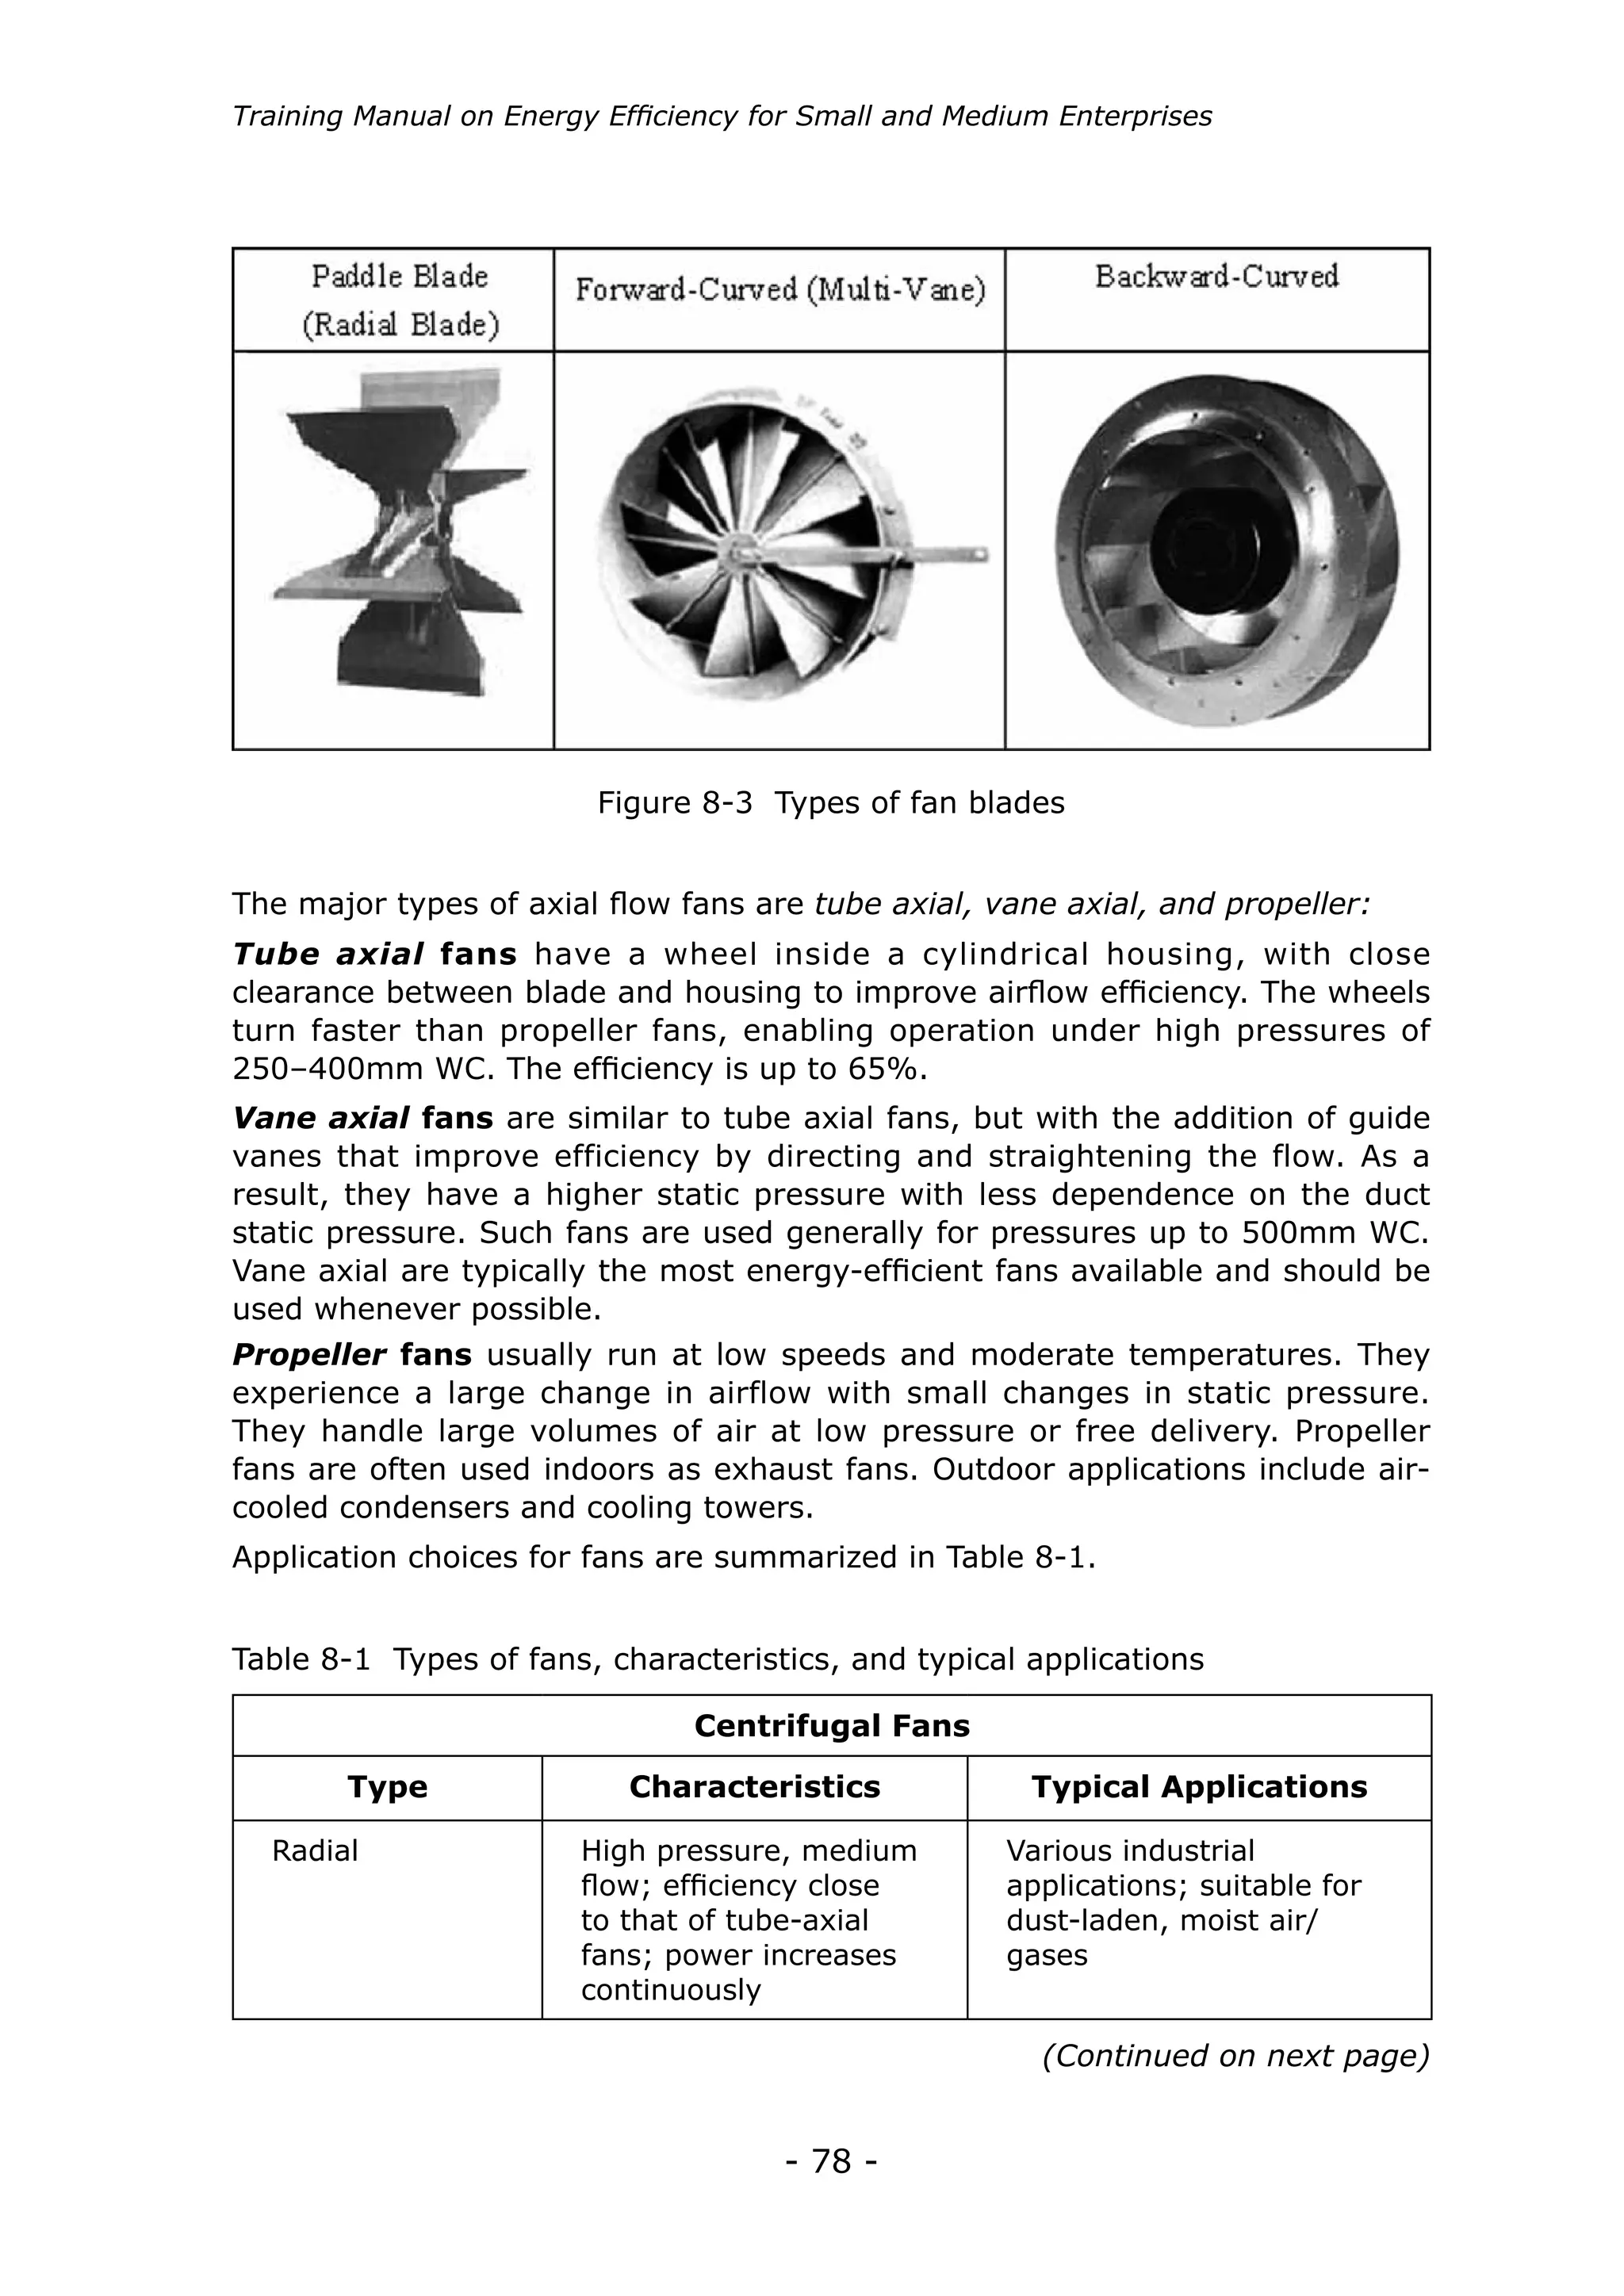
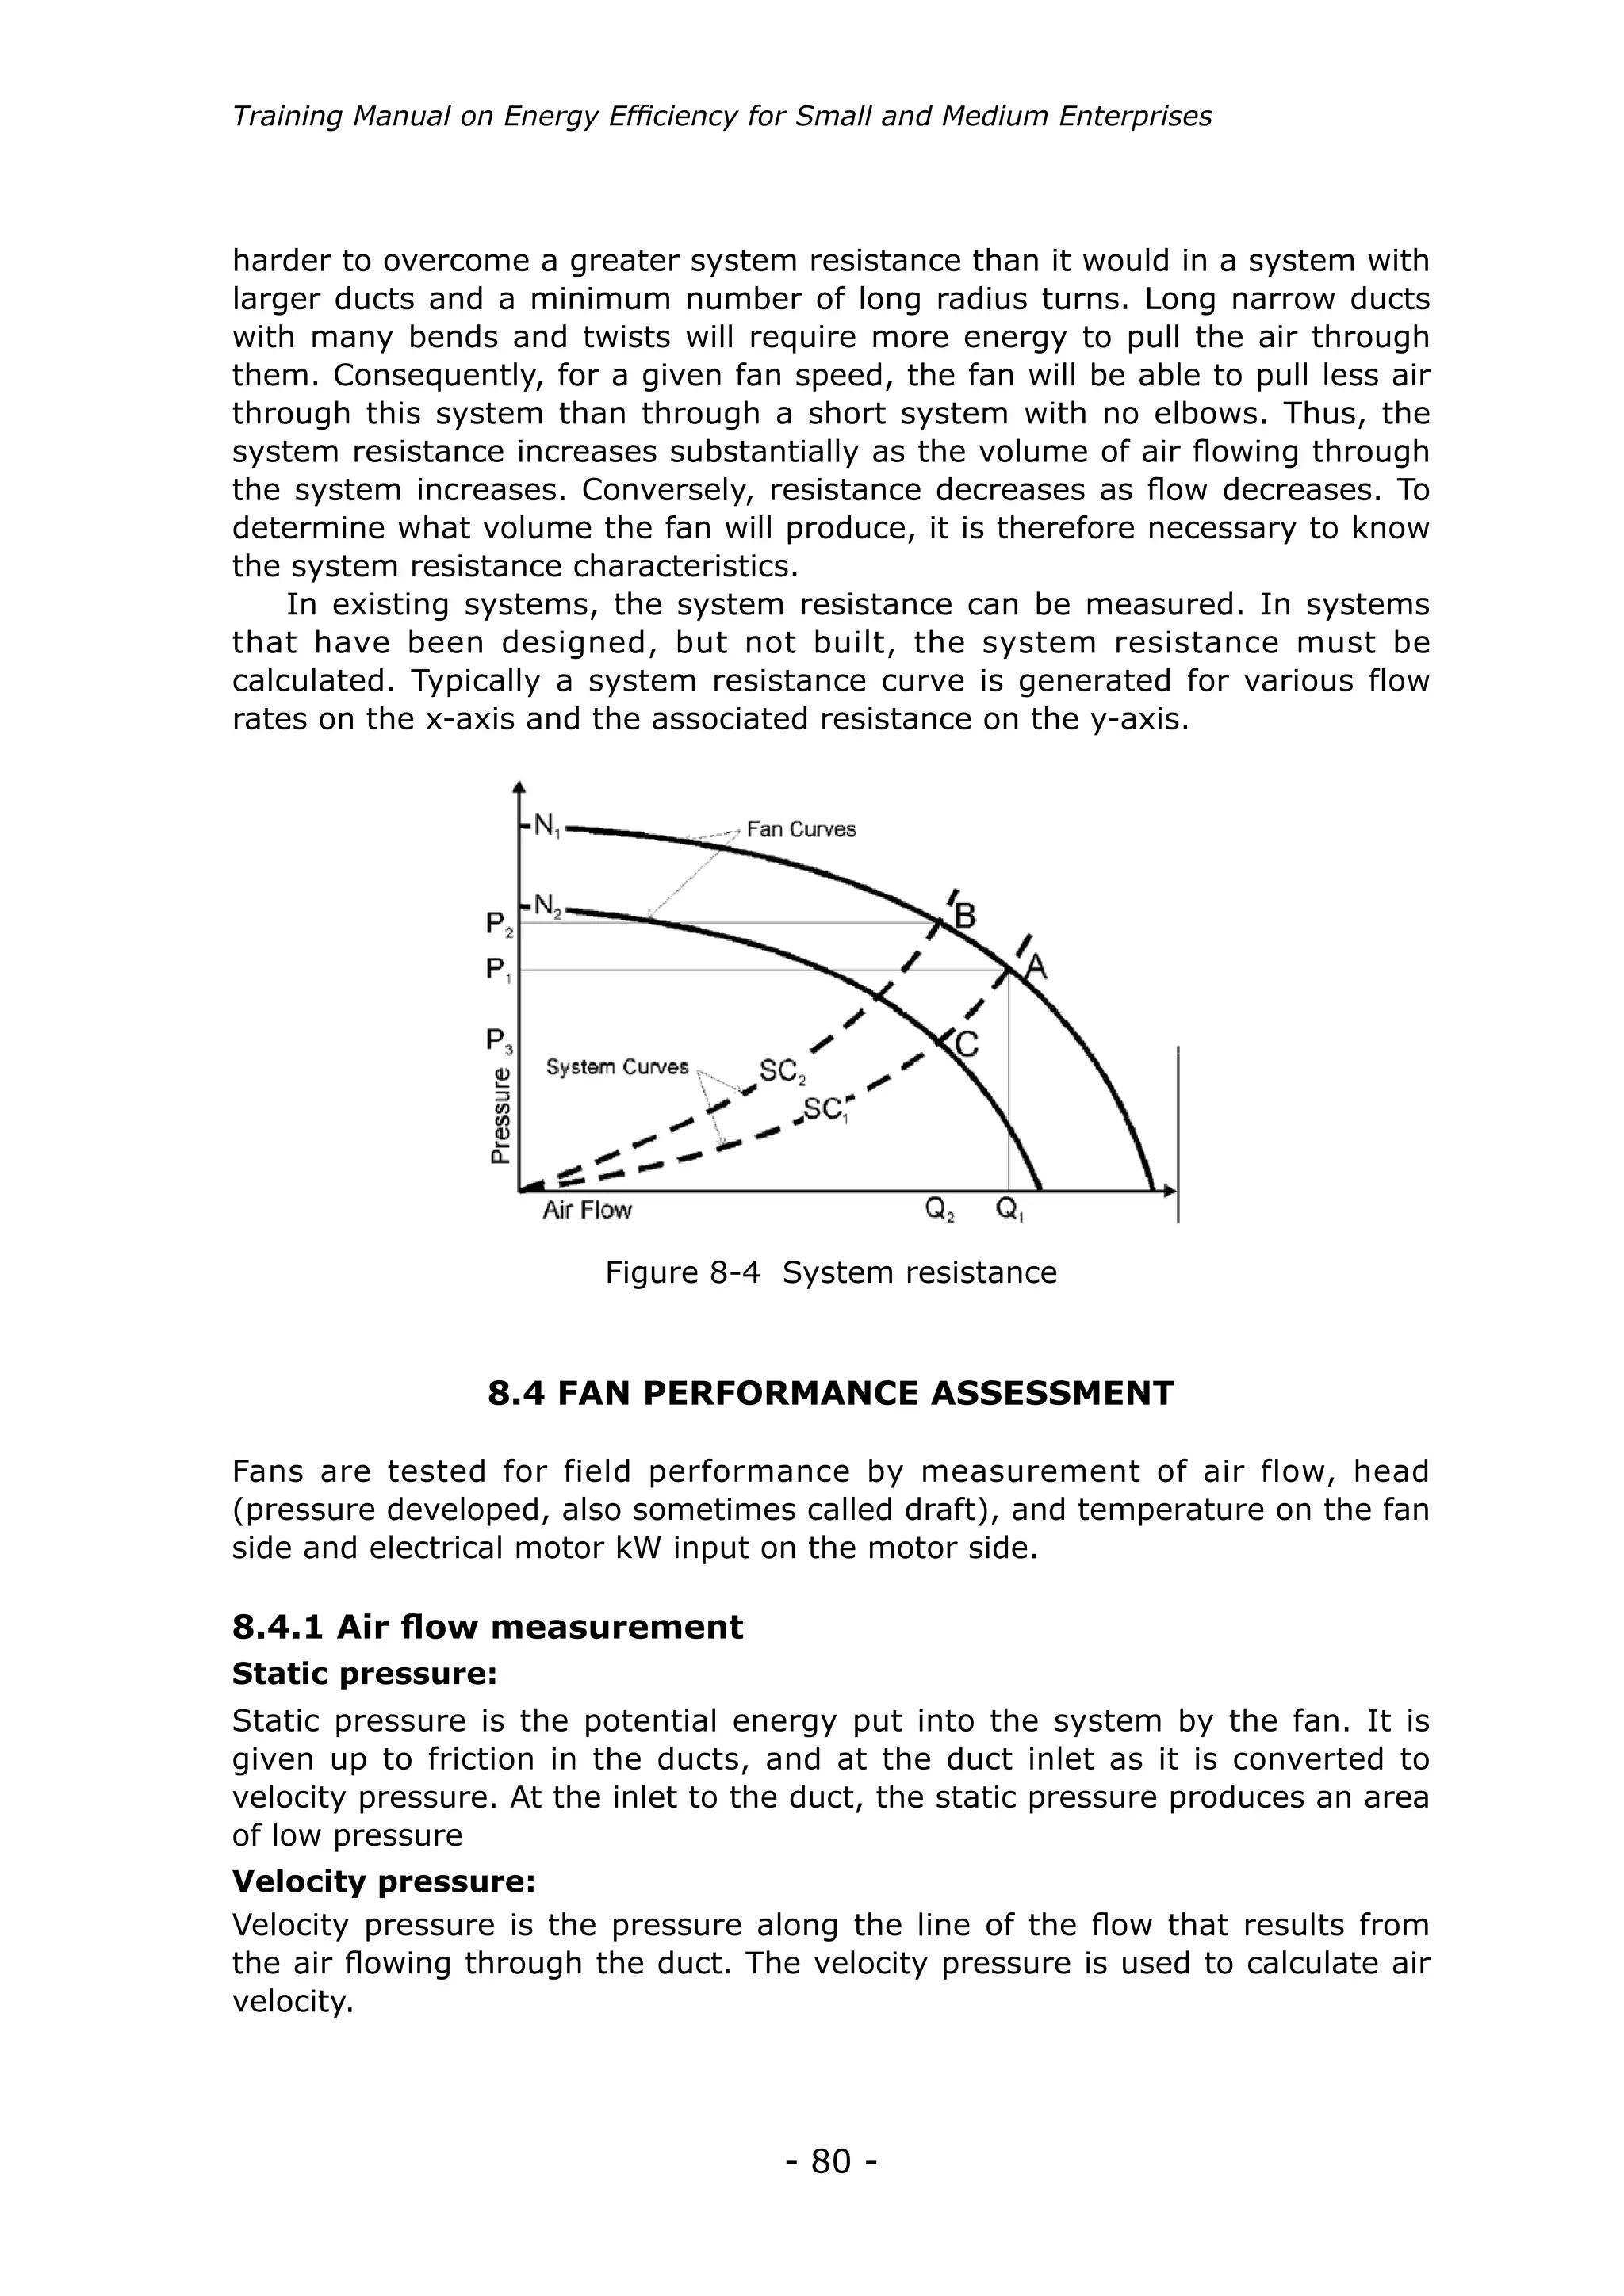
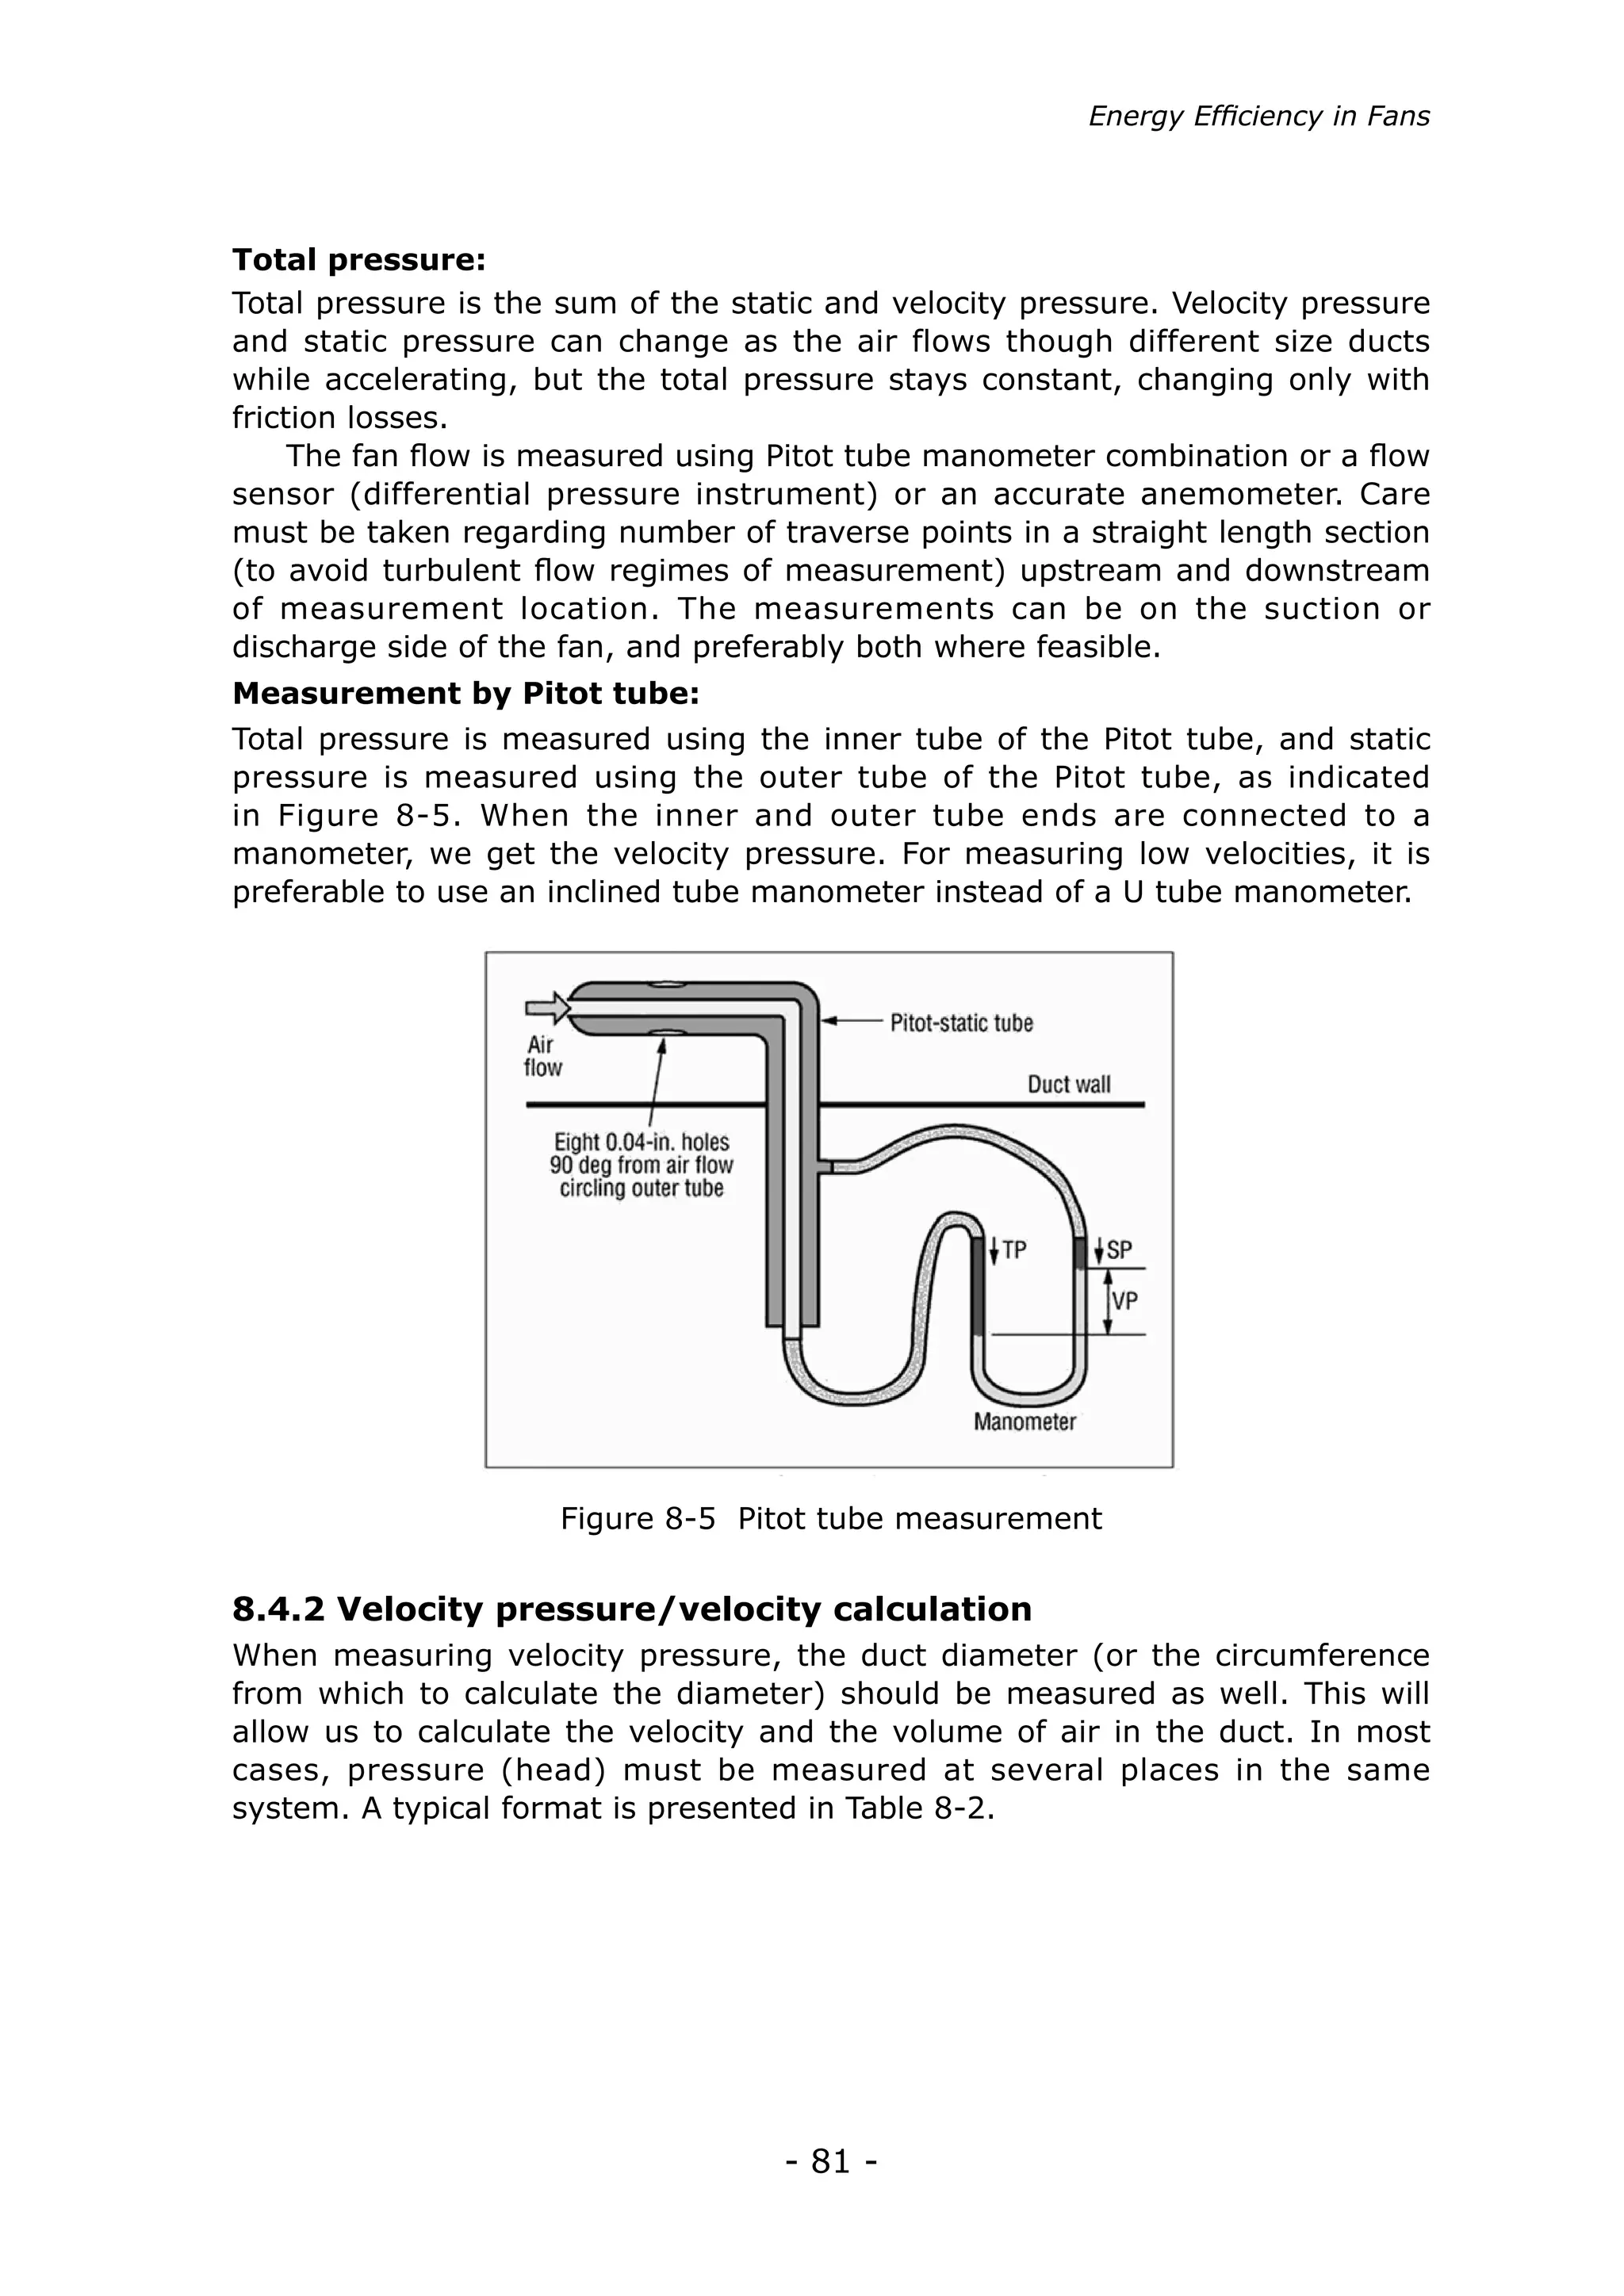
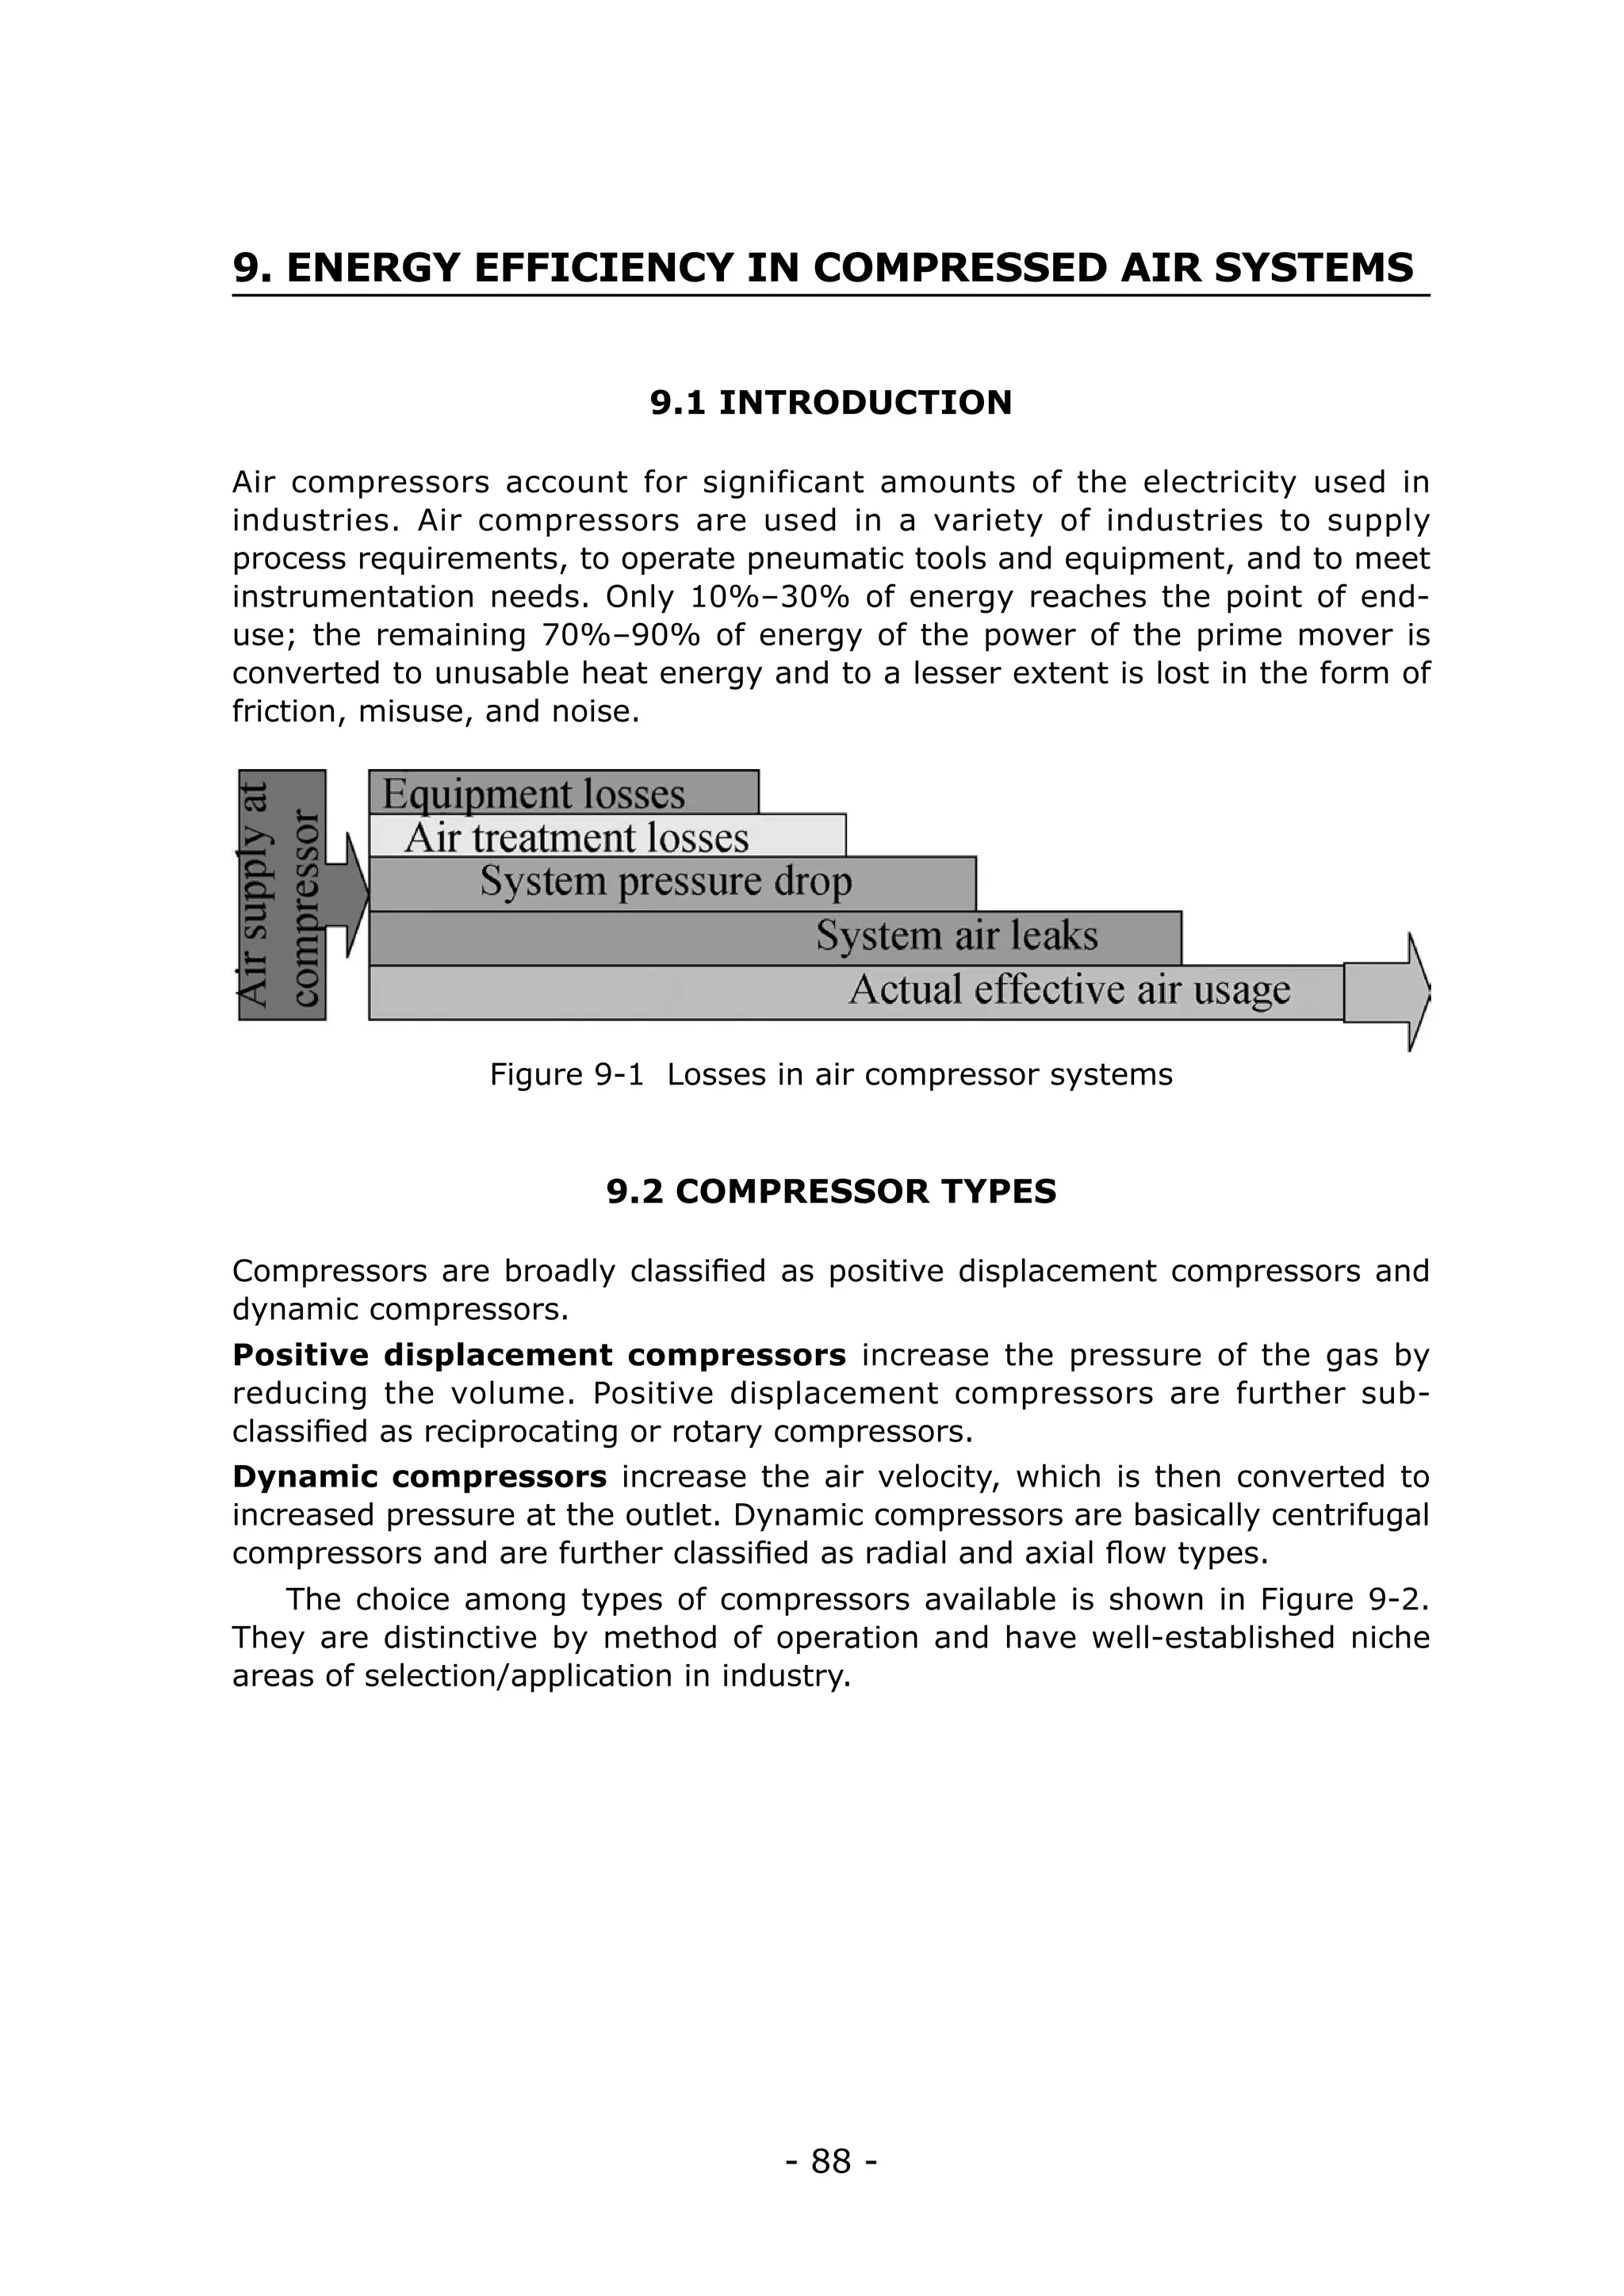
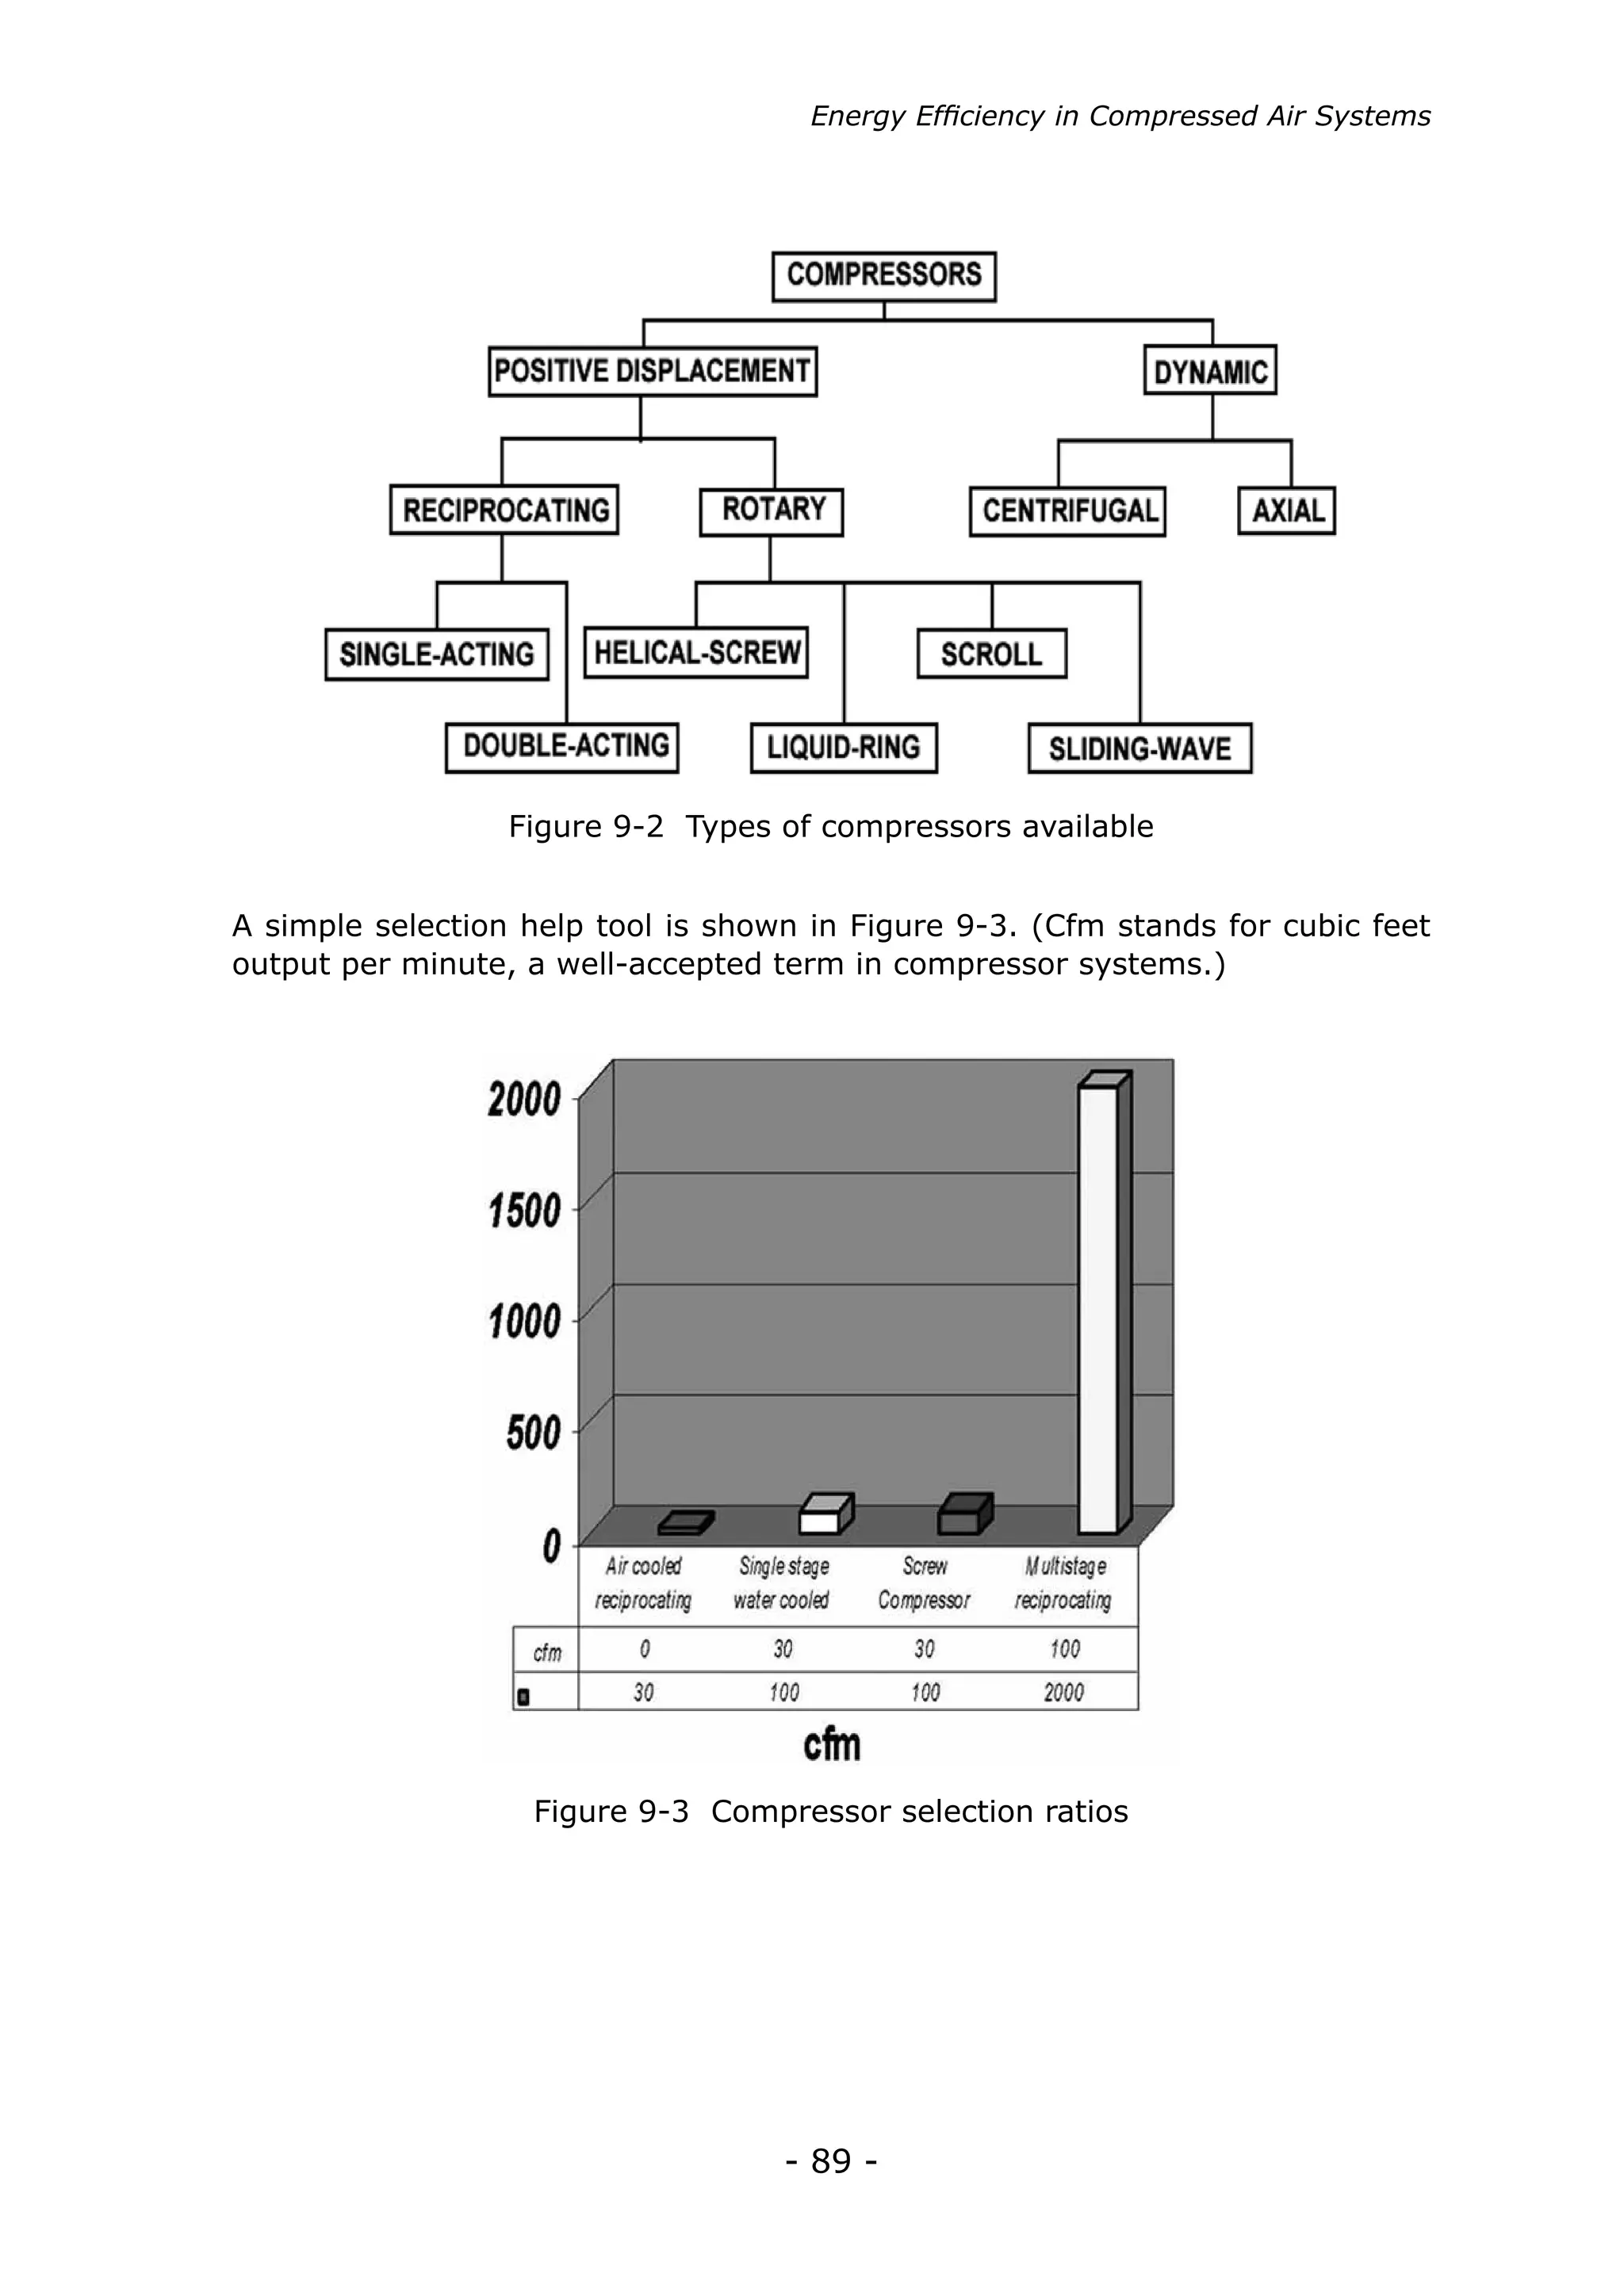
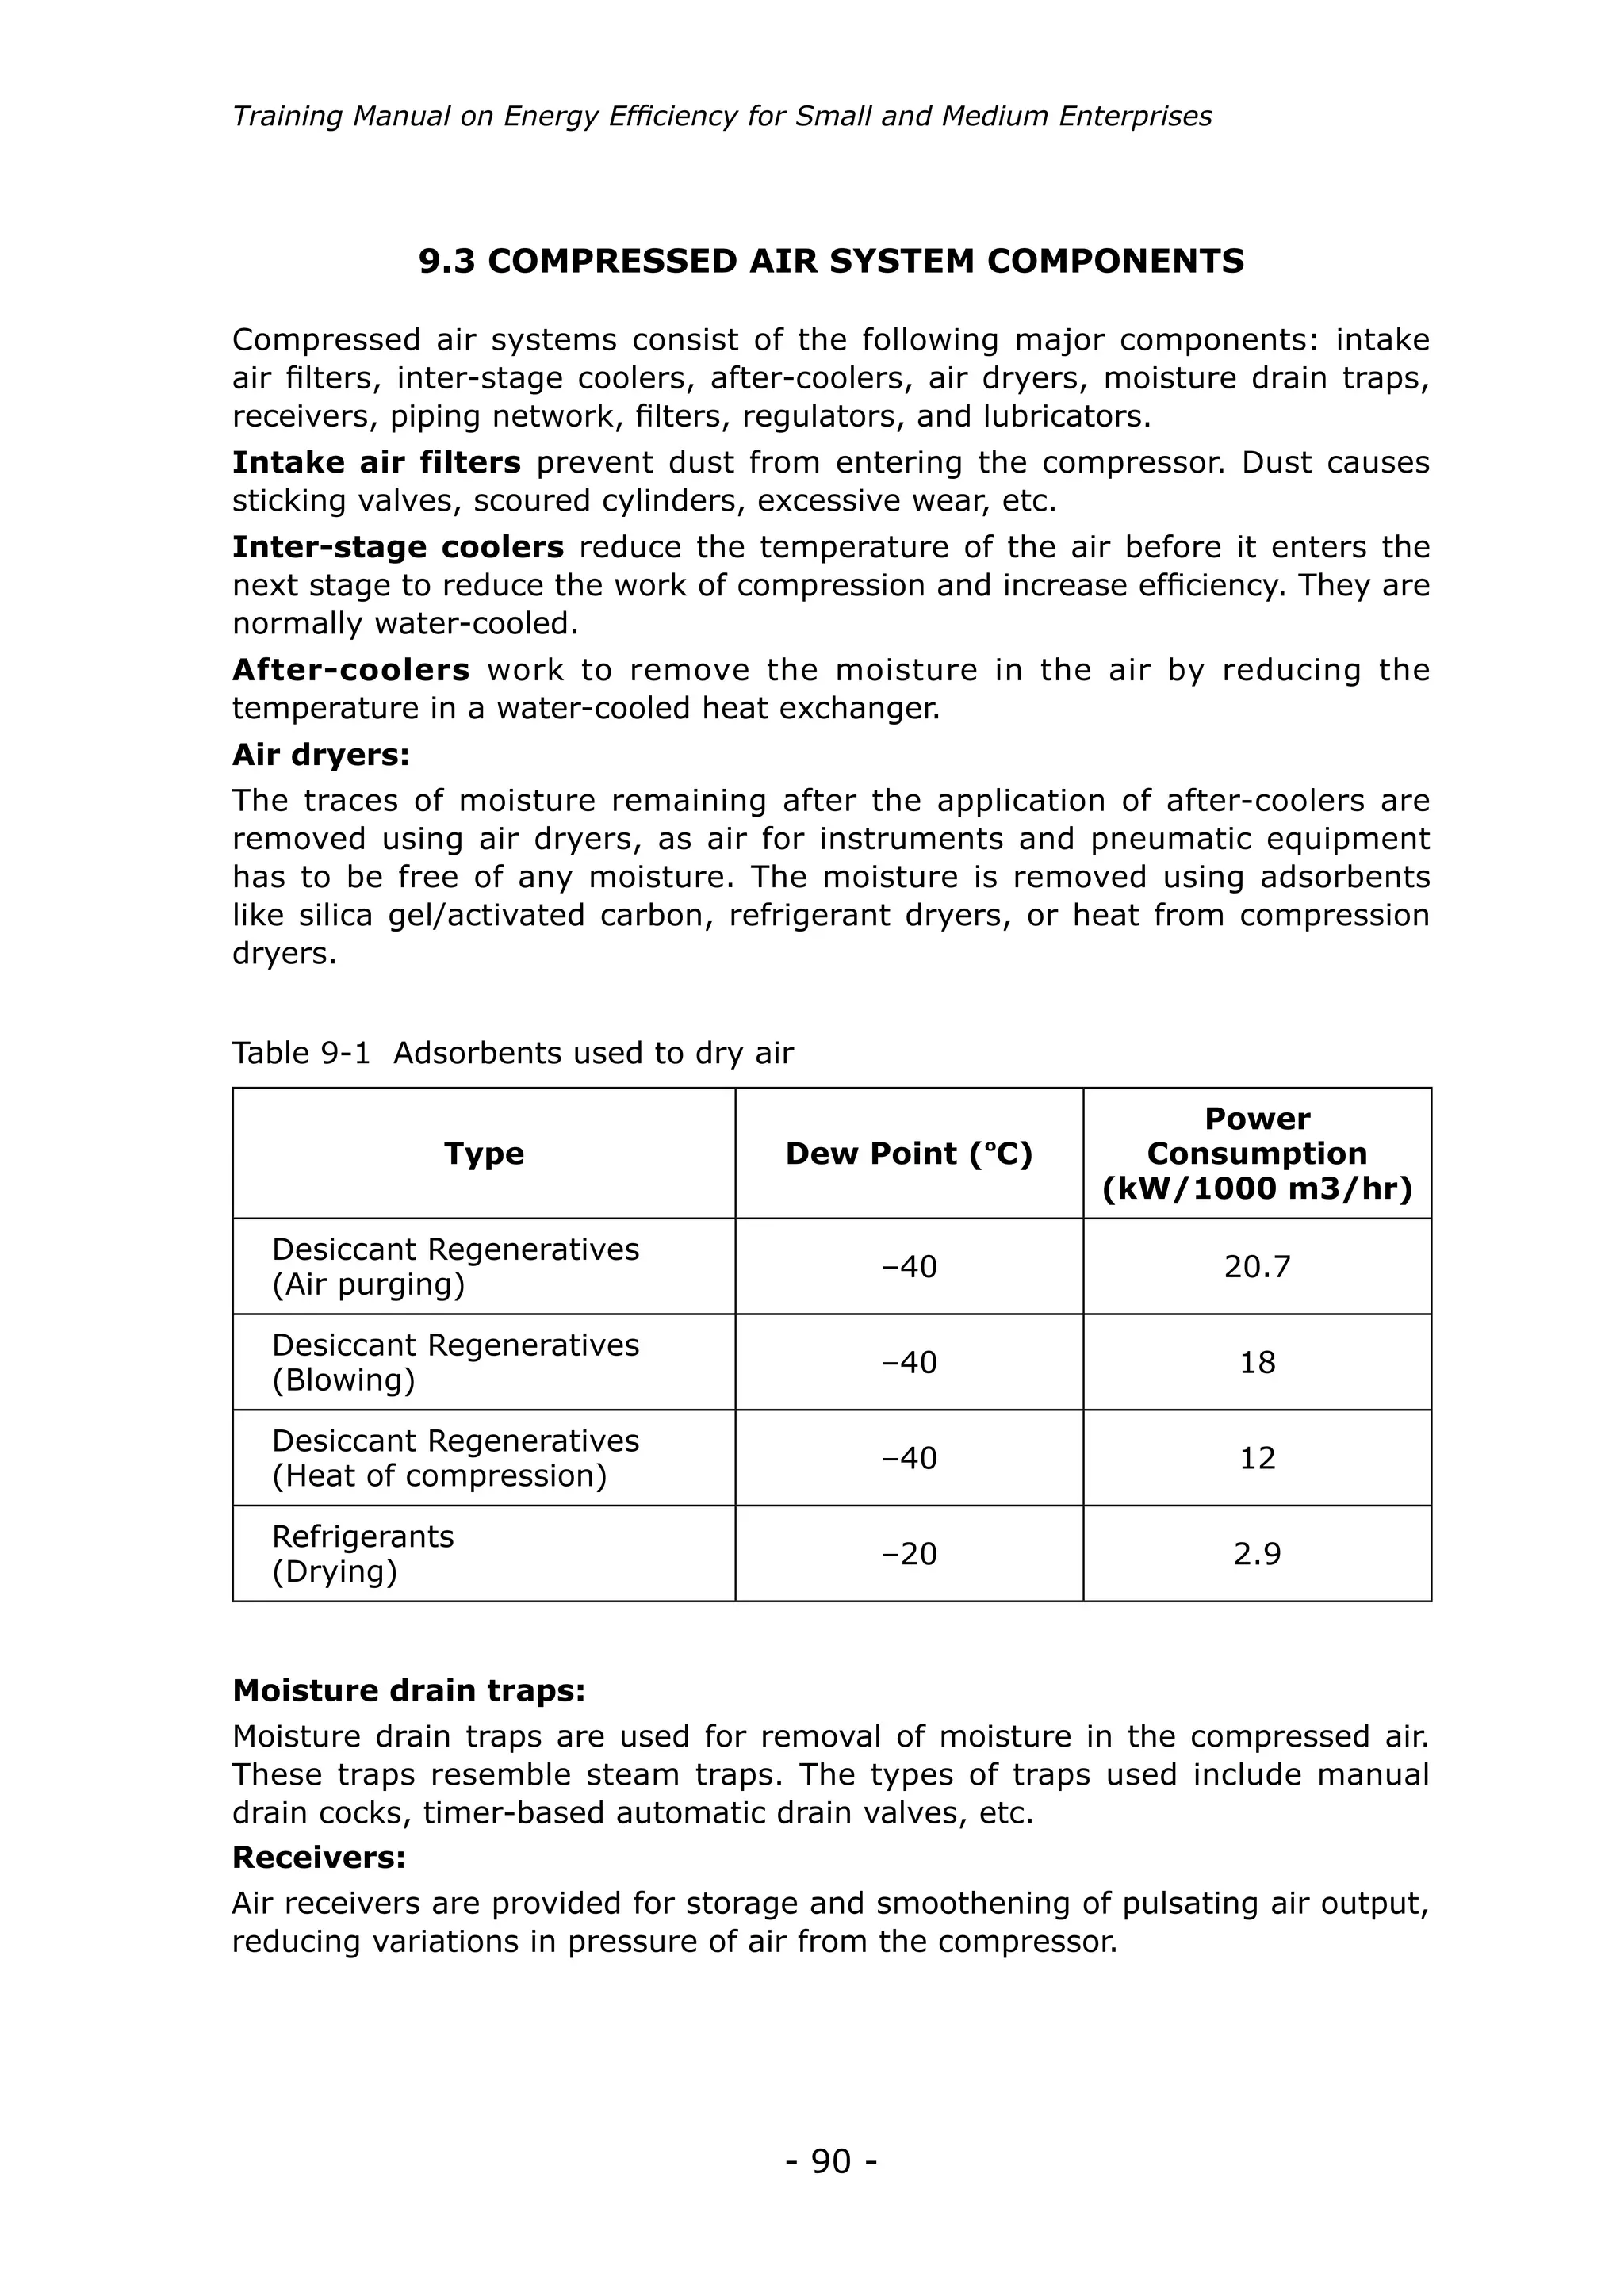
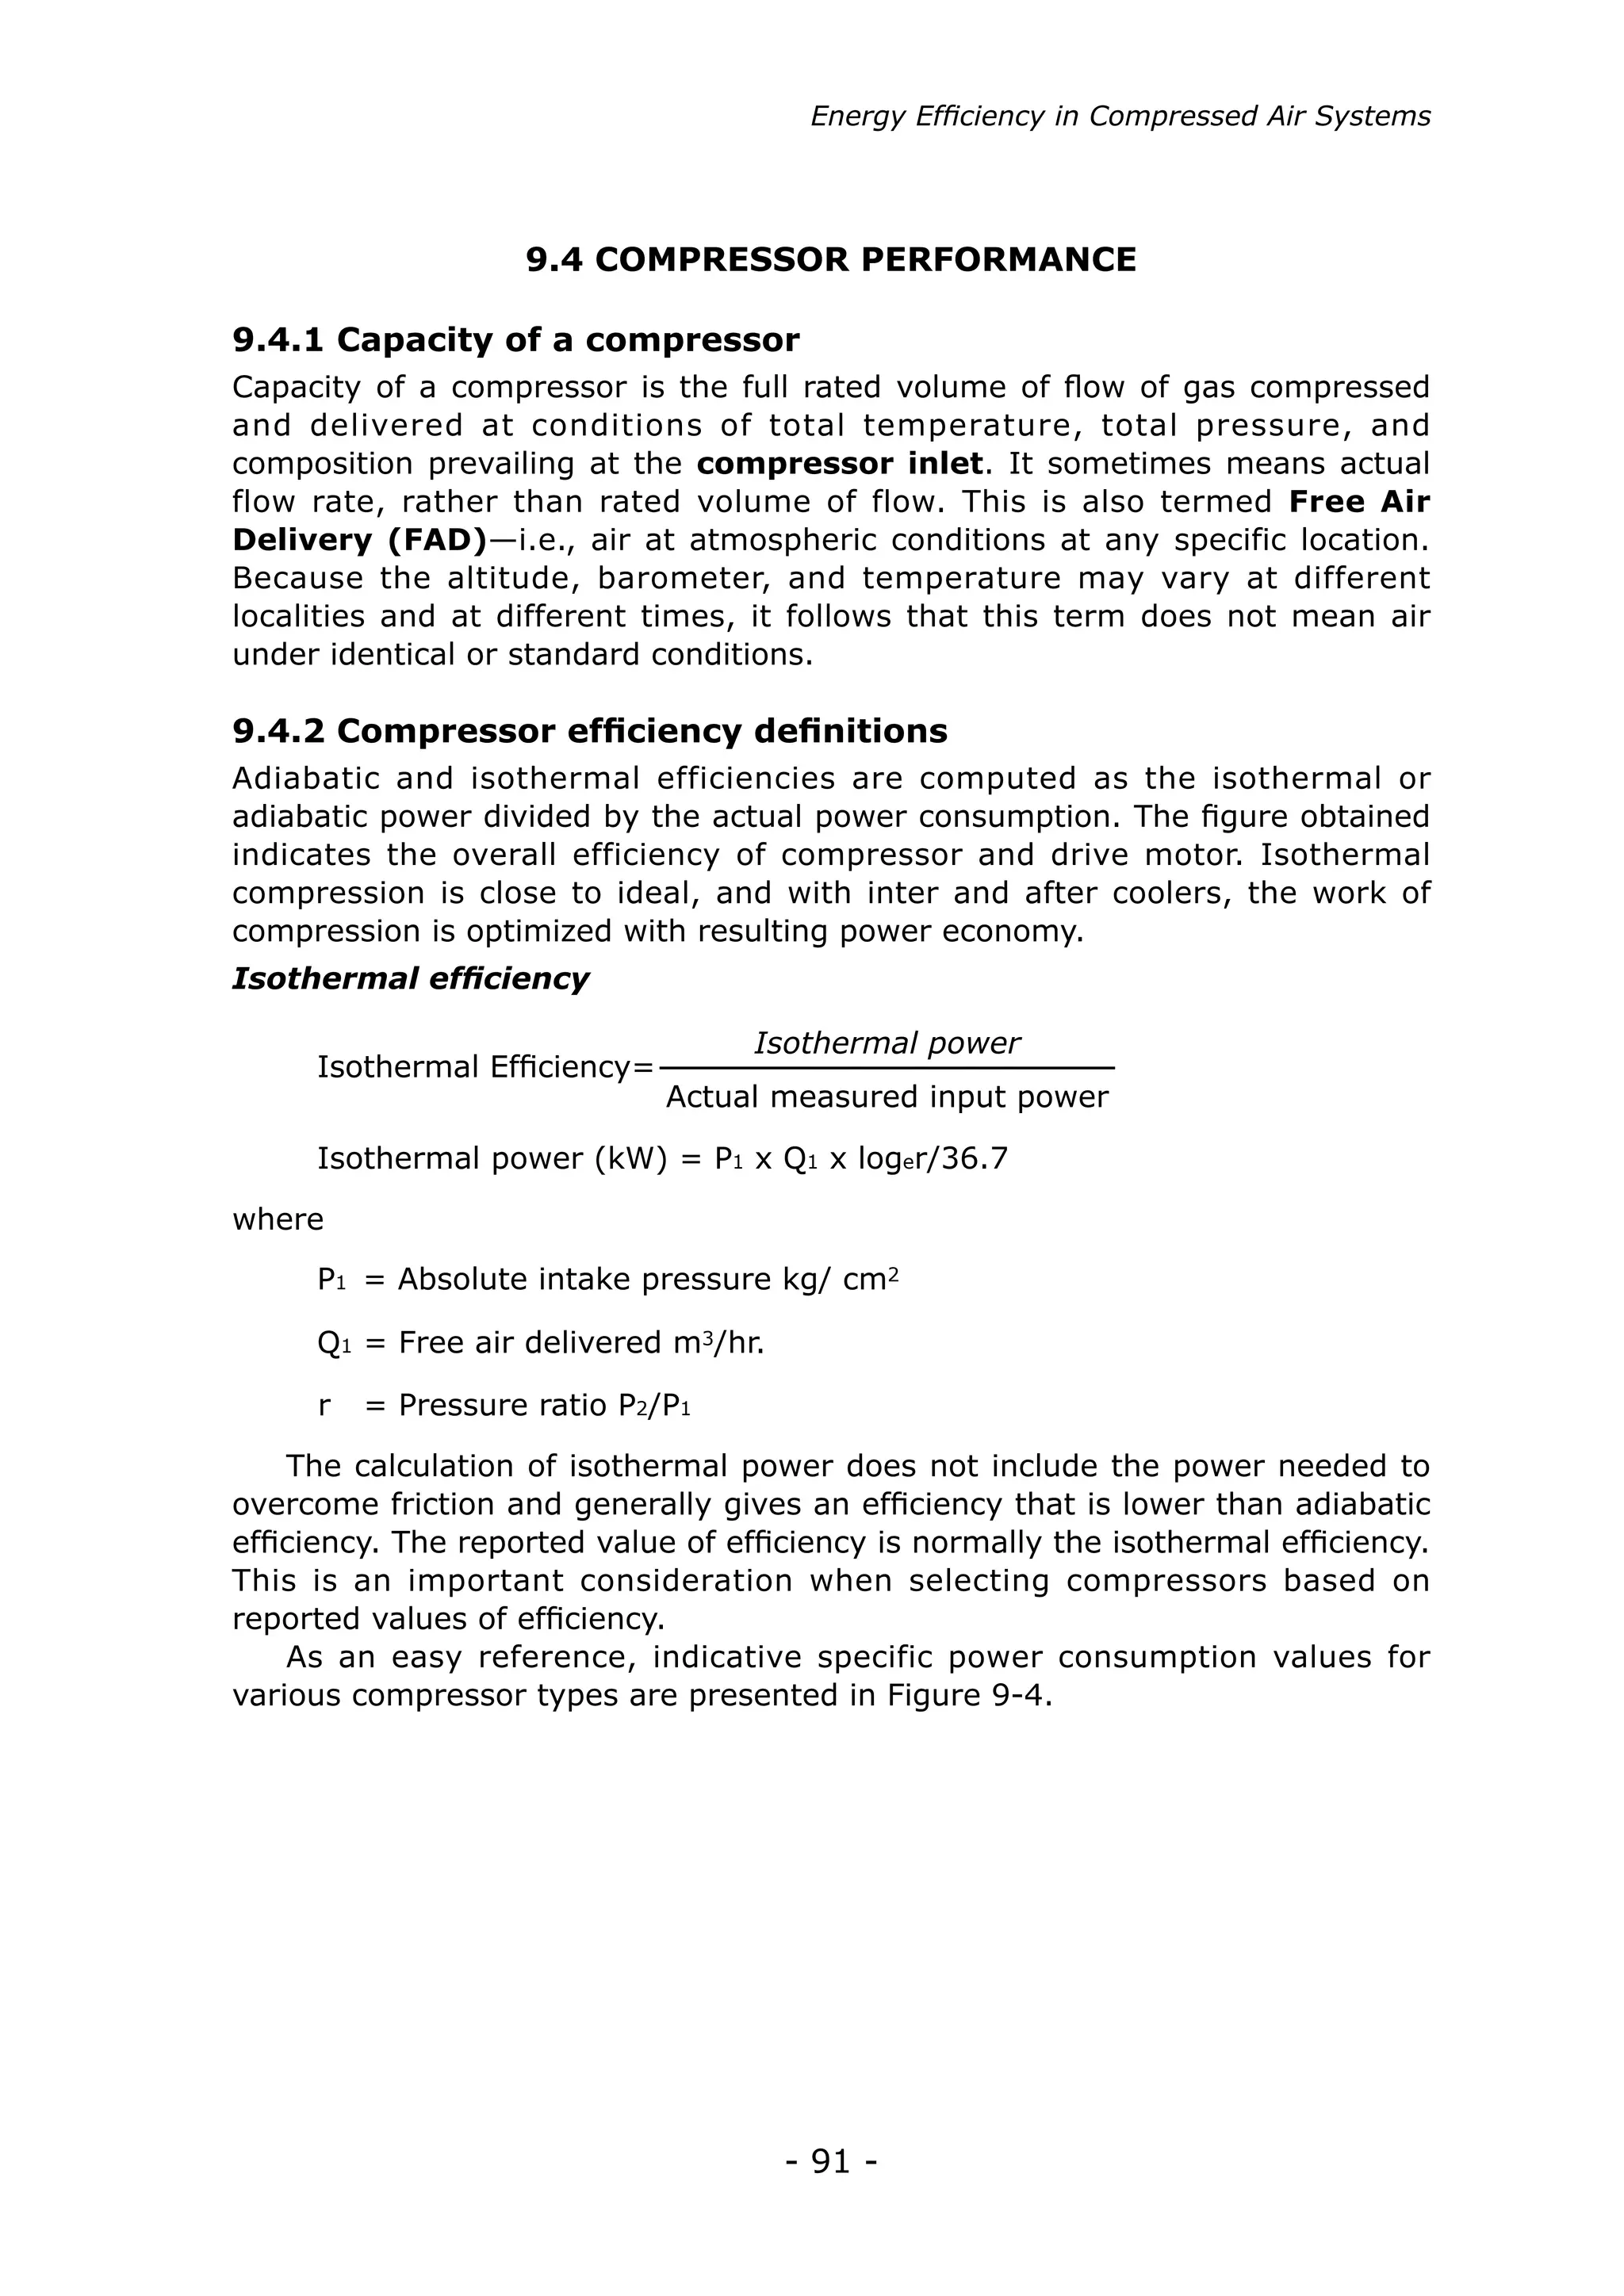
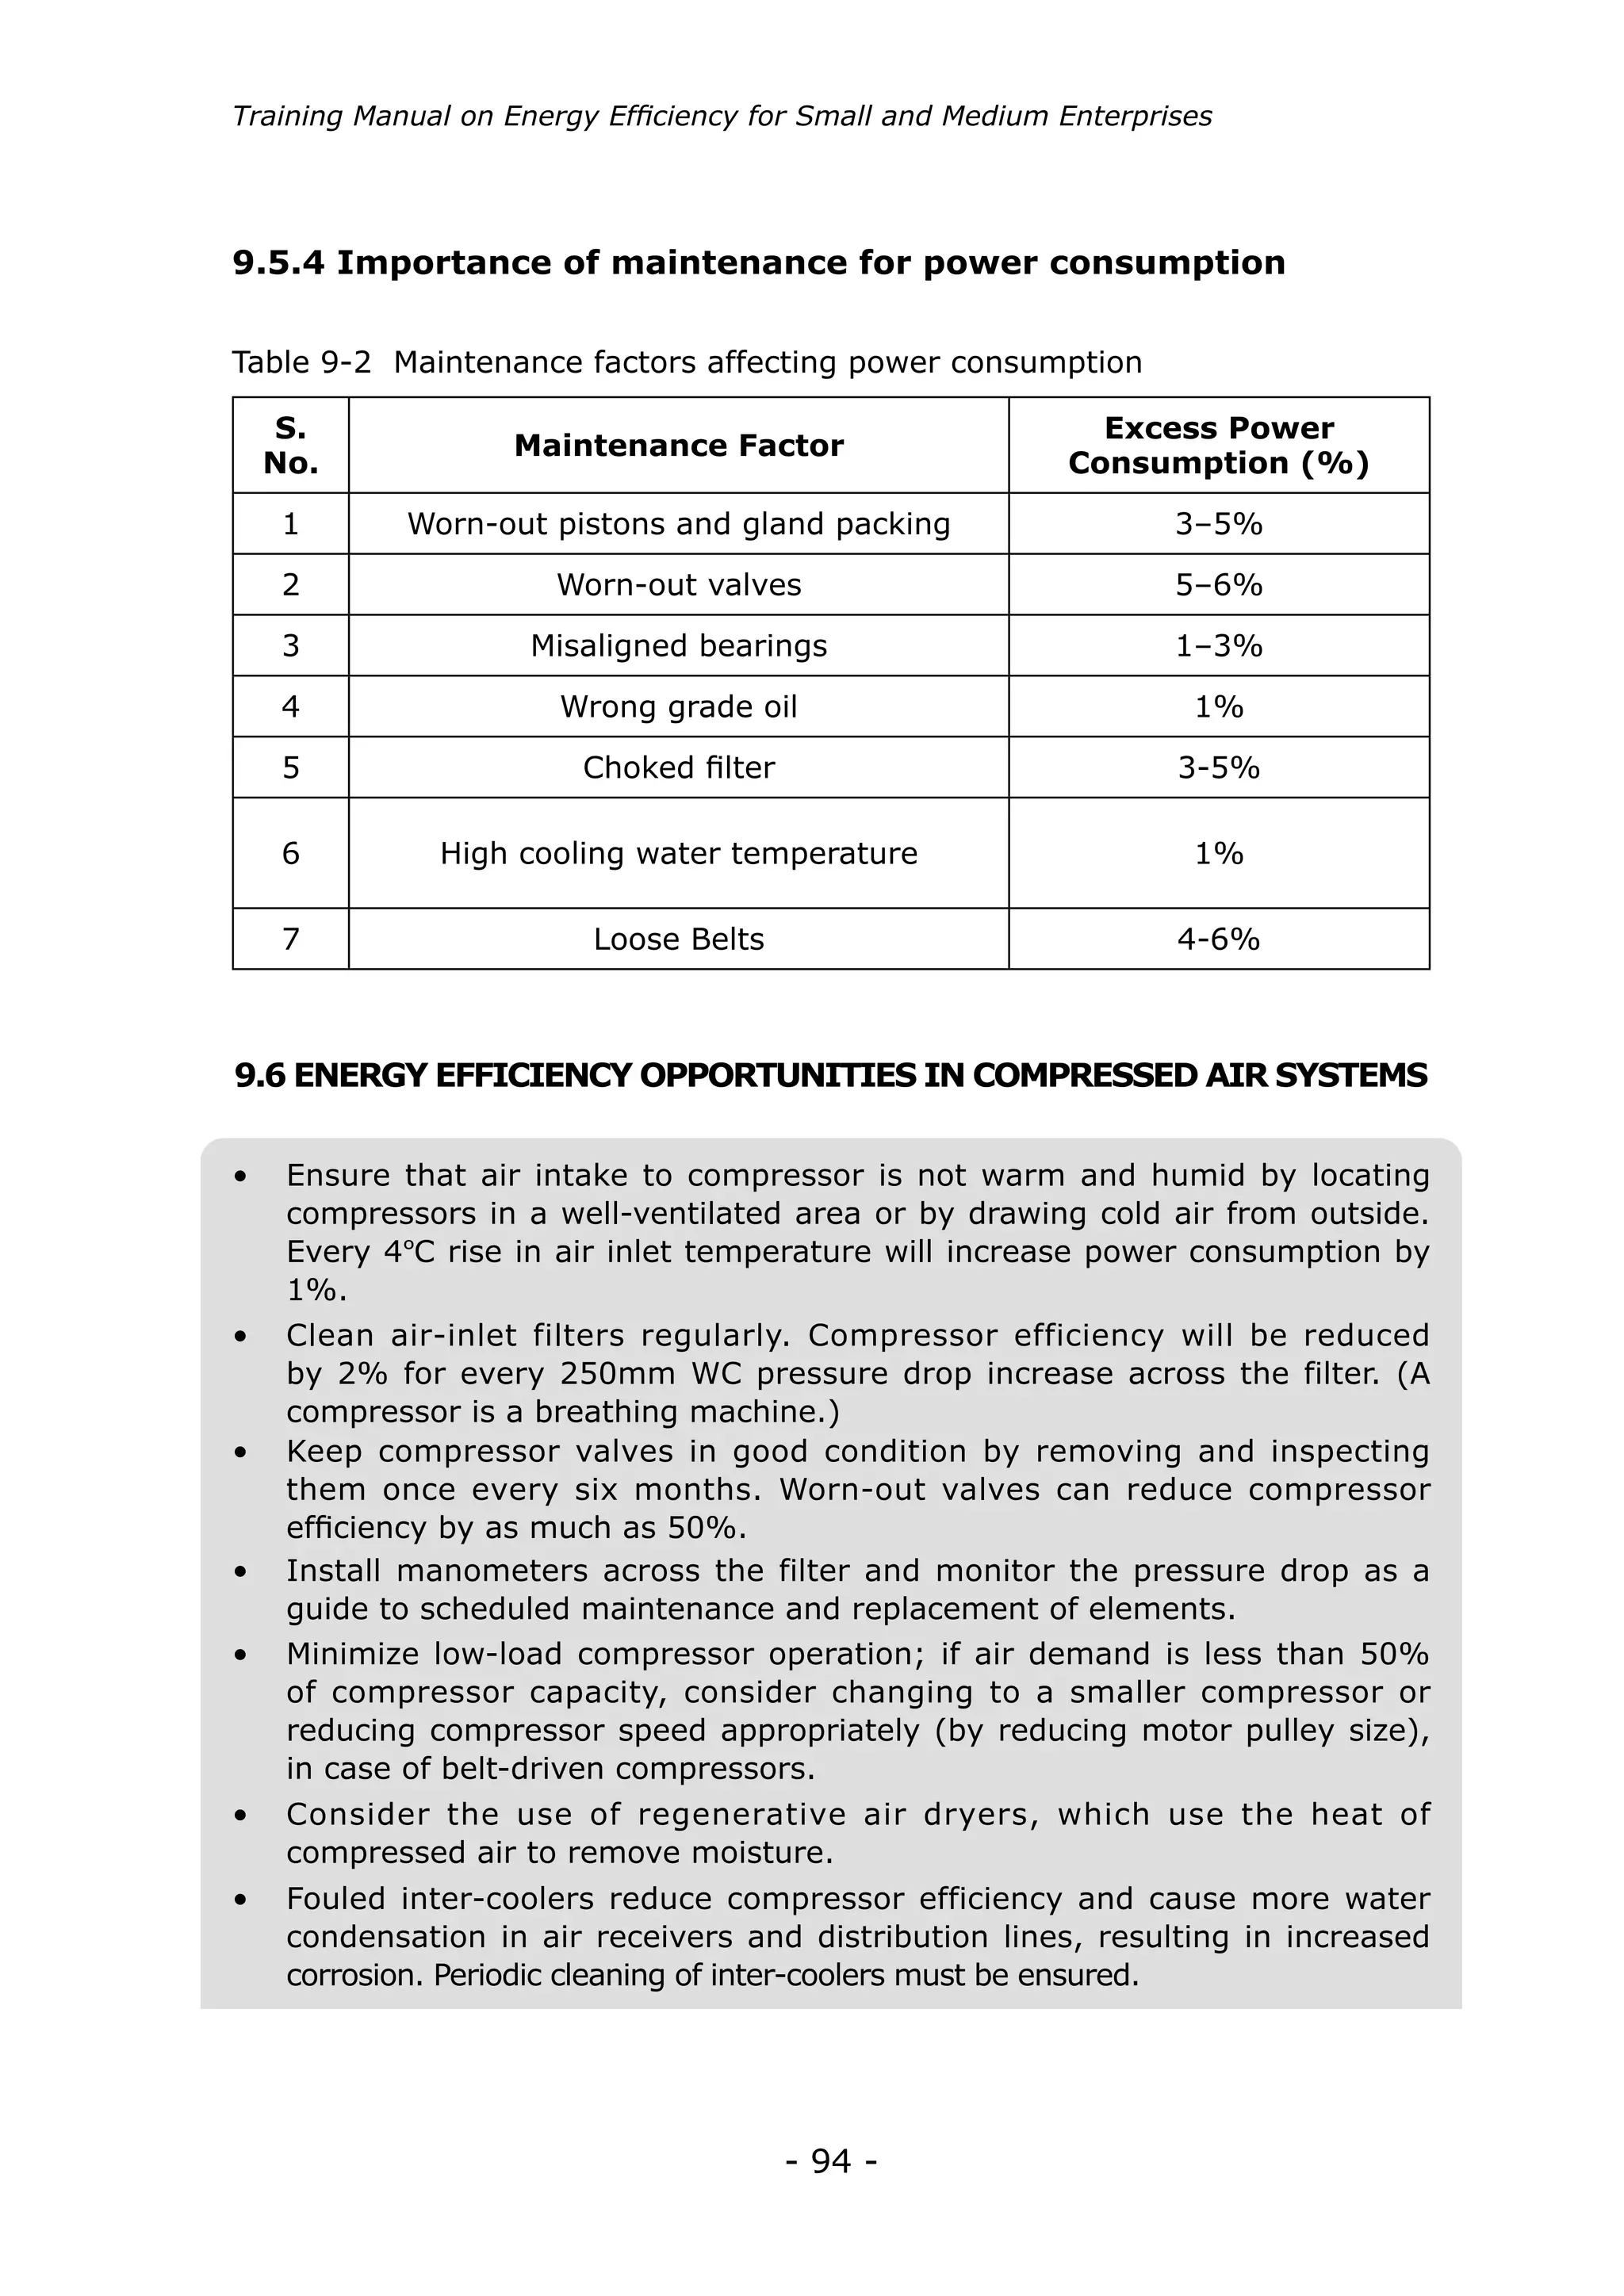
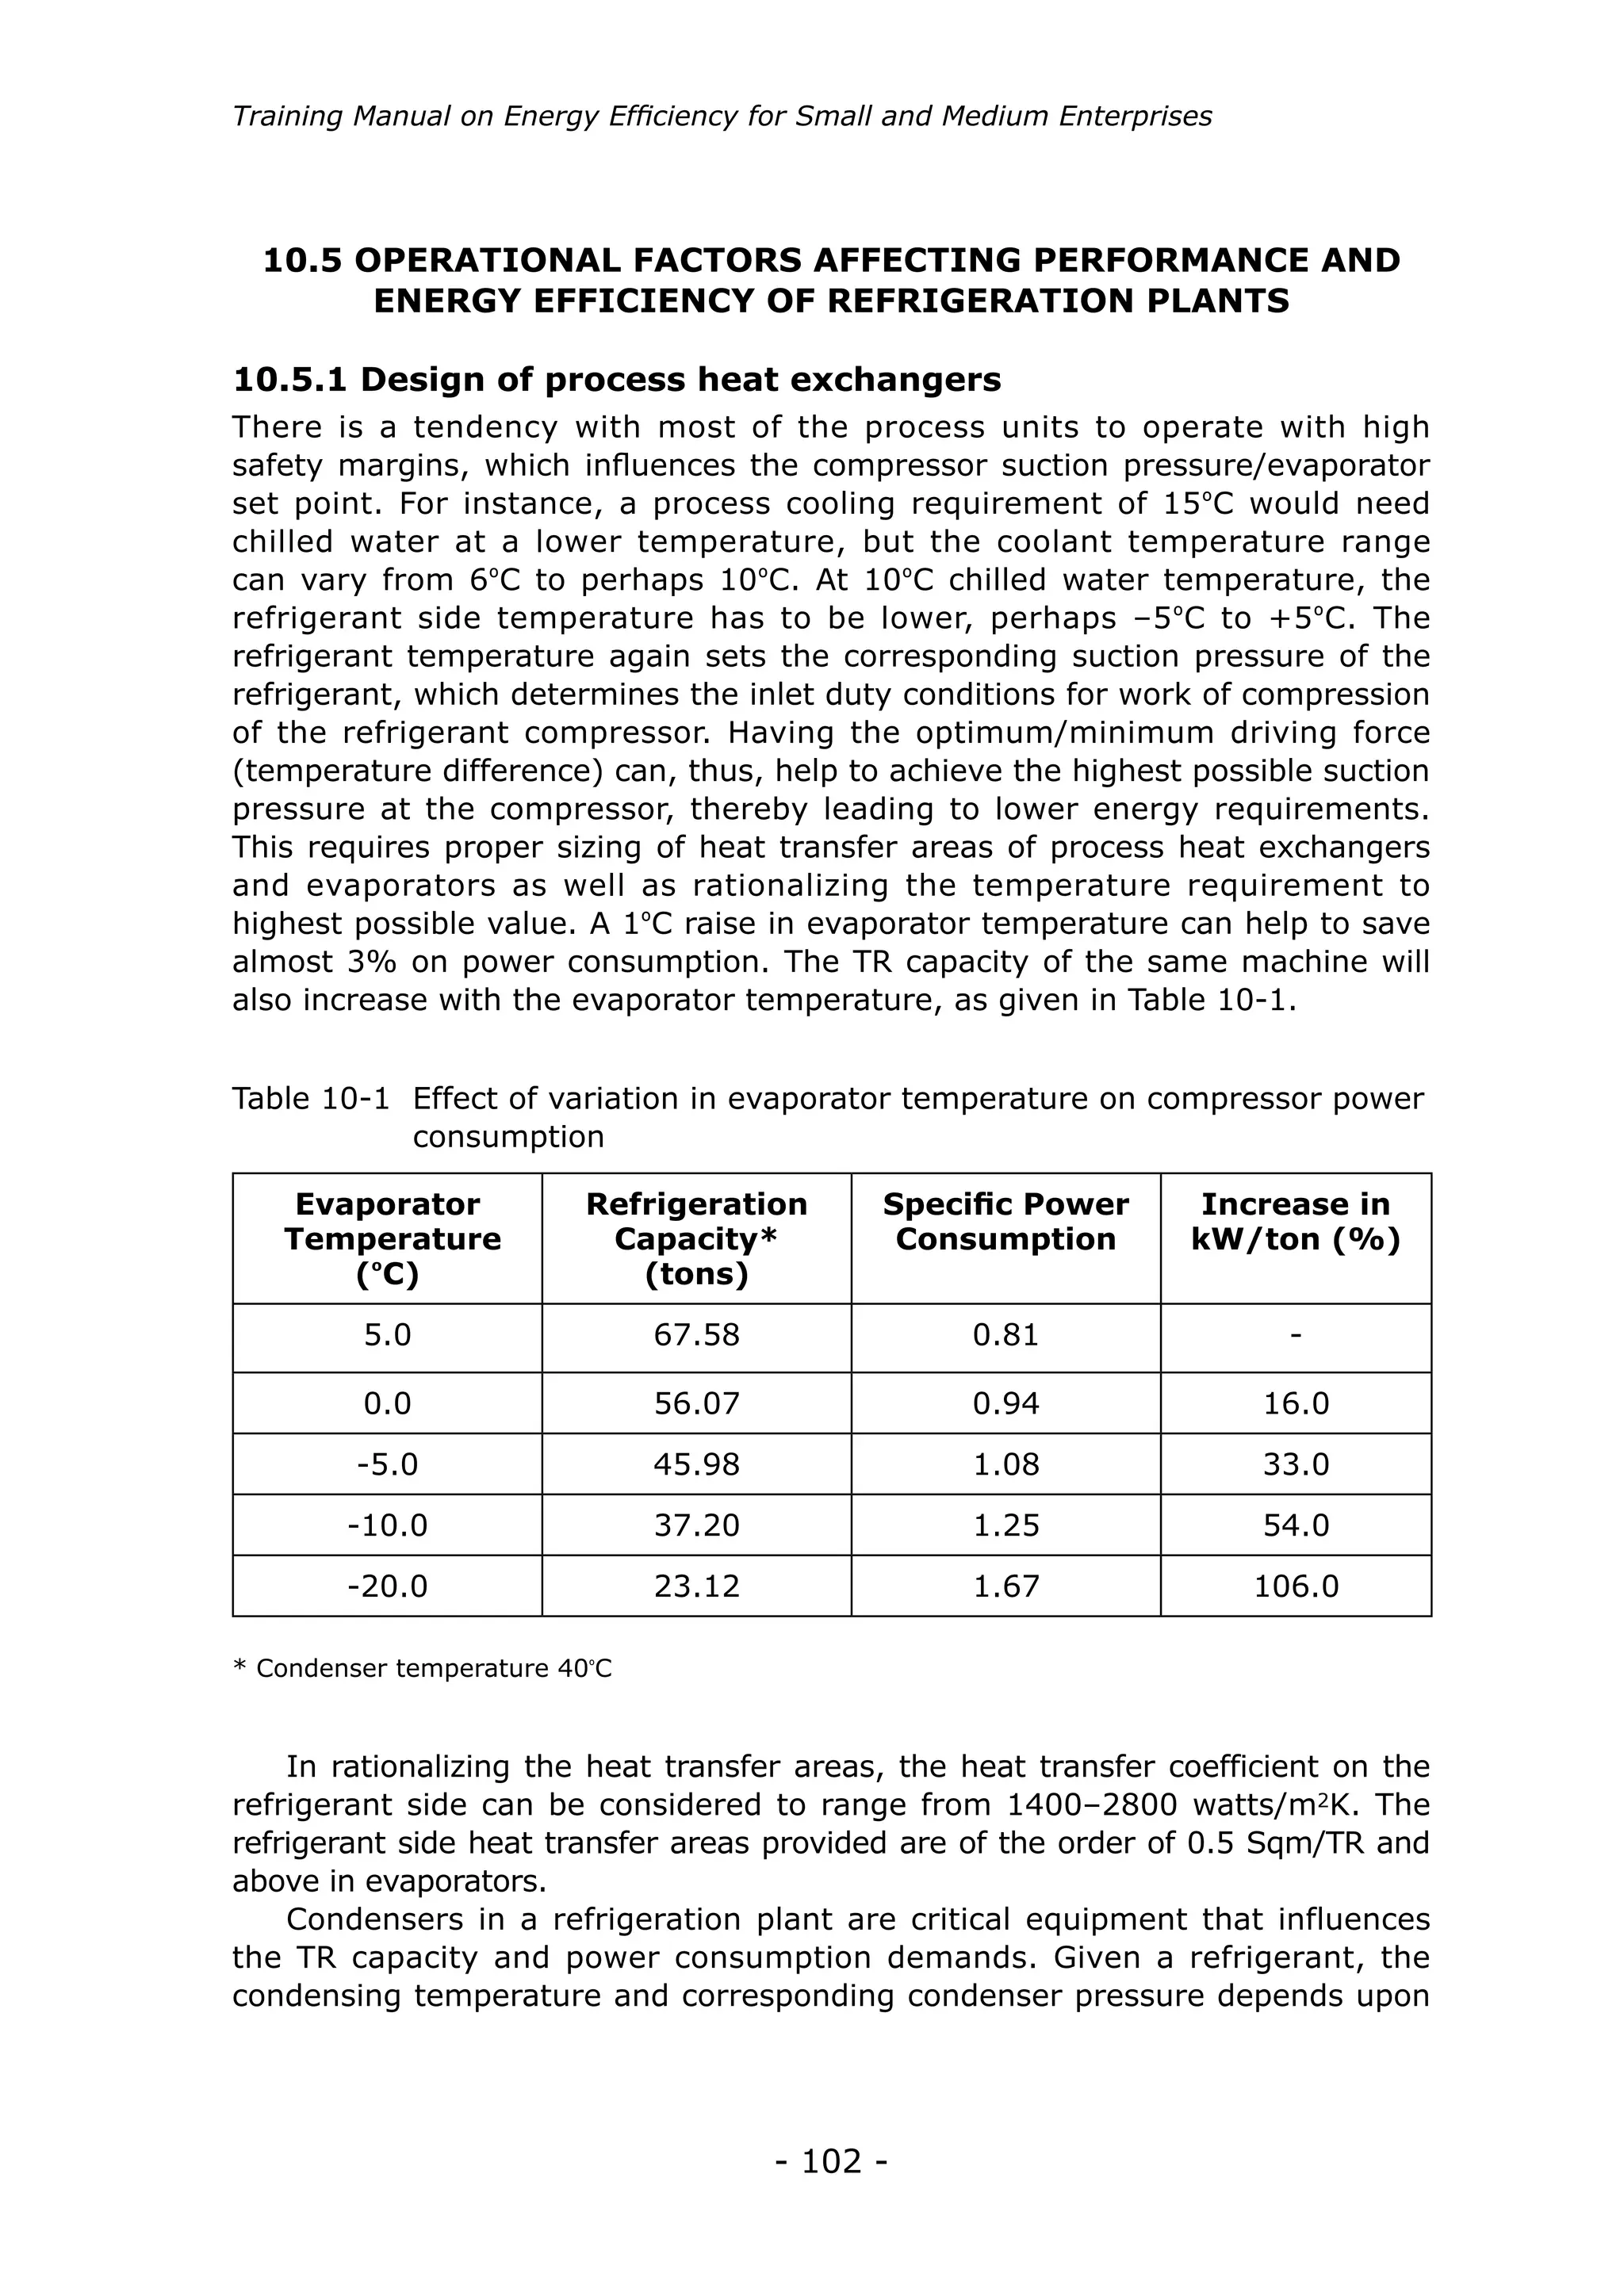
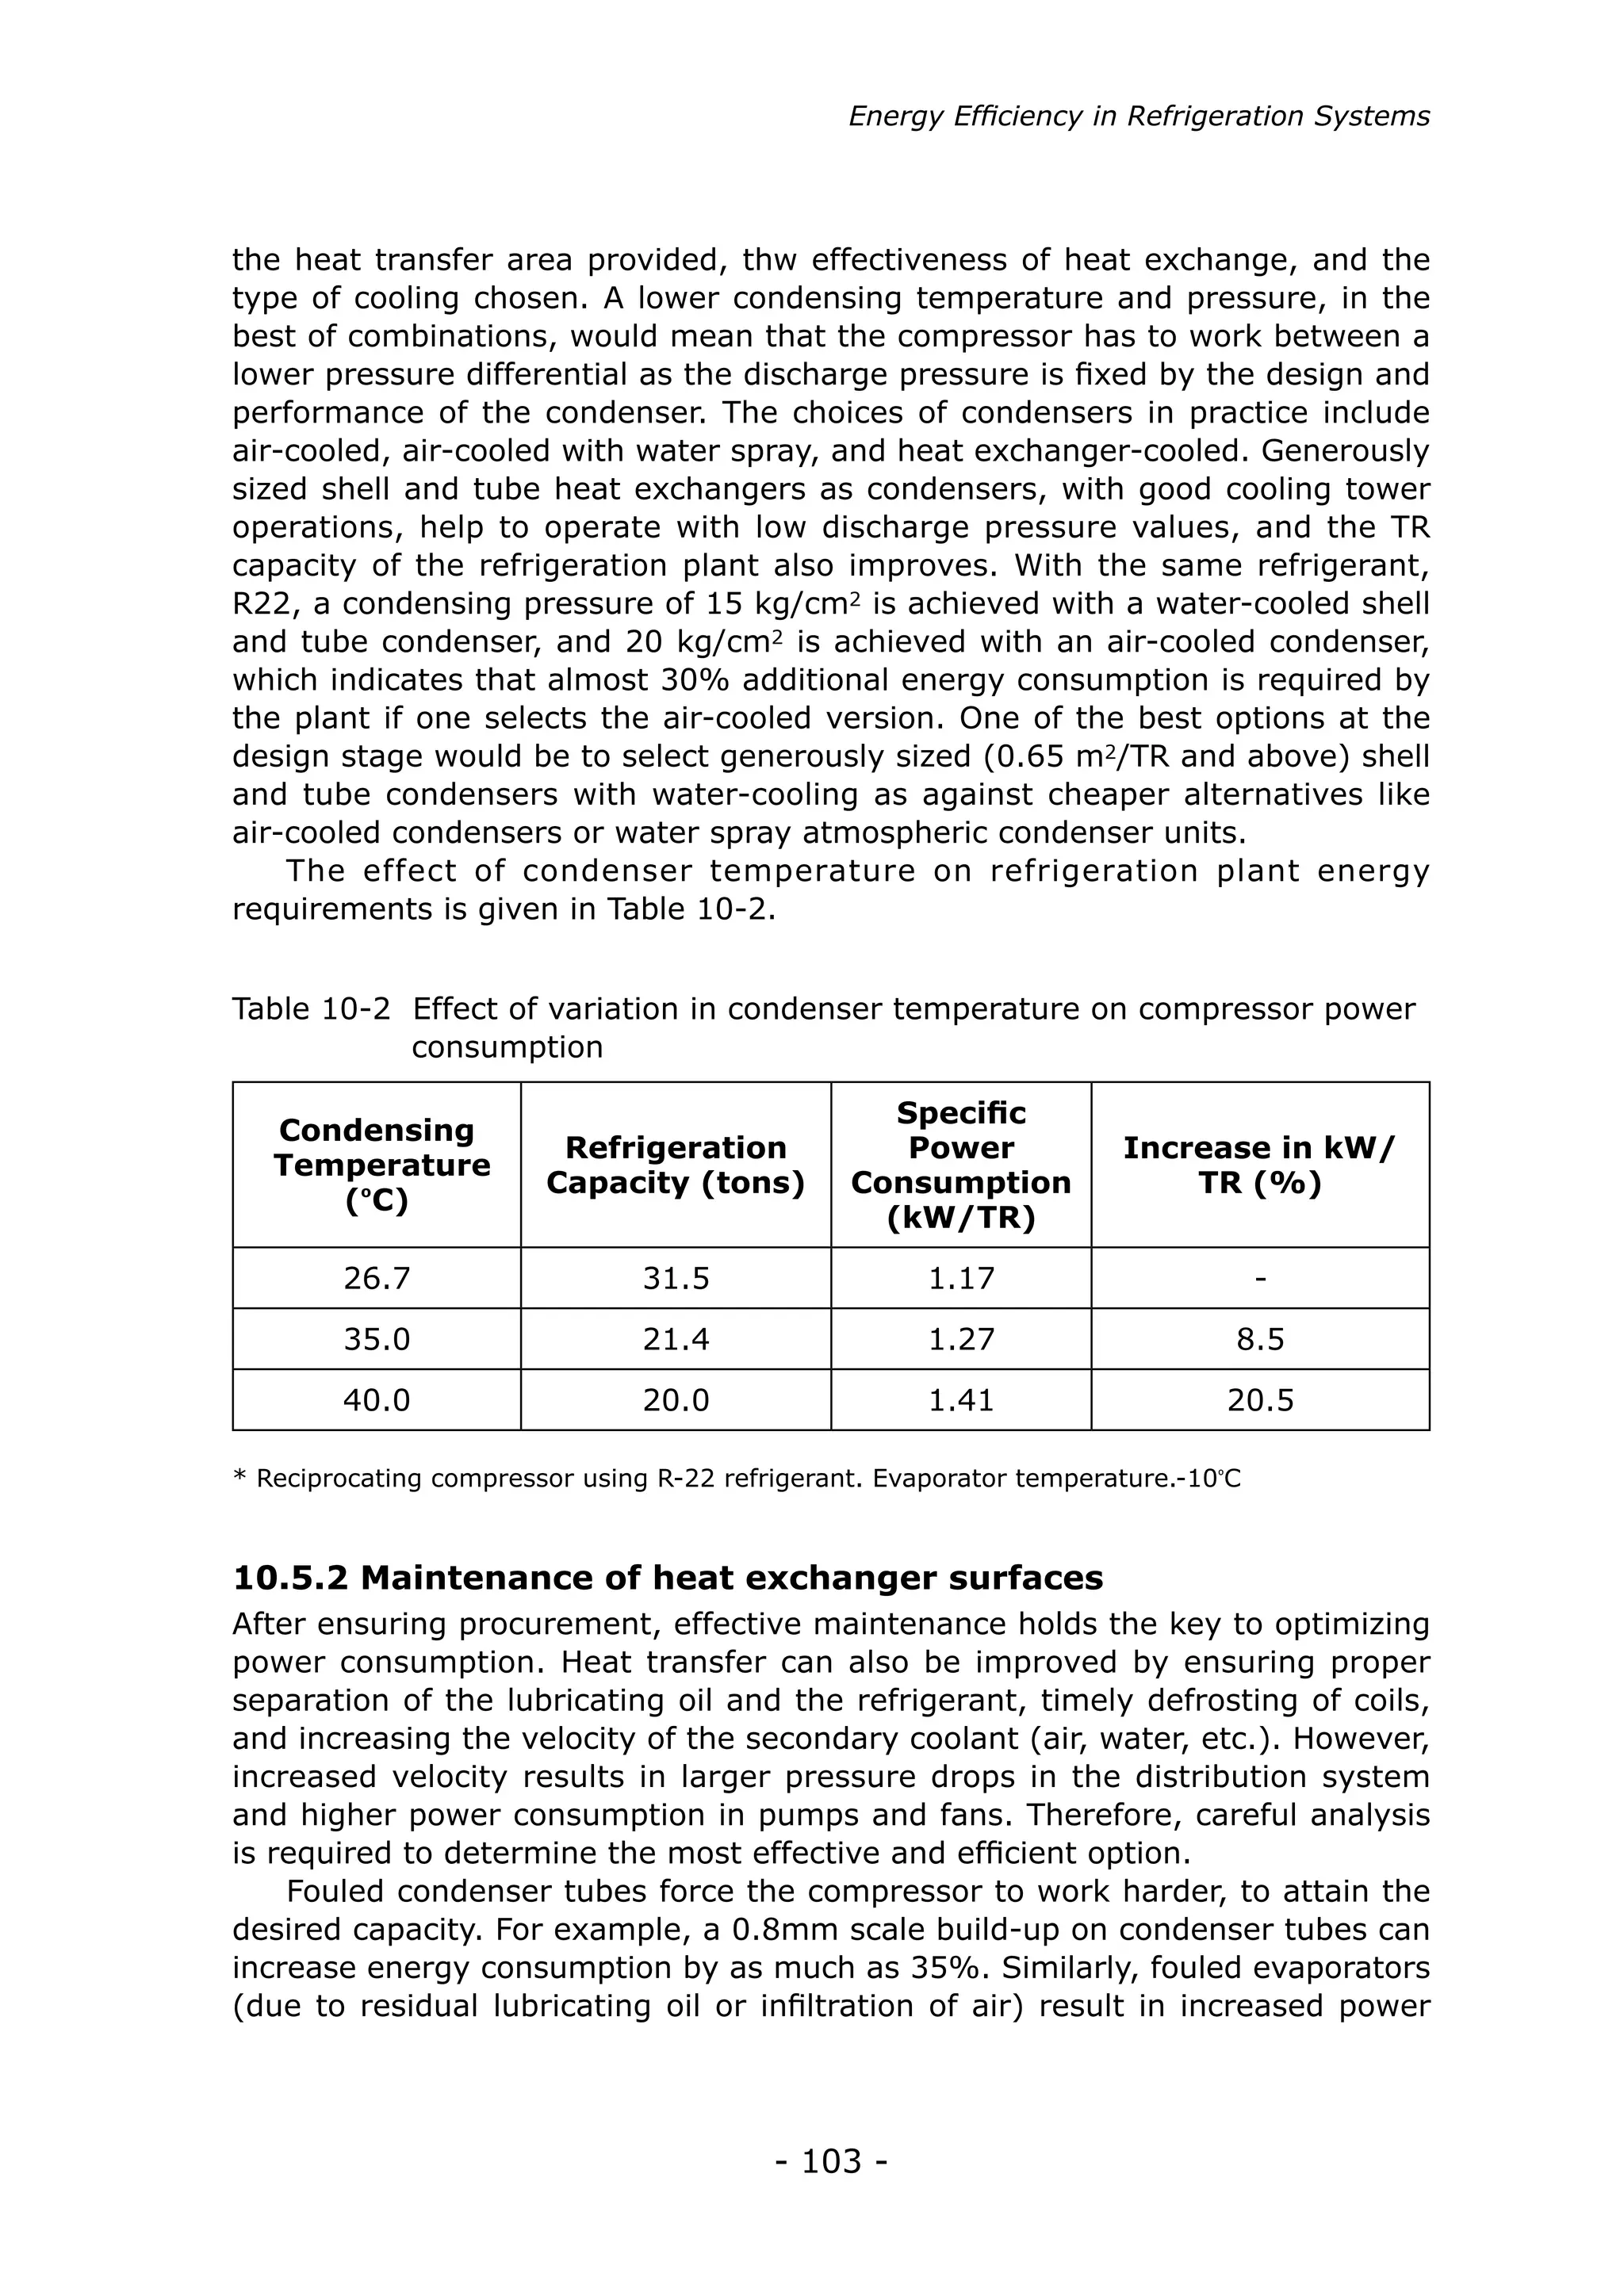
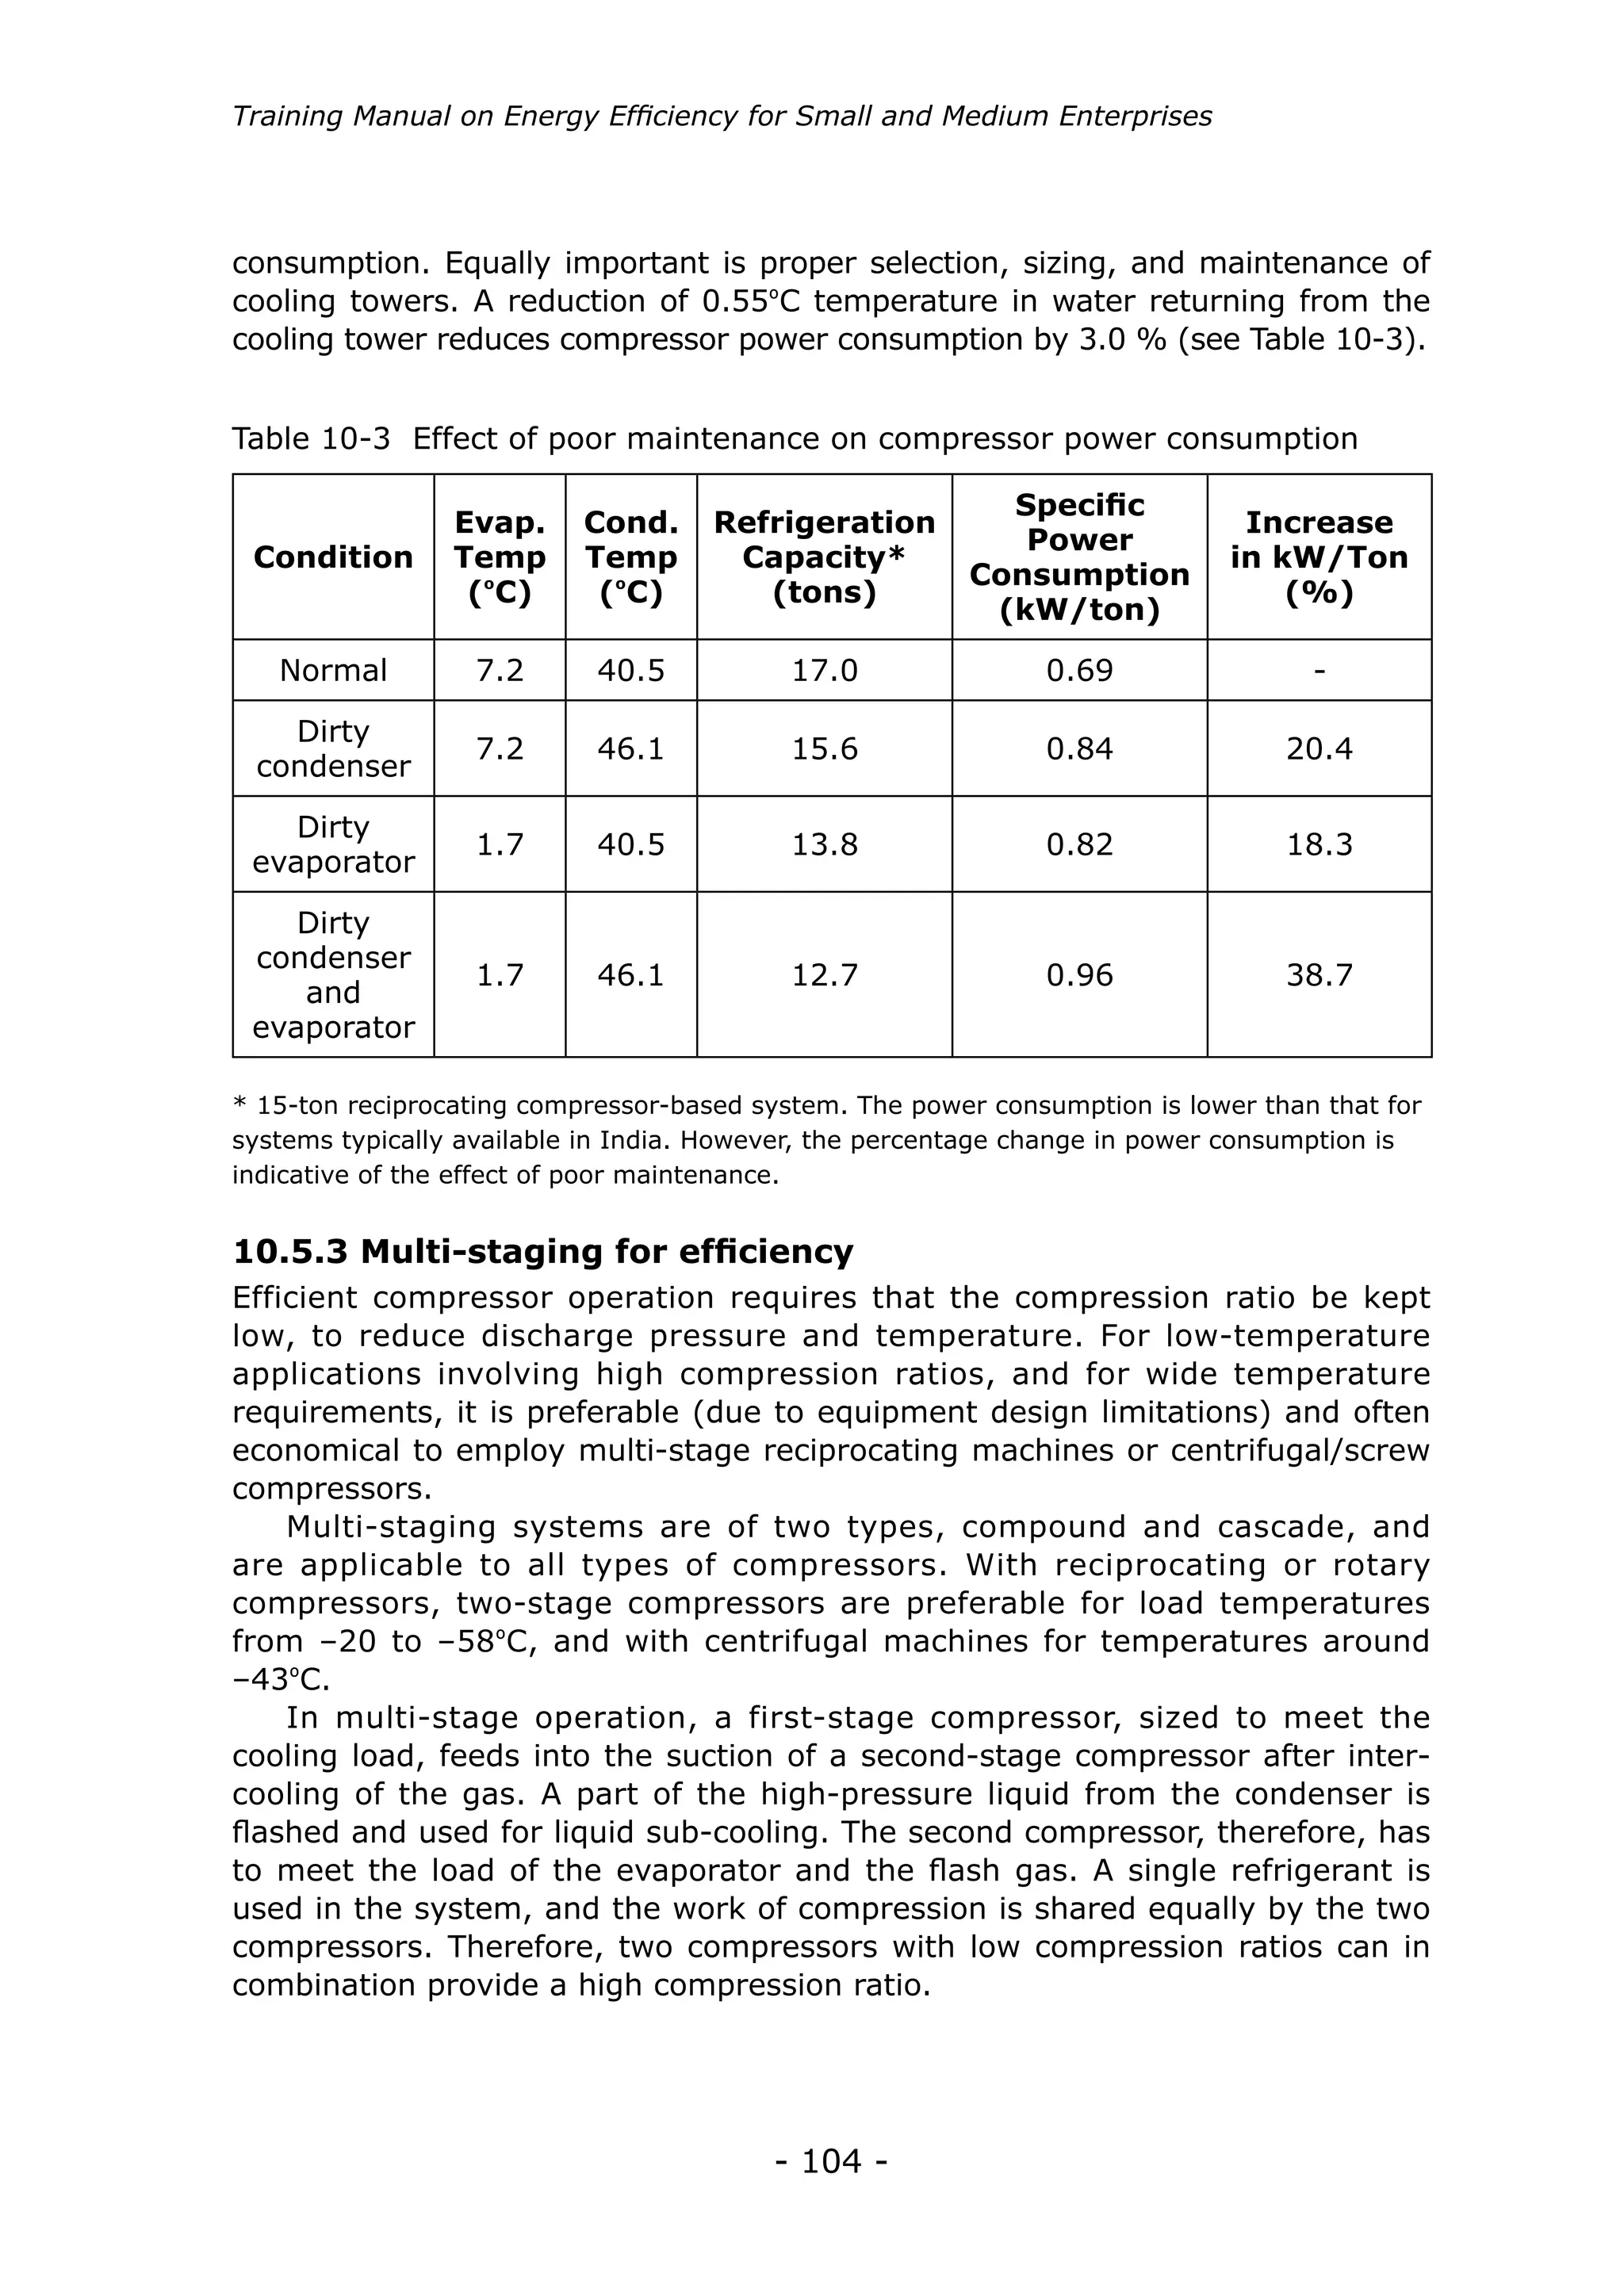
Training Manual on Energy Efficiency for Small and Medium Enterprises
                                                                                                                                                Training
                                                                                                                                                Manual
                                                                                                                                                on
                                                                                                                                                Energy
                                                                                                                                                Efficiency
Training Manual on Energy Efficiency for Small and Medium Enterprises
550.X.2009 ISBN : 92-833-2399-8
                                                                                                                                                for Small and Medium Enterprises
The opinions expressed in this publication do not necessarily reflect the official
view of the APO. For reproduction of the contents in part or in full, the APO’s
prior permission is required.

Mr. Pawan Kumar, India, served as the author.

©Asian Productivity Organization, 2010

ISBN: 92-833-7084-8
CONTENTS

List of Tables	                                                         viii
List of Figures	                                                       ix-xi
Foreword	                                                               xiii

1. FUELS AND COMBUSTION	                                                  1
1.1 General criteria for selecting the fuel type	                         1
1.2 Typical calorific values of fuels	                                    2
1.3 Coal as a fuel	                                                       2
     1.3.1 Storage and handling of coal	                                  2
     1.3.2 Preparation of coal	                                           3
     1.3.3 Parameters in coal combustion	                                 4
1.4 Oil as a fuel	                                                        5
     1.4.1 Tips on storage of fuel oil	                                   5
     1.4.2 Pumping choices for fuel oil	                                  5
     1.4.3 Parameters in liquid fuel combustion	                          5
     1.4.4 Pre-heating of fuel oil for pumping	                           7
     1.4.5 Pre-heating requirements for oil combustion	                   7
     1.4.6 Parameters for good efficiency in fuel oil combustion	         7
1.5 Gaseous fuels	                                                        8
     1.5.1 Gaseous fuel combustion	                                       8
1.6 Combustion	                                                           8
     1.6.1 Chemical reactions involved in combustion of fuels	            8
     1.6.2 The three T’s (temperature, time, turbulence) involved in
            combustion efficiency	                                        9
     1.6.3 Three types of combustion	                                     9
     1.6.4 Types of draft systems used in combustion	                    10
1.7 Key result areas for combustion efficiency	                          10
2. ENERGY EFFICIENCY IN BOILERS	                                         11
2.1 Introduction	                                                        11
2.2 The heating surfaces in a boiler	                                    11
2.3 Boiler types and classification	                                     12
     2.3.1 Fire tube boilers	                                            12
     2.3.2 Water tube boilers	                                           12
     2.3.3 Packaged boilers	                                             12
     2.3.4 Fluidized bed combustion (FBC) boilers	                       12
2.4 Performance evaluation of boilers	                                   13
     2.4.1 Thermal efficiency	                                           13
     2.4.2 Evaporation ratio	                                            13
2.5 Boiler water treatment	                                                      14
2.6 Energy efficiency opportunities in boilers	                                  14
     2.6.1 Reduce excess air	                                                    14
     2.6.2 Minimize stack temperature	                                           16
           2.6.2.1 Feed water preheating from waste heat of stack gases          16
           2.6.2.2 Combustion air preheating from waste heat of stack gases      16
     2.6.3 Avoid incomplete combustion	                                          17
     2.6.4 Reduce scaling and soot losses	                                       17
     2.6.5 Minimize radiation and convection losses	                             17
     2.6.6 Adopt automatic blowdown controls	                                    18
     2.6.7 Optimize boiler steam pressure	                                       18
     2.6.8 Variable speed control for fans, blowers, and pumps	                  18
     2.6.9 Effect of boiler loading on efficiency	                               18
     2.6.10 Boiler replacement	                                                  18
2.7 Case study	                                                                  19
2.8 Tips for energy efficiency in boilers	                                       20

3. ENERGY EFFICIENCY IN STEAM DISTRIBUTION AND UTILIZATION                       21
3.1   Introduction	                                                              21
3.2   Important properties of steam	                                             21
3.3   The temperature-enthalpy relationship	                                     22
3.4   Steam tables	                                                              22
3.5   Steam distribution system	                                                 23
3.6   Steam piping: good practices	                                              23
3.7   Tips on steam piping sizing and layout	                                    24
3.8   Maintenance of steam traps	                                                24
3.9   Good practices for efficient steam utilization	                            25
       3.9.1 Steam leakage quantification	                                       25
       3.9.2 Providing dry steam for the process	                                26
       3.9.3 Utilizing steam at the lowest acceptable pressure for the process   27
       3.9.4 Insulation of steam pipelines and hot process equipment	            27
       3.9.5 Minimizing heat transfer barriers	                                  28
       3.9.6 Condensate recovery	                                                29
       3.9.7 Flash steam recovery	                                               29
       3.9.8 Reducing the work to be done by steam	                              29
       3.9.9 Proper utilization of directly injected steam	                      30
       3.9.10 Proper air venting	                                                31

4. ENERGY EFFICIENCY IN FURNACES	                                                32
4.1 Introduction	                                                                32
4.2 Types and classification of furnaces	                                        32
4.3 Characteristics of an efficient furnace	                                  32
4.4 Furnace energy supply	                                                    33
4.5 Oil-fired furnaces	                                                       33
4.6 Typical furnace systems	                                                  33
     4.6.1 Forging furnaces	                                                  33
     4.6.2 Rerolling mill furnaces	                                           34
4.7 Performance evaluation of a typical furnace	                              34
     4.7.1 Furnace efficiency	                                                35
     4.7.2 Useful data	                                                       36
     4.7.3 Determining black body radiation at a particular temperature       37
4.8 General fuel economy measures in furnaces	                                40
     4.8.1 Combustion with minimum excess air	                                40
     4.8.2 Correct heat distribution	                                         40
4.9 Furnace waste heat recovery	                                              41
     4.9.1 Some common waste heat recovery systems	                           42
     4.9.2 Ceramic fiber for reducing thermal mass	                           44
     4.9.3 Ceramic coatings to improve emissivity	                            45
4.10 Tips for improving energy efficiency in furnaces	                        45

5. ELECTRICAL LOAD MANAGEMENT	                                                47
5.1 Introduction	                                                              47
5.2 Maximum demand basics	                                                     47
     5.2.1 Load curve of a plant	                                              47
     5.2.2 MD recording	                                                       48
5.3 Load management strategies	                                                49
     5.3.1 Rescheduling and staggering loads	                                  49
     5.3.2 Storage of products in process materials and process utilities like
     	      refrigeration	                                                     49
     5.3.3 How ice storage helps in demand control	                            50
5.4 Power factor (PF) improvement	                                             50
     5.4.1 Example problem:	                                                   53
5.5 Tips for energy-efficient electrical load management	                      55
6. ENERGY EFFICIENCY IN ELECTRIC MOTORS	                                      56
6.1 Introduction	                                                             56
6.2 Salient aspects of motor performance 	                                    56
6.3 The types of motor loss	                                                  58
6.4 Energy efficiency opportunities in motors	                                59
     6.4.1 Systems approach	                                                  59
     6.4.2 Operational measures	                                              59
6.5 Tips for energy efficiency in motors and drives	                          63
7. ENERGY EFFICIENCY IN PUMPS	                                                  64
7.1 Pump choices	                                                               64
7.2 Centrifugal pumps in brief 	                                                64
7.3 System characteristics	                                                     65
7.4 Typical pump characteristic curves	                                         69
7.5 Flow control methods and energy efficiency	                                 69
     7.5.1 Flow control by valve control	                                       69
     7.5.2 Bypass control	                                                      70
     7.5.3 Fixed flow reduction by impeller trimming	                           71
     7.5.4 Meeting variable flow needs by speed reduction	                      72
7.6 Pump performance assessment	                                                73
7.7 Tips for energy conservation in pumping systems	                            75

8. ENERGY EFFICIENCY IN FANS	                                                   76
8.1 Introduction	                                                               76
8.2 Fan types	                                                                  76
8.3 System resistance	                                                          79
8.4 Fan performance assessment	                                                 80
     8.4.1 Air flow measurement	                                                80
     8.4.2 Velocity pressure/velocity calculation	                              81
     8.4.3 Air density calculation	                                             83
     8.4.4 Velocity calculation	                                                83
     8.4.5 Volume calculation	                                                  83
     8.4.6 Fan efficiency	                                                      83
8.5 Energy savings opportunities	                                               84
     8.5.1 Flow control strategies and energy conservation	                     84

9. ENERGY EFFICIENCY IN COMPRESSED AIR SYSTEMS	                                 88
9.1 Introduction	                                                               88
9.2 Compressor types	                                                           88
9.3 Compressed air system components	                                           90
9.4 Compressor performance	                                                     91
     9.4.1 Capacity of a compressor	                                            91
     9.4.2 Compressor efficiency definitions	                                   91
9.5 Shop floor methods for assessment and factors affecting energy efficiency   92
     9.5.1 Compressor capacity assessment	                                      92
     9.5.2 Simple method of capacity assessment on the shop floor	              92
     9.5.3 Simple method of leak quantification on the shop floor	              93
     9.5.4 Importance of maintenance for power consumption	                     94
9.6 Energy efficiency opportunities in compressed air systems	                  94
9.7 Generic tips for efficient use of compressors	                              96
10. ENERGY EFFICIENCY IN REFRIGERATION SYSTEMS	                            98
10.1 Introduction	                                                         98
10.2 Types of applications	                                                98
10.3 Types of refrigeration plants	                                        99
     10.3.1 Vapor compression type	                                        99
     10.3.2 Vapor absorption type	                                         99
10.4 Performance assessment	                                              100
10.5 Operational factors affecting performance and energy efficiency of
     refrigeration plants	                                                102
     10.5.1 Design of process heat exchangers	                            102
     10.5.2 Maintenance of heat exchanger surfaces	                       103
     10.5.3 Multi-staging for efficiency	                                 104
     10.5.4 Matching capacity to system load	                             105
     10.5.5 Capacity control and energy efficiency	                       105
     10.5.6 Multi-level refrigeration for plant needs	                    106
     10.5.7 Chilled water storage	                                        106
10.6 Good practices for energy efficiency	                                107
     10.6.1 Operation and maintenance-related measures	                   107
     10.6.2 Other generic opportunities for energy efficiency	            109

11. GREEN BUILDING CONCEPTS AND GOOD BUILDING PRACTICES                   111
11.1   Introduction	                                                      111
11.2   Typical features of green buildings	                               111
11.3   Benefits of green buildings	                                       112
11.4   Good practices in the building sector	                             112
11.5   Some other generic practices that can be adopted	                  118

12. CLEAN DEVELOPMENT MECHANISM	                                          120
12.1   Introduction	                                                      120
12.2   Objectives of CDM	                                                 120
12.3   CDM as a sustainable development strategy	                         120
12.4   Methodologies	                                                     121
12.5   Stakeholders and roles	                                            121
12.6   CDM applications in industrial energy systems	                     122

Annex:	                                                                   124
SME energy efficiency opportunities assessment checklist	                 124
LIST OF TABLES


1-1    Gross calorific values of fuels	                                       2

1-2    Viscosity and pumping temperature	                                     7

2-1    Oxygen coutent and excess air	                                        15

2-2    Boiler specifications	                                                19

3-1    Extract from the steam table	                                         23

3-2    Quantity of heat lost at different temperatures	                      28

4-1    Radiant heat loss comparison at various temperatures	                 37

4-2    Pusher type billet reheating furnaces (for rolling mills)	            39

4-3    Pusher type forging furnaces	                                         39

4-4    Heat loss in flue gas based on excess air level	                      40

5-1	   Multipliers to determine capacitor KVAR reguired for power factor
	      correction	                                                           54

7-1    Calculating pump energy efficiency	                                   74

8-1    Types of fans, characteristics, and typical applications	           78-79

8-2    Measurements of air flow	                                             82

9-1    Adsorbents used to dry air	                                           90

9-2    Maintenance factors affecting power consumption	                      94

10-1	 Effect of variation in evaporator temperature on compressor power
	     consumption	                                                      102

10-2	 Effect of variation in condenser temperature on compressor power
	     consumption	                                                          103

10-3   Effect of poor maintenance on compressor power consumption 	         104


                                      - viii -
LIST OF FIGURES


1-1    Examples of spontaneous combustion	                   3

1-2    Temperature and viscosity	                            6

1-3    Example of chemical reaction producing combustion	    9

3-1    Phase diagram	                                       22

3-2    Estimating steam leakage	                            26

3-3    Dry steam	                                           27

4-1    Furnace classification	                              32

4-2    Basic diagram of furnace operation	                  34

4-3    Furnace efficiency	                                  35

4-4    Black body radiation	                                37

4-5    Burner alignment and heat distribution	              41

4-6    Waste heat diagram	                                  42

4-7    Heat exchanger	                                      42

4-8    Convection recuperators	                             43

4-9    Regenerative burners	                                44

4-10   Use of ceramic fiber	                                45

5-1    Maximum demand curve	                                48

5-2    Time-integrated demand	                              48

5-3    Load shifting	                                       49

5-4    Using ice storage to reduce peak demand	             50

5-5    Maximizing capacity	                                 51

5-6    Capacitor array	                                     52


                                    - ix -
6-1   Induction motor	                                 56

6-2   Boosting voltage	                                57

6-3   Load and power	                                  58

6-4   Voltage variation effect on moter performance	   60

6-5   Effect of enrgy-saving operation	                62

7-1   Design of centrifugal pump	                      64

7-2   Static head	                                     65

7-3   Friction head	                                   66

7-4   System with high static head	                    67

7-5   System with low static head	                     67

7-6   Pump operating point	                            68

7-7   Pump operating curves	                           69

7-8   Valve control method	                            70

7-9   Impeller trimming to reduce flow	                71

8-1   Basic diagram of a fan	                          76

8-2   Types of fans	                                   77

8-3   Types of fan blades	                             78

8-4   System resistance	                               80

8-5   Pitot tube measurement	                          81

8-6   Power consumption of volume control methods	     85

9-1   Losses in air compressor systems	                88

9-2   Types of compressors available	                  89

9-3   Compressor selection ratios	                     89

9-4   Power consumption values for compressors	        92


                                      -x-
10-1   Vapor compression refrigeration	      99

10-2   Vapor absorption refrigeration	       100


                                    - xi -
FOREWORD

With the rising costs of energy and concerns about global warming, it is
imperative that countries adopt the most efficient energy conservation
measures and technologies. Energy conservation must evolve as a way of life
in developing countries in the Asia-Pacific region given the limited availability
of resources. If we are to share commercial energy equitably across all
sections of society, it is necessary to conserve energy and use it efficiently.
Industries can become globally competitive when their production process
consumes the least amount of energy.

For this purpose, energy audits and conservation studies must be conducted
at regular intervals in all industries. One of the main bottlenecks in conducting
these studies is the lack of technical information on various type of equipment
and how energy performance should be measured.

The Working Manual on Energy Efficiency in SMEs is an attempt to address this
issue in a practical manner. The manual is the outcome of a series of projects
organized by the Asian Productivity Organization (APO) comprising e-learning
courses, international workshops organized with the National Productivity
Council, New Delhi, India and in Kish Island, Islamic Republic of Iran with the
National Iranian Productivity Center (NIPC) and national workshops conducted
by the author in 2008/09, during which the practical aspects of energy
efficiency were discussed. The manual explains energy efficiency aspects for
adoption by SMEs from various aspects, and is meant to provide the knowledge
needed for energy efficiency adoption in the SME Sector as a complementary
resource to the APO’s recently published manual Energy Auditing.

The Working Manual on Energy Efficiency for SMEs was developed by the APO
to promote the energy efficiency concepts so that industries in the region can
perform comprehensive energy audits and become more competitive. I hope
that it will find wide acceptance among industry professionals in the Asia-
Pacific.

Shigeo Takenaka
Secretary-General

Tokyo, February 2010


                                     - xiii -
1. FUELS AND COMBUSTION


Different types of fuels, such as solid, liquid and gaseous, are available for
firing in industrial boilers and furnaces.


     1.1 GENERAL CRITERIA FOR SELECTING THE FUEL TYPE

General criteria for selecting a fuel include the following:

Availability:
Availability is one of the important criteria in the selection of a fuel. It is
desirable to select a fuel that is indigenous and is locally available.
Storage and handling:
It is desirable to select a fuel that is easy to handle; and, for storage, adequate
space is required so that the fuel can be stored safely.
Cost of fuel:
Cost is a key deciding factor for any management.
Fuel properties:
The constituent properties are important from the perspectives of storage,
handling, preparation, and combustion equipment performance.
Calorific value:
The calorific value of a fuel is the measure of energy content; it is reported
as either gross calorific value (GCV) or net calorific value (NCV), units being
kCals/kG. The difference between the two calorific values is the latent heat
of condensation of the water vapor produced during the combustion process.
Efficiency is reported both ways (GCV as well as NCV basis). It is important to
note that the efficiency value reported with NCV basis would be higher than
the value reported with GCV basis.
Sulphur content in fuel:
The presence of sulphur in fuel is related to cold end corrosion in cool parts
of the chimney/stack, pre-heated air, and economic factors as the sulphur
content determines the minimum stack temperature for avoiding acid dewpoint
corrosion in a stack. This means higher losses from the stack when sulphur
content in the fuel is higher.
Analysis (composition) of fuel:
Two types of analysis, proximate and ultimate analysis, are used. Ultimate
analysis is at the elemental level, and includes carbon, hydrogen, nitrogen,
sulphur, etc, and is often useful in design, while proximate analysis gives the
broader composition of carbon, volatile matter, moisture, and ash.


                                      -1-
Training Manual on Energy Efficiency for Small and Medium Enterprises


               1.2 TYPICAL CALORIFIC VALUES OF FUELS

The calorific value of coal varies considerably depending on the ash, the
moisture content, and the type of coal. In fact coal is classified as of a
particular grade with respect to its GCV and ash content, and the price varies
accordingly. Calorific values of liquid fuels are much more consistent. Agro-
based fuels have varying calorific values with respect to composition. Natural
gas also has a varying calorific value due to varying constituent share.


Table 1-1 Gross calorific values of fuels

         Fuel                   Typical GCV (Kcal/Kg)

 Kerosene                                   11,100

 Diesel Oil                                 10,800

 Light Diesel Oil                           10,700

 Furnace Oil                                10,500

 LSHS                                       10,600

 Coal                                 4,000 to 6,000

 Natural Gas                    8,200 to 8,600 kCal/NM3

 Agro fuels                      3,100 to 4,500 KCal/Kg

 LPG                            11,600 to 11,700 KCal/Kg


                             1.3 COAL AS A FUEL

1.3.1 Storage and handling of coal
Storage of coal has its own disadvantages; these include build-up of inventory,
space constraints, deterioration in quality over time, and potential fire hazards.
Other losses associated with the storage of coal include oxidation, wind,
and carpet loss. So our main effort should be to minimize the loss due to
spontaneous combustion and carpet loss.


                                       -2-
Fuels and Combustion


               Figure 1-1 Examples of spontaneous combustion


Measures to minimize spontaneous combustion include:
•	 Releasing stagnant trapped air in stacked coal by inserting perforated pipes
   in coal heaps;
•	 Sprinkling water occasionally as needed, especially in the hot summer
   months;
•	 Adopting “first in, first out” principles for coal use and avoiding long
   durations of coal stacking/storage.

Measures to reduce carpet losses include:
•	 Preparing a hard surface for coal to be stacked upon;
•	 Preparing standard storage bays made of concrete and brick;
•	 Controlling the height of coal heaps in storage.

   In industry, modes of coal handling range from manual to conveyor
systems. It would be advisable to minimize the handling of coal so that further
generation of fine coal dust is avoided.

1.3.2 Preparation of coal
Sizing of coal
Proper coal sizing, to match the specifications of the type of combustion
system, helps to maintain even burning, reduce ash losses, and achieve better
combustion efficiency. Proper maintenance and upkeep of equipment like
crushers, screens, and mills is very important to ensure proper coal sizing in
accordance with manufacturer specifications.
    Using undersized coal will lead to increased loss through unburnt coal, and
using oversized coal can lead to clinker formation losses apart from increases
in unburnt losses.
Conditioning of coal
Segregation of fine particles from larger coal pieces can be reduced to a great
extent by conditioning coal with water. Water helps fine particles to stick to the
bigger lumps due to surface tension of the moisture, thus stopping fines from


                                      -3-
Training Manual on Energy Efficiency for Small and Medium Enterprises


falling through grate bars or being carried away by the furnace draft.
Blending of coal
When coal lots have excessive fines, it is advisable to blend the predominantly
lumped coal with lots containing excessive fines. Coal blending may thus help
to limit the proportion of fines in coal being fired to 25% or less. Blending of
different qualities of coal may also help to supply a uniform coal feed to the
boiler.

1.3.3 Parameters in coal combustion
Fixed carbon:
Fixed carbon gives a rough estimate of the heating value of coal. Higher
carbon means higher calorific value.
Volatile matter:
Volatile matter includes such substances as methane, hydrocarbons, hydrogen,
carbon monoxide, and incombustible gases like carbon dioxide and nitrogen
found in coal. Thus volatile matter is an index of the gaseous fuels present.
The typical proportion of volatile matter in coal is 20 to 35%. The presence of
volatile matter:
•	 Proportionately increases flame length and helps in easier ignition of coal;
•	 Sets minimum limits on the furnace height and volume;
•	 Influences secondary air requirement and distribution aspects.
Ash content:
Ash is inorganic material that will not burn. The typical proportion of ash
found in coal is 0.5 to 40%, and the ash presence has several detrimental
effects:
•	 It reduces handling and burning capacity.
•	 It Increases handling costs.
•	 It affects flame temperature, heat transfer, combustion efficiency, and
   boiler efficiency.
•	 It causes clinkering and slagging, affecting availability.
•	 It increases auxiliary power consumption.
Moisture content:
The presence of moisture decreases the heat content per kg of coal, typically
by amounts ranging from 0.5 to 10%. It also increases heat loss through stack
gases, due to evaporation and superheating. A small quantity, however, at
times helps in binding fines together.
Sulphur content:
The typical amount of sulphur found in coal is 0.5 to 5%. An excess of it
affects clinkering and slagging tendencies, corrodes mild steel chimneys and
other equipment such as air heaters and economizers, limits the exit flue gas
temperature due to acid dewpoint, and affects efficiency.


                                       -4-
Fuels and Combustion


                                1.4 OIL AS A FUEL

1.4.1 Tips on storage of fuel oil
•	 It is hazardous to store furnace oil in barrels.
•	 It is preferable to store oil in cylindrical tanks either above or below the
   ground.
•	 Storage capacity should be at least 10 days of normal consumption.
•	 Bund walls should be built around tanks.
•	 Periodical cleaning of tanks is necessary: annually for heavy fuels and
   every two years for light fuels.
•	 Leaks from joints, flanges, and pipelines must be attended to immediately,
   and should be avoided at all costs.
  - Loss of even one drop of oil every second can cost over 4000 liters a year.
  -   Fuel oil should be free from contaminants such as dirt, sludge, and water
      before it is fed to a combustion system.

1.4.2 Pumping choices for fuel oil
The following are good pumping choices for fuel oils:
•	 Positive displacement pumps are best for heavy fuel oils.
•	 Gear pumps are best for light diesel oils.
•	 Diaphragm pumps have a shorter service life, but are easier and less
   expensive to repair.
•	 Light fuels are best pumped with centrifugal or turbine pumps. When
   higher pressures are required, piston or diaphragm pumps should be used.

1.4.3 Parameters in liquid fuel combustion
Density:
Density is the ratio of mass of fuel to the volume of fuel.

      Density: Mass of fuel
               Volume of fue
      Reference temperature is typically 15ºC, and units are (kg/m3.)

Specific gravity:
Specific gravity is the ratio of weight of a given volume of oil to the weight of
the same volume of water at a given temperature.

      Specific gravity:               Weight of a given volume of oil

                          Weight of the same volume of water at a given temperature

Higher specific gravity normally means higher heating value:
      •	 Light oil        =   0.85–0.87


                                          -5-
Training Manual on Energy Efficiency for Small and Medium Enterprises


     •	 Furnace oil    =   0.89–0.95
     •	 L.S.H.S.       =   0.88–0.98

Viscosity:
Viscosity is internal resistance to flow of fluid. It influences the degree of pre-
heat required for handling, storage, and satisfactory atomization.


                      Figure 1-2 Temperature and viscosity


Specific heat:
The specific heat of a fuel oil is the amount of energy (kcals) needed to raise
the temperature of 1 kg of oil by 1ºC. The unit of specific heat is kcal/kgºC
and denotes heat capacity, and is useful in designing of heating systems. It
varies from 0.22 to 0.28 depending on the oil-specific gravity. It also helps to
quantify how much steam or electrical energy is required for preheating.
Flash point:
Flash point is the lowest temperature at which the fuel vapors released flash
momentarily when an open flame is passed over them. The flash point for
furnace oil is 66ºC. It affects safe storage conditions.
Pour point:
Pour point is the lowest temperature at which fuel oil can be poured/can
flow under prescribed conditions. It is a very rough indication of the lowest
temperature at which fuel oil can be readily pumped.
Water content:
Water content of fuel oil is normally very low as the product is handled
hot at the refinery site and a maximum limit of 1% is specified in the
standard, but water may be present in free or emulsified form. Water can
cause damage to the inside furnace surfaces during combustion, especially
if it contains dissolved salts. It can also cause spluttering of the flame at


                                       -6-
Fuels and Combustion


the burner tip, possibly extinguishing the flame and reducing the flame
temperature or lengthening the flame.

1.4.4 Pre-heating of fuel oil for pumping
Pre-heating oil in storage may be needed to make it less viscous and easily
pumpable.
   Heating an entire oil tank or outflow heater may be needed to heat oil
which is to be pumped away. Outflow heaters with steam or electricity are also
used often to ensure smooth pumping.

1.4.5 Pre-heating requirements for oil combustion
For pre-heating of oil, in-line heaters are to be used to raise oil temperature
from pumping to combustion temperature. In-line heaters are of either
electrical or steam tracing type. The pre-heat temperatures of oil are
determined by the viscosity of oil supplied at room temperature and the
recommended viscosity at the burner tip.


Table 1-2 Viscosity and pumping temperature

     Viscosity (Centistokes)            Pumping Temperature,        ºC


                 50                                   60

                230                                  104

                900                                  121


1.4.6 Parameters for good efficiency in fuel oil combustion
• 	 Maintain viscosity of oil of 100 Redwood sec I at burner tip by proper
    setting of pre-heat temperature.
• 	 Provide atomizing air at 1–3 kg/cm2 (about 2% of total air requirement)
•	 About 14 kg of air/kg of fuel oil is required for complete combustion.
   Optimum efficiency occurs with around 10% excess air.
•	 To control for excess air, flue gases should be continuously analyzed for
   CO2 or O2.
•	 Acid formation occurs at around 160ºC, and cold end corrosion should be
   avoided by maintaining stack temperature at above 160ºC.
•	 Slightest damage to the burner tip may increase fuel consumption by 10–
   15%, and hence any wornout tips should be replaced immediately.
•	 Oil pressure at the burner tip for pressure jet burners should be 17–20 kg/cm2.
•	 Correct flame is normally short. Flame impingement on walls and tubes is
   to be avoided since it causes carbon/soot deposits.


                                      -7-
Training Manual on Energy Efficiency for Small and Medium Enterprises


•	 Too short a flame indicates high excess air, and air supply to burners should
   be adjusted for a light hazy brown color at the chimney.


                             1.5 GASEOUS FUELS

LPG
LPG is a mixture of gases, predominantly propane and butane with a small
percentage of unsaturated hydrocarbon chains (propylene and butylene). It
is gaseous at normal atmospheric pressure, but may be condensed to a liquid
state at normal temperature by the application of moderate pressure. Liquid
LPG evaporates to produce about 250 times the volume of gas. Its vapor is
denser than air.
Natural gas
Methane is the main constituent of natural gas, accounting for about 95% of
the total volume. Other components are ethane, propane, butane, pentane,
and nitrogen. The content of sulphur is negligible. Natural gas is lighter than
air and disperses into air easily.

1.5.1 Gaseous fuel combustion
Combustion of gaseous fuels is similar to that of liquid fuels; in fact, highest
efficiencies can be achieved with gaseous fuels, as very good atomization
conditions can be achieved.


                              1.6 COMBUSTION

• 	 Combustion is a high-speed, high-temperature chemical reaction in which
    the rapid union of an element or compound with oxygen liberate heat –
    controlled explosion.
• 	 Combustion occurs when elements of fuel such as carbon and hydrogen
    combine with oxygen. (see Figure 1-3).

1.6.1 Chemical reactions involved in combustion of fuels
      C    + O2     CO2 + 8084       kcals/kg of carbon

      2C   + O2     2 CO + 2430      kcals/kg of carbon

      2H 2 + O2     2H2O + 28,922 kcals/kg of hydrogen

      S    + O2     SO2 + 2,224 kcals/kg of sulphur


                                       -8-
Fuels and Combustion


       Figure 1-3 Example of chemical reaction producing combustion


1.6.2 The three T’s (Temperature, Time, Turbulence) involved
	     in combustion efficiency
Time
All combustion reactions require sufficient time (residence time) for
completion, or else incomplete and inefficient combustion results.
Temperature
The temperature around the fuel release area at the burner tip must be must
be greater than ignition temperature, or else incomplete combustion results.
Turbulence
Proper turbulence close to the flame area helps to bring fuel and air into
intimate contact and provides ideal conditions for complete combustion.

1.6.3 Three types of combustion
•	 Perfect combustion is achieved when all the fuel is burnt, using only
   the theoretically ideal amount of air, but perfect combustion can rarely be
   achieved in practice.
•	 Good/complete combustion is achieved when all the fuel is burnt, using
   the minimal amount of excess air (over and above the theoretically ideal
   amount of air needed to burn the fuel). Complete combustion with minimum
   excess air is always our goal since heat losses due to high excess air in flue
   gases are unaffordable and unacceptable from the efficiency point of view.
•	 Incomplete combustion occurs when the fuel is not completely burnt
    and some escapes as CO in flue gases or as unburnts in refuse, both of
    which result in high losses and low efficiency.
Flue gas analysis of combustion is important, as it helps us to achieve
efficient combustion conditions by controlling excess air and reducing CO in
flue gases.


                                     -9-
Training Manual on Energy Efficiency for Small and Medium Enterprises


1.6.4 Types of draft systems used in combustion
The function of a draft in a combustion systems is to exhaust the products of
combustion into the atmosphere.
Natural draft:
A natural draft is the draft produced by a chimney alone. It is caused by the
difference in weight between the column of hot gas inside the chimney and the
column of outside air at the same height and cross-section.
Mechanical draft:
A mechanical draft is a draft artificially produced by fans. (There are three
basic types.)
Forced draft:
A forced draft system uses a fan to deliver the combustion air into the furnace,
and to force combustion products to pass through the boiler/furnace and up
the stack.
Induced draft:
An induced draft system provides suction at the chimney side, to evacuate
products of combustion all through the furnace. The furnace is kept at a slight
negative pressure below the atmospheric pressure.
Balanced draft:
A balanced draft is a combination of a forced and an induced draft system
where a forced-draft fan pushes combustion air into the furnace and an
induced-draft fan draws gases into the chimney, thereby providing a draft
to remove the gases from the boiler (0.05 to 0.10 in. of water gauge below
atmospheric pressure).

In all the above mechanical draft systems, electric power is used for fan
requirements.


      1.7 KEY RESULT AREAS FOR COMBUSTION EFFICIENCY


For energy efficiency in combustion systems, irrespective of the fuel used, the
following are the key result areas to be pursued:
• 	 Ensuring proper fuel storage, handling, and preparation, for achieving
    good combustion conditions.
• 	 Avoiding partial load operations of combustion equipment.
• 	 Operating with minimum excess air for fuel economy.
• 	 Operating with lowest the possible stack temperature for fuel economy.
• 	 Operating with minimum amounts of combustibles in refuse (ash) and CO
    in flue gases.
• 	 Operating with variable speed options for fan motors, if capacity control
    is needed (rather than inefficient damper control operations) in order to
    achieve power savings.


                                      - 10 -
2. ENERGY EFFICIENCY IN BOILERS


                           2.1 INTRODUCTION

A boiler is an enclosed pressure vessel that provides means for combustion
heat to be transferred into water until it becomes steam. The steam under
pressure is then usable for providing heat for an industrial process.
    When water is boiled into steam, its volume increases about 1,600 times,
producing a force that is almost as explosive as gunpowder. This makes a
boiler an extremely dangerous piece of equipment that must be treated with
utmost care.

A boiler system comprises three parts:
1.	 A feed water system,
2.	 A steam system, and
3.	 A fuel system.

   The feed water system provides water to the boiler and regulates it
automatically to meet the steam demand. Various valves provide access for
maintenance and repair. The steam system collects and controls the steam
produced in the boiler. Steam is directed through a piping system to the point
of use. Throughout the system, steam pressure is regulated using valves
and checked with steam pressure gauges. The fuel system includes all the
equipment used to provide fuel to generate the necessary heat. The equipment
required in the fuel system depends on the type of fuel used by the system.


              2.2 THE HEATING SURFACES IN A BOILER

The amount of heating surface of a boiler is expressed in square meters. Any
part of the boiler metal that actually contributes to making steam is a heating
surface. The larger the heating surface a boiler has, the higher will be its
capacity to raise steam. Heating surfaces can be classified into several types:
1.	 Radiant Heating Surfaces (direct or primary) include all water-backed
    surfaces that are directly exposed to the radiant heat of the combustion
    flame.
2.	 Convection Heating Surfaces (indirect or secondary) include all those
    water-backed surfaces exposed only to hot combustion gases.
3.	 Extended Heating Surfaces include economizers and super heaters used in
    certain types of water tube boilers.


                                    - 11 -
Training Manual on Energy Efficiency for Small and Medium Enterprises


               2.3 BOILER TYPES AND CLASSIFICATION

Broadly, boilers found in SME industries can be classified into four types:
fire tube boilers, water tube boilers, packaged boilers, and fluidized bed
combustion boilers.

2.3.1 Fire tube boilers
Fire tube or “fire in tube” boilers contain long steel tubes through which the
hot gases from a furnace pass and around which the water to be converted to
steam circulates. It is used for small steam capacities (up to 12000 kg/hr and
17.5kg/cm2).
    The advantages of fire tube boilers include their low capital cost and fuel
efficiency (over 80%). They are easy to operate, accept wide load fluctuations,
and, because they can handle large volumes of water, produce less variation in
steam pressure.

2.3.2 Water tube boilers
In water tube or “water in tube” boilers, water passes through the tubes
and the hot gasses pass outside the tubes. These boilers can be of single- or
multiple-drum type. They can be built to handle larger steam capacities and
higher pressures, and have higher efficiencies than fire tube boilers. They
are found in power plants whose steam capacities range from 4.5–120 t/hr,
and are characterized by high capital cost. These boilers are used when high-
pressure high-capacity steam production is demanded. They require more
controls and very stringent water quality standards.

2.3.3 Packaged boilers
The packaged boiler is so called because it comes as a complete package.
Once delivered to a site, it requires only steam, water pipe work, fuel supply,
and electrical connections in order to become operational. Package boilers are
generally of shell type with fire tube design so as to achieve high heat transfer
rates by both radiation and convection. These boilers are classified based on
the number of passes (the number of times the hot combustion gases pass
through the boiler). The combustion chamber is taken as the first pass, after
which there may be one, two, or three sets of fire tubes. The most common
boiler of this class is a three-pass unit with two sets of fire tubes and with the
exhaust gases exiting through the rear of the boiler.

2.3.4 Fluidized bed combustion (FBC) boilers
In fluidized bed boilers, fuel burning takes place on a floating (fluidized)
bed in suspension. When an evenly distributed air or gas is passed upward
through a finely divided bed of solid particles such as sand supported on a fine
mesh, the particles are undisturbed at low velocity. As air velocity is gradually
increased, a stage is reached when the individual particles are suspended in the
air stream. A further increase in velocity gives rise to bubble formation, vigorous


                                      - 12 -
Energy Efficiency in Boilers


turbulence, and rapid mixing, and the bed is said to be fluidized. Fluidized bed
boilers offer advantages of lower emissions, good efficiency, and adaptability for
use of low calorific-value fuels like biomass, municipal waste, etc.


            2.4 PERFORMANCE EVALUATION OF BOILERS

The performance of a boiler, which include thermal efficiency and evaporation
ratio (or steam to fuel ratio), deteriorates over time for reasons that include
poor combustion, fouling of heat transfer area, and inadequacies in operation
and maintenance. Even for a new boiler, deteriorating fuel quality and water
quality can result in poor boiler performance. Boiler efficiency tests help us
to calculate deviations of boiler efficiency from the design value and identify
areas for improvement.

2.4.1 Thermal efficiency
Thermal efficiency of a boiler is defined as the percentage of heat input that
is effectively utilized to generate steam. There are two methods of assessing
boiler efficiency: direct and indirect.
    In the direct method, the ratio of heat output (heat gain by water
to become steam) to heat input (energy content of fuel) is calculated. In
the indirect method, all the heat losses of a boiler are measured and its
efficiency computed by subtracting the losses from the maximum of 100. The
various losses are calculated as indicated in the example given below. The loss
quantification formulae are given in Chapter 4 (Section 4.2.1) of this manual.

2.4.2 Evaporation ratio
Evaporation ratio, or steam to fuel ratio, is another simple, conventional
parameter to track performance of boilers on-day-to-day basis. For small-
capacity boilers, direct method can be attempted, but it is preferable to
conduct indirect efficiency evaluation, since an indirect method permits
assessment of all losses and can be a tool for loss minimization.
    In the direct method, steam quality measurement poses uncertainties.
Standards can be referred to for computations and methodology of evaluation.
The audit worksheets given in APO’s Energy Audit Manual can also be used
for this purpose.

EXAMPLE OF DIRECT EFFICIENCY CALCULATION:
Calculate the efficiency of the boiler from the following data:
     - Type of boiler			                 : coal-fired
     - Quantity of steam (dry) generated : 8 TPH
     - Steam pressure (gauge)/temp       : 10 Kg/cm2 (g) / 180 degC
     - Quantity of coal consumed	           : 1.8 TPH
     - Feed water temperature		             : 85 degC
     - GCV of coal			                       : 3200 kcal/kg


                                     - 13 -
Training Manual on Energy Efficiency for Small and Medium Enterprises


     - Enthalpy of steam at 10 kg/cm2 (g) pressure : 665 kcal/kg (saturated)
     - Enthalpy of inlet fed water			              : 85 kcal/kg

                              8 TPH x1000Kgx (665–85) x 100
     Boiler efficiency (η)=
                                 1.8 TPH x 1000Kg x 3200

                          = 80.0%

     Evaporation Ratio = 8 TPH of steam/1.8 TPH of coal = 4.4


                     2.5 BOILER WATER TREATMENT

Boiler water treatment is an important area for attention since water quality
has a major influence on the efficiency of a boiler as well as on its safe
operation. The higher the pressure rating, the more stringent the water quality
requirements become. Boiler water quality is continuously monitored for
buildup of total dissolved solids (TDS) and hardness, and blowdown is carried
out (involving heat loss) to limit the same.
    Boiler water treatment methods are dependant upon quality limits specified
for TDS and hardness by the manufacturers, the operating pressure of the
boiler, the extent of make-up water used, and the quality of raw water at the
site. For small-capacity and low-pressure boilers, water treatment is carried
out by adding chemicals to the boiler to prevent the formation of scale, and
by converting the scale-forming compounds to free-flowing sludge, which can
be removed by blowdown.
Limitations:
Treatment is applicable to boilers where feed water is low in hardness salts,
where low pressure – high TDS content in boiler water is tolerated, and where
only small quantities of water need to be treated. If these conditions are not
met, then high rates of blowdown are required to dispose of the sludge, and
treatment become uneconomical based on heat and water loss considerations.
Chemicals Used:
Sodium carbonate, sodium aluminate, sodium phosphate, sodium sulphite, and
compounds of vegetable or inorganic origin are used for treatment. Internal
treatment alone is not recommended.


      2.6 ENERGY EFFICIENCY OPPORTUNITIES IN BOILERS

The various energy efficiency opportunities in boiler systems can be related to
combustion, heat transfer, avoidable losses, high auxiliary power consumption,
water quality, and blowdown, and are discussed below.

2.6.1 Reduce excess air
To minimize escape of heat through flue gases, reducing excess air (the air


                                      - 14 -
Energy Efficiency in Boilers


quantity over and above the theoretical amount needed for combustion) is one
of the most important methods of improving boiler efficiency.
•	 Perfect combustion is achieved when all the fuel is burned using only the
    theoretical amount of air, but perfect combustion can rarely be achieved in
    practice.
•	 Good/complete combustion is achieved when all the fuel is burned using
   the minimal amount of excess air (over and above the theoretical amount of
   air needed to burn the fuel). Complete combustion with minimum excess air
   is always our goal since heat losses due to high excess air in flue gases are
   unaffordable and unacceptable from the point of view of efficiency.
•	 Incomplete combustion occurs when all the fuel is not completely burned
   and escapes as CO in flue gases or as unburnts in refuse, both of which result
   in higher losses and low efficiency.
•	 Flue gas analysis of combustion is important as it helps to achieve efficient
   combustion conditions by excess air control and reduction of CO in flue gases.

   Using gas analyzers, the excess air quantity can be established from
measurement of oxygen or carbon dioxide. Based on oxygen value in flue gas,
excess air is given as:

     % of excess air = 100 *% of O2 /(21-% of O2).

   The relation between % O2 and flue gas and excess air is illustrated in
Table 2-1. The advantage of oxygen based analysis is that it is the same for
any fuel or fuel combination:

Table 2-1 Oxygen content and excess air

          % O2                 % excess air

            1                         5

            2                       10.52

            3                       16.67

            4                       23.53

            5                       31.25

            6                        40

            7                        50

            8                       61.7

            9                        77

           10                       90.9

           11                        110


                                     - 15 -
Training Manual on Energy Efficiency for Small and Medium Enterprises


   The effort, therefore, should be to operate the boiler with minimum %
O2 in flue gases (excess air), eliminating all avenues of excess air used for
combustion and in the flue gas path.

2.6.2 Minimize stack temperature
The stack temperature should be as low as possible, since it carries all the
heat from the fuel. However, it should not be so low that water vapor from
exhaust condenses on the stack walls. This is important in fuels containing
significant sulphur, as low temperature can lead to sulphur dew point
corrosion and acid attack effects on metallic parts in the flue gas path. A stack
temperature greater than 200ºC indicates potential for recovery of waste heat.
It also sometimes indicates the fouling and scaling of heat transfer/recovery
equipment. Boiler users must monitor stack temperature and compare it with
design value. When it has increased over time, maintenance of heat transfer
surfaces is called for. If the design value itself is high, the stack temperature
can be reduced by adopting one of the following waste heat recovery methods.
Waste heat recovery systems are typically shell and tube type heat exchangers
and heat transfer area, and other design features depend on flow rates,
temperature drop considered, etc.

2.6.2.1 Feed water preheating from waste heat of stack gases
Where feasible, adoption of feed water heating, using economizer from flue
gases with economizer application, gives the highest fuel economy, as one can
pre-heat feed water almost up to the saturation temperature of steam. The
economizer is a pressure vessel.
    A lower order and cheaper alternative for achieving fuel economy through
flue gas waste heat recovery would be a non-pressurized feed water heater,
which allows feed water pre-heating up to a maximum of 100ºC only.

   Every rise of 6ºC in boiler feed water temperature through waste heat
recovery would offer about 1% fuel savings.


2.6.2.2 Combustion air preheating from waste heat of stack gases
Combustion air preheating is an alternative to feed water heating, and can be
adopted, if no further scope for feed water pre-heating exists and where stack
gases still have waste heat potential left to be tapped.
   Shell and tube type and rotary regenerative type air pre-heaters and
regenerative burners are some of the options that can be adopted for waste
heat recovery.

   For every reduction in flue gas temperature by 22ºC for heat recovery, fuel
savings of about 1% can be achieved.

   The combustion air pre-heat temperature limiting value is decided by


                                      - 16 -
Energy Efficiency in Boilers


permissible exit flue gas temperature for avoiding chimney corrosion on
the one hand, and recommended limits of pre-heat temperature by burner
manufacturers on the other.

2.6.3 Avoid incomplete combustion
Incomplete combustion can arise from a shortage of air or sulphur of fuel or
poor distribution of fuel. It is usually obvious from the color or smoke, and
must be corrected immediately. In the case of oil and gas-fired systems, CO
or smoke (for oil-fired system only) with normal and high excess air indicates
burner system problems like poor mixing of fuel air at the burner. Incomplete
combustion can result from high viscosity, worn burner tips, carbonization on
burner tips, and deterioration of diffusers or spinner plates.
    With coal firing, unburnt carbon can escape through fly ash or bottom ash
and can lead to 2% to 3% heat loss. Coal preparation, sizing, and air supply
should be looked into, in order to avoid this loss.

2.6.4 Reduce scaling and soot losses
In oil and coal-fired boilers, soot buildup on tubes acts as an insulator
against heat transfer. Any such deposits should be removed on a regular
basis. Elevated stack temperatures may indicate excessive soot buildup. The
same result will also occur due to scaling on the water side. High exit gas
temperatures at normal excess air indicate poor heat transfer performance.
This condition can result from a gradual build-up of gas-side or water-side
deposits. Water-side deposits require a review of water treatment procedures
and tube cleaning, to remove the deposits. Incorrect water treatment, poor
combustion, and poor cleaning schedules can easily reduce overall thermal
efficiency. However, the additional cost of maintenance and cleaning must be
taken into consideration when assessing savings.

    Every millimeter thickness of soot coating increases the stack temperature
by about 55 ºC. A deposit of 3mm of soot can cause an increase in fuel
consumption by 2.5%. A 1mm thick scale (deposit) on the water side could
increase fuel consumption by 5% to 8%.

    Stack temperature should be checked and recorded regularly as an
indicator of soot deposits and soot removal frequencies decided by trends of
temperature rise of flue gas. Fire-side (fuel additives) and water-side additives
may be judiciously adopted where justified.

2.6.5 Minimize radiation and convection losses
The boiler’s exposed surfaces lose heat to the surroundings depending on the
surface area and the difference in temperature between the surface and the
surroundings. The heat loss from the boiler shell is normally assumed as fixed
energy loss, irrespective of the boiler output. With modern boiler designs, this
may represent only 1.5% of the gross calorific value at full rating, but it will
increase to around 6% if the boiler operates at only 25% output. Repairing or
augmenting insulation can reduce heat loss through boiler walls.


                                     - 17 -
Training Manual on Energy Efficiency for Small and Medium Enterprises


2.6.6 Adopt automatic blowdown controls
As a first choice, ensure maximum condensate recovery, since condensate
is the purest form of water, and this would help reduce dependence on
make-up water and also blowdown requirements. Uncontrolled, continuous
blowdown is very wasteful. For optimizing blowdown, automatic controls can
be installed, which can sense and respond to boiler water conductivity and
pH. Relate blowdown to TDS limits/Conductivity of boiler and feed water TDS/
Conductivity, by online monitoring.

2.6.7 Optimize boiler steam pressure
Wherever permissible, operating a boiler at lower steam pressure (a lower
saturated steam temperature, higher latent heat of steam, and a similar
reduction in the temperature of the flue gas temperature) helps to achieve fuel
economy. In some cases, the process demands are not continuous, and there
are periods when the boiler pressure could be reduced. Pressure could be
reduced in stages, and no more than a 20% reduction should be considered.
Care should be taken that adverse effects, such as an increase in water
carryover from the boiler owing to pressure reduction, do not negate any
potential savings.

2.6.8 Variable speed control for fans, blowers, and pumps
Generally, combustion air control in boilers is achieved by throttling dampers
fitted at forced and induced draft fans. Though dampers are a simple means
of control, they are an inefficient means of capacity control as they lack
accuracy, giving poor control characteristics at the top and bottom of the
operating range. If the steam demand characteristic of the boiler is variable,
the possibility of replacing an inefficient damper and throttling controls by
electronic Variable Speed Drives should be considered for reducing auxiliary
power consumed in boiler fans and pumps.

2.6.9 Effect of boilder loading on efficiency
Optimum boiler efficiency occurs at 65%–85% of full load. As the steam
demand falls, so does the value of the mass flow rate of the flue gases through
the tubes. This reduction in flow rate for the available heat transfer area
helps to reduce the exit flue gas temperature by a small extent, reducing the
sensible heat loss. However, at below 50% load, most combustion appliances
need more excess air to burn the fuel completely, and this would increase the
sensible heat loss. Operation of a boiler at low loading should be avoided.

2.6.10 Boiler replacement
If the existing boiler is old and inefficient, not capable of firing cheaper
substitute fuels, over or under-sized for present requirements, not designed
for ideal loading conditions, or not responsive to load changes, replacement by
a more efficient one needs to be explored.


                                      - 18 -
Energy Efficiency in Boilers


                               2.7 CASE STUDY

Installing Economizer for Heat Recovery:
A paper mill retrofitted an economizer to existing boiler. The general
specifications of the boiler are given in Table 2-2:


Table 2-2 Boiler specifications

 Boiler Capacity          Feed Water       Steam Pressure
                                                                         Fuel Oil
      (T/h)               Temp. (ºC)           (bar)

          8                  110                      18              Furnace oil

    The thermal efficiency of the boiler was measured and calculated by the
indirect method using a flue gases analyzer and a data log. The result is
summarized below:
      Thermal efficiency	    : 81%
      Flue gas temperature : 315ºC
      CO2 %		                : 13CO (ppm)       : 167
    The temperature in the flue gas was in the range of 315 to 320ºC. The
waste heat in the flue gas was recovered by installing an economizer, which
transfers waste heat from the flue gases to the boiler feed water. This resulted
in a rise in feed water temperature by about 26ºC.
Basic data:
•	   Average quantity of steam generated....    :   5T/hr
•	   Average flue gas temperature....	          :   315ºC
•	   Average steam generation/kg of fuel oil    :   14 kg
•	   Feed water inlet temperature....	          :   110ºC
•	   Fuel of supply rate			                     :   314 kg/hr
•	   Flue gas quantity			                       :   17.4 kg/kg of fuel
Fuel savings achieved:
•	 Quantity of fuel gases	 : 314x17.4 = 5463.6 kg/hr
•	 Quantity of recovered heat in the flue gases
   				                   : 5463.6x0.24x(315-200)=150795 kCal/hr
•	 Raise in the feed water temperature          : 26ºC
•	 Savings in fuel oil	      : 16.3 kg/h
•	 Annual operating hours : 8600
•	 Annual fuel oil savings : 8600x16.3 = 140,180 kg

    Through recovery of waste heat by installation of an economizer, the paper
mill was thus able to achieve fuel savings of 16.3kg/h (in other words 5.19%
of previous fuel consumption).


                                       - 19 -
Training Manual on Energy Efficiency for Small and Medium Enterprises


           2.8 TIPS FOR ENERGY EFFICIENCY IN BOILERS

•	 Establish a boiler efficiency-maintenance program. Start with an energy
   audit and follow-up, then make a boiler efficiency-maintenance program a
   part of your continuous energy management program.
•	 Preheat combustion air with waste heat. Add an economizer to preheat
   boiler feed water using exhaust heat.
   (Every 22°C reduction in flue gas temperature increases boiler efficiency by
   1%.)
•	 Use variable speed drives on large boiler combustion air fans with variable
   flows instead of damper controls.
•	 Insulate exposed hot oil tanks.
•	 Clean burners, nozzles, and strainers regularly.
•	 Inspect oil heaters to ensure proper oil temperature.
•	 Close burner air and/or stack dampers when the burner is off, to minimize
   heat loss up the stack.
•	 Introduce oxygen trim controls (limit excess air to less than 10% on clean
   fuels).
   (Every 5% reduction in excess air increases boiler efficiency by 1%; every
   1% reduction of residual oxygen in stack gas increases boiler efficiency by
   1%.)
•	 Automate/optimize boiler blowdown. Recover boiler blowdown heat.
•	 Optimize de-aerator venting to minimize steam losses.
•	 Inspect door gaskets for leakage avoidance.
•	 Inspect for scale and sediment on the water side.
   (Every 1mm-thick scale (deposit) on the water side could increase fuel
   consumption by 5%–8 %.)
•	 Inspect heating surfaces for soot, fly-ash, and slag deposits on the fire
   side.
   (A 3mm-thick soot deposition on the heat transfer surface can cause an
   increase in fuel consumption of 2.5%.)
•	 Optimize boiler water treatment.
•	 Recycle steam condensate to the maximum extent.
•	 Study part–load characteristics and cycling costs to determine the most
   efficient combination for operating multiple boiler installations.
•	 Consider using multiple units instead of one or two large boilers, to avoid
   partial load inefficiencies.


                                      - 20 -
3. ENERGY EFFICIENCY IN STEAM DISTRIBUTION 	
   AND UTILIZATION


                           3.1 INTRODUCTION

Steam is used for generating power as well as for process heating applications
in industries such as sugar, paper, fertilizer, refineries, petrochemicals,
chemicals, food, synthetic fiber and textiles. The following characteristics of
steam make it so popular and useful to the industry:
•	 Highest specific heat and latent heat;
•	 Highest heat transfer coefficient;
•	 Easy to control and distribute;
•	 Cheap and inert.


               3.2 IMPORTANT PROPERTIES OF STEAM

Liquid enthalpy (also known as “Sensible Heat”)
When water is first heated to the boiling point, it is called sensible heat
addition (with change in temperature); liquid enthalpy (hf) is the “enthalpy”
(heat energy) available when it is in the water form, and is typically
represented in kCal/kg.
Enthalpy of evaporation (also known as “Latent Heat”)
Once water reaches its boiling point, the enthalpy of evaporation (hfg) is the
additional heat energy to be added to this hot water in order to change it into
steam. There is no change in temperature during evaporation, hence the name
latent heat.
    The temperature at which water boils is also called the boiling point or
saturation temperature. This value depends on the steam pressure and
increases as the steam pressure increases. As the steam pressure increases,
the useful latent heat energy in the steam (enthalpy of evaporation) actually
decreases.
    The total heat carried by dry saturated steam or enthalpy of saturated
steam is given by the sum of these two enthalpies (hf +hfg).
    If the heat energy added is less than required latent heat, wet steam
is produced, which contains partial water content, and the total heat carried
by such wet steam will be lower than that of dry saturated steam. It is
detrimental to use wet steam for process and steam distribution. Dryness
fraction is the property which tells us how dry the steam is.
    If saturated steam is heated further to a still higher temperature, it
starts behaving like a hot gas, and this steam is called superheated steam.
Superheating is the addition of heat to dry saturated steam without an
increase in pressure. The temperature of superheated steam, expressed as


                                        - 21 -
Training Manual on Energy Efficiency for Small and Medium Enterprises


degrees above saturation corresponding to the pressure, is known as the
degree of superheat.


         3.3 THE TEMPERATURE–ENTHALPY RELATIONSHIP

The properties of steam provided in the steam tables can also be expressed in
a graphic form. Figure 3-1 shows the relationship between the enthalpy and
the temperature at different pressures, and is known as a phase diagram. This
is also called the Mollier diagram, and it helps us to understand the conditions
and transition zones of water to steam and to superheated steam.


                            Figure 3-1 Phase diagram


                              3.4 STEAM TABLES

The steam tables (see Table 3-1) present various steam parameters at
different pressure and temperature state points and are a helpful tool for
design and analysis of steam systems.


                                      - 22 -
Energy Efficiency in Steam Distribution and Utilization


Table 3-1 Extract from the steam table

                                     Enthalpy in Kcal/kg                Specific
 Pressure    Temperature
                                Water      Evaporation      Steam       Volume
 (kg/cm2)        ºC
                                 (hf)         (hfg)          (hg)       (m3/kg)

     1             100          100.09        539.06       639.15         1.673

     2             120          119.92        526.26       646.18         0.901

     3             133          133.42        517.15       650.57         0.616

     4             143          143.70        509.96       653.66         0.470

     5             151          152.13        503.90       656.03         0.381

     6             158          159.33        498.59       657.92         0.321

     7             164          165.67        493.82       659.49         0.277

     8             170          171.35        489.46       660.81         0.244


                  3.5 STEAM DISTRIBUTION SYSTEM

For efficient steam distribution, an adequate quantity of steam that is dry and
free of air must reach the plant at correct pressure; the diameter of steam
piping should be optimum, in order to minimize pressure drops and reduce
investment and operating costs.


                3.6 STEAM PIPING: GOOD PRACTICES


•	 While laying new pipes, it is often necessary to compromise between
   aesthetics and the architect’s plans.
•	 Steam pipes should be laid along the shortest possible distance.
•	 Provisions need to be made for proper draining of condensate. For example,
   a 100mm well-lagged pipe 30 meters in length, carrying steam at 7kg/cm2
   pressure, can condense nearly 10kg of water in the pipe in one hour unless it
   is removed from the pipe through traps.
•	 The pipes should run with a fall (slope) of not less than 12.5mm for every
   3 meters distance, in the direction of flow.
•	 Drain pockets should be provided every 30–50 meters and at any low point
   in the pipe network.
•	 Expansion loops are required to take care of the expansion of pipes when
   they get heated up.
•	 Automatic air vents should be fixed at the dead ends of steam mains, to
   allow removal of air, which will tend to accumulate.


                                     - 23 -
Training Manual on Energy Efficiency for Small and Medium Enterprises


          3.7 TIPS ON STEAM PIPING SIZING AND LAYOUT

Pipe sizing
Proper sizing of steam pipelines helps in minimizing pressure drop. The
velocities for various types of steam are:
•	 Superheated: 50–70 m/sec
•	 Saturated: 30–40 m/sec
•	 Wet or Exhaust: 20–30 m/sec
     The steam piping should be sized based on permissible velocity and the
available pressure drop in the line. A higher pipe size will reduce the pressure
drop and thus the energy cost. However, higher pipe size will increase the
initial installation cost. By use of smaller pipe size, even though the installation
cost can be reduced, the energy cost will increase due to higher-pressure
drop. Thus, optimum sizing is necessary. (Pressure drop change is inversely
proportional to the 5th power of diameter change.)
Pipe redundancy
Pipe redundancy is to be avoided in steam distribution since it leads to
significant losses. All redundant pipelines must be eliminated; this could
reduce steam distribution losses significantly
Drain points
Drain points help in removing water in the pipes due to condensation of steam.
The presence of water in steam is undesirable as it causes water hammer,
leading to damage to steam pipes and eventually leakages. Steam traps must
be provided at the drain points to avoid leakage of steam.


                  3.8 MAINTENANCE OF STEAM TRAPS

The key functions of steam traps are:
•	 to discharge condensate once it is formed;
•	 to prevent steam from escaping; and
•	 to discharge air and non-condensable gases.
Steam trap performance is very important for fuel economy in all steam-use
systems and is one of the major energy efficiency opportunities which can
yield surprising results.
•	 Traps that are open, meaning those draining steam and condensate, result
    in loss of energy and direct loss of condensate (the purest form of water)
    and significant economic loss as boiler operating costs increase.
•	 Traps that are closed, or become blocked, result in reduced heating
   capacity of steam heating equipment, and direct loss of production, which
   is undesirable.


                                      - 24 -
Energy Efficiency in Steam Distribution and Utilization


Some tips for steam trap monitoring and maintenance are presented here:
•	 Dirt is one of the most common problem areas. Dirt, scale, or foreign material
   finds its way to the traps and often damages the valve seat, preventing it from
   closing properly and leading to leakages.
•	 Strainers provided for handling dirt and other material before it reaches the
   traps must be maintained properly.
•	 Sight glasses, fitted after the traps, permit visual identification of blowing
   traps and need to be properly taken care of.
•	 If the trap selected is not the appropriate type and size for the given
   application, significant losses take place.
•	 Inverted bucket and thermodynamic traps should have intermittent
   condensate discharge.
•	 Float and thermostatic traps should have a continuous condensate
   discharge.
•	 Flash steam and leaking steam are not the same. Leaking steam is
   continuous, like an exhaust, while flash steam is intermittent and like a
   cloud.
•	 A regular schedule of maintenance should be adopted, to repair and replace
   defective traps in the interest of fuel economy.
•	 Mechanisms within the traps produce sonic and ultrasonic sounds due to passage
   of condensate and steam. Using suitable listening devices, ranging from a simple
   screwdriver a mechanic’s stethoscope, or an ultrasonic trap tester a trap monitoring
              ,                                                      ,
   system can be established in an industry.
•	 Similarly, temperature sensing by contact and non-contact devices can help
   to monitor trap performance.


    3.9 GOOD PRACTICES FOR EFFICIENT STEAM UTILIZATION

3.9.1 Steam leakage quantification
Steam leakage is a visible indicator of waste and must be avoided. Regular
leakage monitoring and rectification is one of the major steam economy
measures.
    A simple graph (see Figure 3-2) can be used for estimating steam leakage.
The plume is the visible jet of steam issuing from the point of leakage. And,
irrespective of pressure, the length of plume helps us to quantify steam loss in
kg per hour.


                                        - 25 -
Training Manual on Energy Efficiency for Small and Medium Enterprises


                        Figure 3-2 Eestmating steam leakage
Example: For a plume length of 700 mm, steam loss is 10 kg/hr.


3.9.2 Providing dry steam for the process
Almost all heat transfer processes call for dry steam, and it is necessary to
ensure dry steam conditions for efficient use. Wet steam can reduce plant
productivity and product quality, and can cause damage to most items of
equipment.
     Disadvantages of allowing wet steam include lower heat content, extended
process time, irregular heating, creation of barriers to heat transfer, and
overloading of steam traps. At the same time, superheated steam is not
desirable for process heating because of its poor heat transfer coefficient; and
it also takes time to give up superheat by conduction. The benefit of using dry
steam is that heat transfer is rapid.
     To ensure dry steam for processing, steam separators may be fitted
appropriately at the steam head and near steam use equipment.


                                          - 26 -
Energy Efficiency in Steam Distribution and Utilization


                             Figure 3-3 Dry steam

3.9.3 Utilizing steam at the lowest acceptable pressure for the
	     process
The latent heat in steam reduces as the steam pressure increases. It is this
latent heat of steam that takes part in the heating process when applied to a
direct heating system. Thus, it is important that its value be kept as high as
possible. This can only be achieved if we try to obtain lower steam pressures.
As a guide, the steam should always be generated and distributed at the
highest possible pressure, but utilized at as low a pressure as possible since it
then has higher latent heat.
    However, it can also be seen from the steam tables that the lower the
steam pressure, the lower will be its temperature. Since temperature is the
driving force for the transfer of heat at lower steam pressure, the rate of heat
transfer will be slower and the processing time greater. In equipment where
fixed losses are high (e.g. big drying cylinders), there may even be an increase
in steam consumption at lower pressures due to increased processing time.
There are, however, several items of equipment with which one can profitably
go in for lower pressures and realize economy in steam consumption without
materially affecting production time. Depending on the equipment design, the
lowest possible steam pressure with which the equipment can work should be
selected without sacrificing either production time or steam consumption.

3.9.4 Insulation of steam pipelines and hot process equipment
Heat can be lost due to radiation from steam pipes. For example, while lagging
steam pipes, it is common to see flanges uncovered. An uncovered flange
is equivalent to leaving 0.6m of pipeline unlagged. If a steam pipe 0.15m in
diameter has 5 uncovered flanges, there would be a loss of heat equivalent to
wasting 5 tons of coal or 3000 liters of oil a year. Uncovering is usually done to
facilitate checking the condition of the flange, but at the cost of considerable
heat loss. The remedy is to provide prefabricated insulation covers, which can
be easily removed when necessary. The insulating materials used are cork,


                                      - 27 -
Training Manual on Energy Efficiency for Small and Medium Enterprises


glass wool, rock wool, and asbestos.
    Table 3-2 indicates the heat loss from a hot uninsulated surface to the
environment:


Table 3-2 Quantity of heat lost at different temperatures

 Difference in Temperature between
                                                   Heat Loss
      Ambient and Hot Surfaces
                                                 (kCal/m2 /hr)
                 (ºC)

                     50                                500

                    100                                1350

                    200                                3790

                    400                               13640


   This is based on 35ºC ambient temperature, 0.9 emissivity factor, and still-
wind conditions. The effective insulation of a steam system can bring down the
heat losses to less than 75 kCal/m2/hr.

  It is desirable to limit hot surface temperature to not more than 20ºC above
ambient temperature, by insulation, for fuel economy.


3.9.5 Minimizing heat transfer barriers
In indirect heating, a temperature difference is required to transfer heat
from steam to the material. The main barrier to heat transfer is the thermal
conductivity of the pipe carrying steam. Other impediments include the heat
transfer barrier of an air film as well as scaling on the steam side, and scaling
as well as a stagnation product film on the product side.

   For instance, it has been estimated that air is 1500 times more resistant to
heat transfer than steel and 13,000 times more resistant than copper.

     Air is probably the best heat insulator ever known. It is also the most likely
material to be trapped in all steam supplies, because when steam condenses,
air always tries to take its place, on account of the partial vacuum created. Air
is also carried into the steam space by incoming steam during startup. It is,
therefore, essential that steam-heated equipment should be so designed that
all trapped air is pumped out automatically using proper air venting systems.
Similarly, scaling of heat transfer areas should be regularly monitored and
taken care of by measures like cleaning and de-scaling.


                                      - 28 -
Energy Efficiency in Steam Distribution and Utilization


3.9.6 Condensate recovery
Steam condenses after giving off its latent heat in the heating coil or the
jacket of the process equipment. A sizable portion (about 25%) of the total
heat contained in the steam leaves the process equipment as condensate (hot
water). If this hot condensate is returned to the boiler house, it will reduce the
fuel requirements in the boiler.

   For every 6 º C rise in the feed water temperature, there will be
approximately 1% saving of fuel in the boiler.

    Further, in most cases, the boiler water has to be chemically treated to
prevent or reduce scale formation, whereas condensate is almost entirely
pure water, which needs no treatment. With a high share of the condensate
returning to the boiler house, the expenses involved for water treatment can
therefore be reduced by an appreciable amount.

3.9.7 Flash steam recovery
Flash steam is produced when high pressure condensate is flashed in an
enclosure to produce low pressure steam, and can be used for heating
application. The specially designed enclosure is called a flash vessel, which is
available with most steam equipment suppliers.
    The flash steam quantity can be calculated by the following formula with
the help of steam tables:

     Flash steam is calculated in % = S1 – S2) / L2
where
     S1 is the sensible heat of higher pressure condensate,
     S2 is the sensible heat of steam at lower pressure (at which it has been
     flashed),
     and L2 is the latent heat of flash steam (at lower pressure)
    Thus, higher the steam pressure and lower the flash steam pressure, the
greater is the quantity of flash steam that can be generated. In many cases,
flash steam from high-pressure equipment is made use of directly by the low-
pressure equipment, to reduce the use of fresh steam, through pressure-
reducing valves.
    Flash steam can also be used on low-pressure applications like direct
injection and can replace an equal quantity of fresh steam that would
otherwise be required.

3.9.8 Reducing the work to be done by steam
All the equipment should be supplied with dry saturated steam. To reduce the
work done by steam, if any product is to be dried, a press could be used to
squeeze as much water as possible, before being heated up in a dryer using
steam, which is a more efficient method.


                                      - 29 -
Training Manual on Energy Efficiency for Small and Medium Enterprises


   Always use the most economical way to remove the bulk of water from
the wet material. Steam can then be used to complete the process. For this
reason, hydro extractors, spin dryers, squeeze or calendar rolls, presses, and
other equipment are initially used in many drying processes to remove the
mass of water. The efficiency with which this operation is carried out is most
important.

     For example, in a laundry for finishing sheets, the normal moisture content
of the sheets as they leave the hydro extractor is 48% by weight. Thus,
the steam heated iron has to evaporate nearly 48% of water. This requires
62kg of steam. If, due to inefficient drying in the hydro-extractor, finishing
sheets arrive at the iron with 52% moisture content, 52kg of water has to be
evaporated; the steam quantity required is 67 kg. So, for the same quantity of
finished product, the steam consumption increases by 8%.

    When steam reaches the place where its heating is required, it must be
ensured that the steam has no more work to do than is absolutely necessary.
Air–heater batteries, for example, which provide hot air for drying, will use the
same amount of steam whether the plant is fully or partly loaded. So, if the
plant is running only at 50% load, it is wasting twice as much steam (or twice
as much fuel) as is necessary.
    By reducing work done by steam, energy saving can be achieved by the
following measures:
•	 Reduction in operating hours;
•	 Reduction in steam quantity required per hour;
•	 Use of more efficient technologies;
•	 Avoiding part load operations; and
•	 Minimizing wastage.

3.9.9 Proper utilization of directly injected steam
Where feasible, the heating of a liquid by direct injection of steam is often
desirable. The equipment required is relatively simple, cheap, and easy to
maintain. No condensate recovery system is necessary. The heating is quick,
and the sensible heat of the steam is used up along with the latent heat,
making the process thermally efficient. If the dilution of the tank contents and
agitation are not acceptable in the process (i.e., if direct steam agitation is not
acceptable), indirect steam heating is the only answer.
    Ideally, the injected steam should be condensed completely as the bubbles
rise through the liquid. This is possible if the inlet steam pressures are kept
very low, around 0.5 kg/cm2 to 1.0 kg/cm2. If pressures are high, the velocity
of the steam bubbles will also be high, and they will not have sufficient time
condense before they reach the surface.
    A large number of small-diameter holes (2–5mm), facing downwards, may
be drilled on the steam distributor pipe. This will help in dissipating the velocity
of bubbles in the liquid. Adopting thermostatic control of steam admitted is
highly desirable.


                                      - 30 -
Energy Efficiency in Steam Distribution and Utilization


3.9.10 Proper air venting
A 0.25mm thick air film offers the same resistance to heat transfer as a 330mm
thick copper wall. The presence of air inside the process equipment will reduce
the partial pressure of steam in the steam air mixture, thus dropping the
overall temperature of the steam air mixture, which is the heating medium.
    However, it is impossible to avoid the entry of air into a steam system that
is working intermittently. If the steam condenses during the shutdowns, air
enters the process equipment from the steam mains at the time of startup.
    Adequate air venting provision should be made at appropriate positions in
the pipelines, to purge air as quickly as possible from the equipment, making
heat transfer more efficient.


                                     - 31 -
4. ENERGY EFFICIENCY IN FURNACES


                          4.1 INTRODUCTION

A furnace is a piece of equipment used to melt metal for casting or to heat
materials in order to change their shape (rolling, forging, etc.) or their
properties (heat treatment).


          4.2 TYPES AND CLASSIFICATION OF FURNACES

Furnaces can be broadly classified into three categories based on mode of
heat transfer, mode of charging, and mode of heat recovery. The furnace
classification is given in Figure 4-1.


                      Figure 4-1 Furnace classification


        4.3 CHARACTERISTICS OF AN EFFICIENT FURNACE

A furnace should be designed so that in a given time, as much of the material
as possible can be heated to as uniform a temperature as possible with the
least possible fuel and labor.


                                   - 32 -
Energy Efficiency in Furnaces


                     4.4 FURNACE ENERGY SUPPLY

The products of flue gases directly contact the stock, so the type of fuel chosen
is of importance. For example, some materials will not tolerate sulphur in the
fuel. In addition, use of solid fuels will generate particulate matter, which may
affect the stock placed inside the furnace. Hence, the majority of furnaces use
liquid fuel, gaseous fuel, or electricity as energy input. Melting furnaces for
steel and cast iron use electricity in induction and arc furnaces. Non-ferrous
melting furnaces utilize oil as fuel.


                        4.5 OIL-FIRED FURNACES

Furnace oil is the major fuel used in reheating and heat treatment furnaces.
LDO is used in furnaces where the presence of sulphur is undesirable. Some
furnaces operate with efficiencies as low as 7% as against up to 90% achieved
in other combustion equipment such as boilers. Factors reducing efficiency
include the high temperatures at which the furnaces have to operate, huge
thermal masses, high exit flue gas temperatures, standing losses during
soaking, partial load operations, losses due to lack of temperature controls,
opening losses, delays in stock removal even after heating has been achieved,
and others. For example, a furnace heating the stock to 1200 ºC will have
its exhaust gases leaving at least at 1200ºC if no heat recovery is installed,
resulting in a huge heat loss through the stack.


                    4.6 TYPICAL FURNACE SYSTEMS

4.6.1. Forging furnaces
Forging furnaces use an open fireplace system, and most of the heat is
transmitted by radiation. It is used for preheating billets and ingots to attain
forging temperature. Thus, furnace temperature is maintained at 1200–
1250ºC. The typical loading in a forging furnace is 5 to 6 tons, with the furnace
operating for 16 to 18 hours daily. The total operating cycle can be divided
into (i) heat-up time (ii) soaking time, and (iii) forging time. Specific fuel
consumption depends upon the type of material and number of such “reheats”
required.


                                     - 33 -
Training Manual on Energy Efficiency for Small and Medium Enterprises


                 Figure 4-2 Basic diagram of furnace operation

4.6.2 Rerolling mill furnaces
i) Batch type furnaces
Batch type furnaces are used for heating scrap, small ingots, and billets
weighing 2–20 kg. For batch type rerolling, charging and discharging of the
“material” is done manually, and the final product is in the form of rods, strips,
etc. The operating temperature is 1200ºC. The total cycle time can be divided
into heat-up time and rerolling time.
ii) Continuous pusher type furnaces
The process flow and operating cycles of a continuous pusher type of furnace
is the same as that of a batch furnace. The operating temperature is 1250ºC.
The material or stock recovers a part of the heat in flue gases as it moves
down the length of the furnace. Heat absorption by the material in the furnace
is slow, steady, and uniform throughout the cross-section compared with a
batch type furnace.


     4.7 PERFORMANCE EVALUATION OF A TYPICAL FURNACE

A furnace heat balance will have the components shown in Figure 4-3. It can
be seen that some of these losses do not exist in equipment like boilers, which
is the reason why boilers are often much more efficient than furnaces.


                                      - 34 -
Energy Efficiency in Furnaces


                           Figure 4-3 Furnace efficiency


Normal furnace losses include the following:
•	 Heat storage in the furnace structure;
•	 Losses from the furnace outside walls or structure;
•	 Heat transported out of the furnace by the load conveyors, fixtures, trays;
•	 Radiation losses from openings, hot exposed parts, etc.;
•	 Heat carried by cold air infiltration into the furnace; and
•	 Heat carried by the excess air used in the burners.


4.7.1 Furnace efficiency
The efficiency of a furnace is the ratio of useful output to heat input. The
furnace efficiency can be determined by both a direct and an indirect method.
Direct method testing
    The efficiency of the furnace can be computed by measuring the amount of
fuel consumed per unit weight of material produced from the furnace.

                                                    Heat in the stock
      Thermal efficiency of the fumance=
                                               Heat in the fuel consumed

   The quantity of heat to be imparted (Q) to the stock can be found from the
formula

      Q=mxCpx(t2-t1)


                                         - 35 -
Training Manual on Energy Efficiency for Small and Medium Enterprises


where

Q    = Quantity of heat in kCal

m = Weight of the material in kg

Cp = Mean specific heat, in kCal/kgºC

t2   = Final temperature desired, in ºC

t1   = Initial temperature of the charge before it enters the furnace, in ºC

Indirect method testing
Similar to the method of evaluating boiler efficiency by indirect methods,
furnace efficiency can also be calculated by an indirect method. Furnace
efficiency is calculated after subtracting sensible heat loss in flue gas, loss due
to moisture in flue gas, heat loss due to openings of the furnace, heat loss
through the furnace skin, and other unaccounted losses from the input to the
furnace.
    The parameters that must be taken into account in order to calculate
furnace efficiency using the indirect method include hourly furnace oil
consumption, material output, excess air quantity, temperature of flue gas,
temperature of the furnace at various zones, skin temperature. and hot
combustion air temperature. Efficiency is determined by subtracting all the
heat losses from 100.
Measurement parameters
The following measurements should be made to calculate the energy balance
in oil-fired reheating furnaces (e.g. heating furnaces):
i) Weight of stock / Number of billets heated;
ii) Temperature of furnace walls, roof, etc,;
iii) Flue gas temperature;
iv) Flue gas analysis; and
v) Fuel oil consumption.
   Instruments like infrared thermometer, fuel consumption monitor, surface
thermocouple and other measuring devices are required to measure the above
parameters. Reference manuals should be referred to for data like specific
heat, humidity, etc.

4.7.2 Useful data
•	 In addition to conventional methods, Japanese Industrial Standard (JIS)
   GO 702: “Method of heat balance for continuous furnaces for steel” is used
   for the purpose of establishing the heat losses and efficiency of reheating
   furnaces.
•	 Heat transfer by radiation is proportional to the absolute temperature to
   the power of 4. Consequently, the radiation losses increase exponentially
   as temperature increases. Table 4-1 illustrates the observation.


                                      - 36 -
Energy Efficiency in Furnaces


Table 4-1 Radiant heat loss comparison at various temperatures

   C1       C2          K1             K2                                   Relative
                                                     (K1/K2)4
  (ºC)     (ºC)    (C1 +273)      (C2 +273)                        Radiant Heat Transfer


  700       20         973            293              122             1.0 (baseline value)

  900       20         1173           293              255                     2.1

  1100      20         1373           293              482                    3.96

  1300      20         1573           293              830                    6.83

  1500      20         1773           293              1340                   11.02

  1700      20         1973           293              2056                   16.91

(Note: C1 is hot body temperature and C2 is ambient air temperature)

   In other words, the radiation losses from an open furnace door at 1500ºC
are 11 times greater than the losses of the same furnace at 700ºC. A good
practice for iron and steel melters is to keep the furnace lid closed at all times
and maintain a continuous feed of cold charge onto the molten bath.

4.7.3 Determining black body radiation at a particular temperature
If a furnace body has an opening, the heat in the furnace escapes to the
outside as radiant heat. Heat loss due to openings can be calculated by
computing black body radiation at furnace temperature, and multiplying these
values by emissivity (usually 0.8 for furnace brick work), and the factor of
radiation through openings. The black body radiation losses can be directly
computed from the curves as given in Figure 4-4.


                             Figure 4-4 Black body radiation


                                            - 37 -
Training Manual on Energy Efficiency for Small and Medium Enterprises


Furnace utilization factor
Utilization has a critical effect on furnace efficiency and is a factor that is often
ignored or underestimated. If the furnace is at temperature, then standby
losses occur whether or not a product is in the furnace.
Standby losses
Energy is lost from the charge or its enclosure in the forms of heat:
(a) conduction, (b) convection; and/or (c) radiation.
Furnace draft control
Furnace pressure control has a major effect on fuel-fired furnace efficiency.
Running a furnace at a slight positive pressure reduces air ingress and can
increase its efficiency.
Theoretical heat
In the example of melting one ton of steel from an ambient temperature of
20ºC:

   Specific heat of steel	           = 0.186 Wh/kg/ºC.

   Latent heat for melting of steel = 40 Wh/kg/ºC.

   The melting point of steel	       = 1600 ºC.

   Theoretical total heat	           = Sensible heat + Latent heat

      Sensible heat = 1000 kg x 0.186 Wh/kgºC x (1600-20)ºC = 294 kWh/T

      Latent heat     = 40 Wh/kg x 1000 kg				                       = 40 kWh/T

      Total heat     = 294 + 40						                                = 334 kWh/T

   So the theoretical energy needed to melt one ton of steel from 20ºC = 334 kWh.

   Actual energy used to melt to 1600ºC is 700 kWh.

   Efficiency = 334 kWh x 100 = 48%
                   700 kWh
    Typical furnace efficiency values for reheating and forging furnaces (as
observed in few trials undertaken by an Energy Auditing Agency on such
furnaces) are given in Tables 4-2 and 4-3.


                                       - 38 -
Energy Efficiency in Furnaces


Table 4-2 Pusher type billet reheating furnaces (for rolling mills)

       Furnace               Specific Fuel        Thermal Efficiency
       Capacity              Consumption               Achieved

      Upto 6 T/hr            40-45 Ltrs/ton               52%

        7-8 T/hr             35-40 Ltrs/ton              58.5%

      10-12 T/hr             33-38 Ltrs/ton               63%

      15-20 T/hr             32-34 Ltrs/ton              66.6%

    20 T/hr & above          30-32 Ltrs/ton               71%


Table 4-3 Pusher type forging furnaces

       Furnace               Specific Fuel        Thermal Efficiency
       Capacity              Consumption               Achieved

    500-600 kg/hr            80-90 Ltrs/ton               26%

        1.0 T/hr             70-75 Ltrs/ton               30%

      1.5-2.0 T/hr           65-70 Ltrs/ton              32.5%

      2.5-3.0 T/hr           55-60 Ltrs/ton               38%


    The fuel consumption figures in the tables correspond to conditions when
the furnaces were operating continuously at their rated capacity.
Note: These are trial figures and cannot be presumed as standards for the furnaces concerned.


                                           - 39 -
Training Manual on Energy Efficiency for Small and Medium Enterprises


      4.8 GENERAL FUEL ECONOMY MEASURES IN FURNACES

4.8.1 Combustion with minimum excess air
To obtain complete combustion of fuel with the minimum amount of air, it is
necessary to control air infiltration, maintain the pressure of combustion air,
and monitor fuel quality and excess air. Higher excess air will reduce flame
temperature, furnace temperature, and heating rate.

A simple equation to calculate excess air from the percentage of oxygen in flue
gases for any fuel in a combustion system is:

% excess air = (% Oxygen)*100/ (21 – % Oxygen).

     On the other hand, if the excess air is reduced, then unburnt components
in flue gases will increase and will be carried away in the flue gases through
the stack. Therefore the optimization of combustion air is the most attractive
and economical measure for energy conservation. The impact of this measure
is higher when the temperature of the furnace is high.
     The amount of heat lost in the flue gases depends upon amount of excess
air. In the case of a furnace carrying away flue gases at 900ºC, percentage of
heat lost is shown in Table 4-4.


Table 4-4 Heat loss in flue gas based on excess air level

                  % of total heat in the fuel carried away
   Excess Air                 by waste gases
                          (flue gas temp. 900ºC)

       25                            48

       50                            55

       75                            63

      100                            71


4.8.2 Correct heat distribution
For proper heat distribution, when using oil burners, the following measures
should be taken:
 i) Prevent flame impingement by aligning the burner properly to avoid
    touching the material. The flame should not touch any solid object and
    should propagate clear of any solid object. Any obstruction will disturb
    the atomized fuel particles, thus affecting combustion and creating black
    smoke. If flame impinges on the stock, there will be an increase in scale
    losses, which are often hidden in nature but precious in value.


                                      - 40 -
Energy Efficiency in Furnaces


ii)	 If the flames impinge on refractories, the incomplete combustion products
     can settle and react with the refractory constituents at high flame
     temperatures.
iii)	 The flames of different burners in the furnace should stay clear of each
      other. If they intersect, inefficient combustion will occur. It is desirable to
      stagger the burners on the opposite sides.
iv)	 The burner flame has a tendency to travel freely in the combustion space
      just above the material. In small reheating furnaces, the axis of the burner
      is never placed parallel to the hearth but always at an upward angle.
      Flames should not hit the roof.


               Figure 4-5 Burner alignment and heat distribution


v)	 Designs with few large-capacity burners produce a long flame, which
    may be difficult to contain within the furnace walls. More burners of less
    capacity give a better distribution of heat in the furnace and also increase
    furnace life.
vi)	 For small reheating furnaces, it is desirable to have a long flame with
     golden yellow color while firing furnace oil for uniform heating. The flame
     should not be so long that it enters the chimney and comes out through
     the top or through the doors. This will happen if excess oil is fired. In such
     cases, a major portion of additional fuel is carried away from the furnace.


                 4.9 FURNACE WASTE HEAT RECOVERY

Since furnaces operate in high temperature domains; the stack temperatures
are very high, and waste heat recovery is a major energy efficiency
opportunity in furnaces. The recovered waste heat is conventionally used for
either pre-heating of combustion air or to heat he material itself.


                                       - 41 -
Training Manual on Energy Efficiency for Small and Medium Enterprises


                         Figure 4-6 Waste heat diagram


4.9.1 Some common waste heat recovery systems
Simple double pipe type heat exchangers
These generally take the form of concentric cylinders, in which the
combustion air passes through the annulus and the exhaust gases from the
furnace pass through the center. Such recuperators are very cheap to make,
are suitable for use with dirty gases, have a negligible resistance to flow, and
can replace the flue or chimney if space is limited.


                           Figure 4-7 Heat exchanger


                                      - 42 -
Energy Efficiency in Furnaces


Convection recuperators
Convection recuperators consist essentially of bundles of drawn or cast tubes.
Internal and/or external fins can be added to assist with heat transfer. The
combustion air normally passes through the tubes and the exhaust gases
outside the tubes, but there are some applications where this is reversed. For
example, with dirty gases, it is easier to keep the tubes clean if the air flows
on the outside. Design variations include ‘U’ tube and double pass systems.
Convection recuperators are more suitable for exhaust gas temperatures of
less than about 900°C. Beyond 900ºC, ceramic recuperators can be used which
can withstand higher temperatures.


                     Figure 4-8 Convection recuperators


Regenerative burners
In regenerative burners, the heat of the gases is stored before they exit
and incoming combustion air is preheated from this stored heat, switching
between two chambers alternately. The cycle time is accurately controlled for
switchover. Options include regenerative burners and regenerative air pre-
heaters for heat recovery.


                                    - 43 -
Training Manual on Energy Efficiency for Small and Medium Enterprises


                        Figure 4-9 Regenerative burners


4.9.2 Ceramic fiber for reducing thermal mass
Thermal mass in a furnace contributes significantly to storage heat loss,
especially in those batch furnaces with huge refractory brickwork. Every time
the furnace goes through a heating cycle, the whole refractory mass needs
to be heated all over. Introduction of ceramic fiber to replace conventional
fire brick lining helps to reduce thermal mass to almost 15% of the original,
helping to lower fuel consumption and batch time reduction as well.


                                      - 44 -
Energy Efficiency in Furnaces


                        Figure 4-10 Use of ceramic fiber


4.9.3 Ceramic coatings to improve emissivity
Heat transfer in a furnace depends mainly on radiation, which in turn depends
on emissivity. At higher temperatures, the emissivity decreases and is on
the order of 0.3. High emissivity refractory coating, if applied on the internal
surface of the furnace, increases the emissivity to 0.8, thus contributing to
increased heat transfer. The application of high-emissivity coatings in furnace
chambers promotes rapid and efficient transfer of heat, uniform heating, and
extended life of refractories and metallic components such as radiant tubes
and heating elements. For intermittent furnaces or where rapid heating is
required, use of such coatings is found to reduce fuel consumption up to 10%.
Other benefits are temperature uniformity and increased refractory life.


 4.10 TIPS FOR IMPROVING ENERGY EFFICIENCY IN FURNACES

General
•	 Establish a management information system on loading, efficiency, and
   specific fuel consumption.
•	 Prevent infiltration of air, using doors or air curtains.
•	 Monitor O2/CO2/CO ratios and control excess air level.
•	 Improve burner design, combustion control, and instrumentation.
•	 Ensure that the furnace combustion chamber is under slight positive
   pressure.
•	 Use ceramic fiber linings in the case of batch operations.
•	 Match the load to the furnace capacity.
•	 Retrofit with heat recovery devices.


                                       - 45 -
Training Manual on Energy Efficiency for Small and Medium Enterprises


•	 Investigate cycle times and avoid extended hours of runtime and excess
   heating.
•	 Provide temperature controllers.
•	 Ensure that the flame does not touch the stock.
Insulation
•	 Repair damaged insulation.
•	 Use an infrared gun to check for hot wall areas during hot weather.
•	 Ensure that all insulated surfaces are clad with aluminum lining.
•	 Insulate all flanges, valves, and couplings.
Waste heat recovery
•	 Recover maximum heat from flue gases.
•	 Ensure upkeep of heating surfaces by regular cleaning.


                                      - 46 -
5. ELECTRICAL LOAD MANAGEMENT


                            5.1 INTRODUCTION

In industrial type electricity billing, where mostly a two-part tariff is adopted,
the consumer pays for two components:
•	 For the maximum demand (kVA) recorded during billing duration; and
•	 For the energy (kWh) consumed during billing duration.
   Electrical load management for a company involves measures to reduce
maximum demand and to improve power factors so that the maximum
demand charges are minimized. Energy consumption mainly relates to end-use
equipment efficiency and can be reduced by various relevant measures.


                     5.2 MAXIMUM DEMAND BASICS

Maximum demand charges relate to the fixed cost of capacity blocked to be
provided for serving a consumer’s needs.
     A tri-vector meter installed at the consumer end records the maximum
demand registered by a consumer during billing duration, apart from other
important consumption features like active power (kWh), reactive power
(kVarh), apparent power (kVah), and power factor (PF).
     At present many utilities have a “time of day tariff” in place, and charge a
consumer variable rates for maximum demand drawn during different times
of day. For instance, there could be lower rates for night hours when the
utility is lightly loaded and higher rates during evening hours when utilities
are stretched to meet maximum load demands. It would thus help to study
the load curve patterns and, based on prevalent tariff structure provisions,
optimize maximum demand to save on maximum demand charges.

5.2.1 Load curve of a plant
From Figure 5-1, one can see that demand varies from time to time, due to
the combination of users and consumption of electricity changing all the time.
The demand is measured over a predetermined time interval and averaged out
for the interval as shown by the horizontal dotted line.


                                     - 47 -
Training Manual on Energy Efficiency for Small and Medium Enterprises


                      Figure 5-1 Maximum demand curve


5.2.2 MD recording
It is important to note that while maximum demand is recorded, it is not the
instantaneous demand drawn, as is often misunderstood, but rather is the
time-integrated demand over the duration of the recording cycle.
As example, in an industry, if the draw over a recording cycle of 30 minutes is:

2500 kVA for 4 minutes

3600 kVA for 12 minutes

4100 kVA for 6 minutes

3800 kVA for 8 minutes,


                      Figure 5-2 Time-integrated demand


                                      - 48 -
Electrical Load Management


the MD recorder will be computing MD for the duration of 30 minutes as:

     (2500 x 4) + (3600 x 12) + (4100 x 6) + (3800 x 8)
                                                                 = 3606.7 kVA
                                 30


                 5.3 LOAD MANAGEMENT STRATEGIES

Various techniques applicable to optimize maximum demand of an industry
include:
•	 Rescheduling loads;
•	 Staggering of motor loads;
•	 Storage of products/in process material/process utilities like refrigeration;
•	 Shedding of non-essential loads;
•	 Operation of captive power generation; and
•	 Reactive power compensation.

5.3.1 Rescheduling and staggering loads
In Figure 5-3 the left side shows the demand curve of a consumer before load
shifting, and the right side shows the demand curve of a unit after load shifting
(leading to kVA reduction).


                            Figure 5-3 Load shifting


5.3.2 Storage of products in process materials and process
	     utilities like refrigeration
In many plants, studies reveal extra capacity available, for producing certain
products, in process material and utilities like pumps and refrigeration, all
of which consume electricity. Using these capacities during lean demand


                                      - 49 -
Training Manual on Energy Efficiency for Small and Medium Enterprises


durations like late night hours, the maximum demand during peak hours
can be optimized. One example may be pumping and storing all water needs
during off-peak hours in overhead tanks and reducing corresponding demand
during peak hours.

5.3.3 How ice storage helps in demand control
In order for 1kg of ice to form, about 80kcals must be rejected from water
at 0ºC, and forming 38kg of ice will require around one TR of refrigeration.
Thus, making ice during low peak demand night hours and using this stored
refrigeration capacity during daytime helps to reduce corresponding peak
demand. Dairy plants, pharmaceuticals, bulk drugs, and processing industries
with massive refrigeration capacities can adopt refrigeration storage for MD
control since every TR of load shifted means 1.2 to 2.5 kW per TR demand
shifting.


             Figure 5-4 Using ice storage to reduce peak demand


               5.4 POWER FACTOR (PF) IMPROVEMENT

In most modern electrical distribution systems, the predominant loads are
resistive and inductive.
•	 Typical resistive loads are incandescent lighting and resistance heating.
•	 Typical inductive loads are A.C. Motors, induction furnaces, transformers
   and ballast-type lighting.
Inductive loads require two kinds of power:
•	 Active (or working) power to perform the work (motion), and
•	 Reactive power to create and maintain electromagnetic fields.


                                      - 50 -
Electrical Load Management


                        Figure 5-5 Maximizing capacity


     The vector sum of the active power and reactive power make up the total
(or apparent) power used. This is the power to be supplied by the utility for
meeting all active and reactive power needs of users and utility electrical
generation and distribution systems are designed accordingly.
     Since it is only the active power or kilowatts that are of real use, there is
an advantage in operating with a power factor close to unity—that is, drawing
close to zero reactive power from the utility. In this way, the capacity of a
utility electrical network can be optimally used, with minimum losses. In fact,
the utilities penalize users for low power factors and sometimes incentivize
high power factors at the user end, in their tariff structures. Installing and
maintaining capacitors helps industry to balance the reactive power of
inductive loads and to improve power factors at the user end, which also offers
benefits of better voltage, reduced maximum demand, and lower distribution
losses within the industry premises.
Capacitor locations:
For motors of 50 hp and above, it is best to install power factor correction
capacitors at the motor terminals since distribution circuit loading is reduced.
Figure 5-6 shows capacitor banks connected at the bus for each motor control
centre. This compromise to Method 1 will reduce installation costs. The least
expensive method shows capacitor banks connected at the service entrance.
However, the disadvantage is that higher feeder currents still flow from the
service entrance to the end-of-line equipment and will only benefit the utility in
a real sense.


                                     - 51 -
Training Manual on Energy Efficiency for Small and Medium Enterprises


                           Figure 5-6 Capacitor array


PF improvement can significantly reduce distribution loads and maximum
demand within the facility.

    As current flows through conductors, the conductors are heated up due to
resistance property; this is called distribution loss. In industry this loss can be
anywhere from less than 1% to as high as 6%. Distribution loss is proportional
to square of current handled, which declines as the power factor is improved,
especially at use end locations.
     % Loss Reduction = 100 x 1- (Original P.F.)2
                                      (Desired P.F.)2

We know that active power is the product of apparent power and power factor;
to reduce the maximum demand, it would help to keep the power factor close
to unity. Reduced maximum demand charges are evaluated against investment
for capacitors, for payback analysis. Tariff structure data and monthly bill
analysis can help the utility to figure out cost benefits.

For maximum demand optimization, it would be desirable to adopt automatic
PF controls.


                                      - 52 -
Electrical Load Management


5.4.1 Example problem:

If the maximum demand is 1500 kVA at 0.85 PF, calculate the reduction
in demand with improved PF to 0.95, and work out the cost benefits of PF
improvement.

Active power kW which is being presently served = 1500 x 0.85 = 1275
New kVA for serving same 1275 kW of active power at 0.95 PF = 1275/0.95 = 1342
Reduction in maximum demand with higher PF =1500 kVA – 1342 kVA =158 kVA.

At USD8 per kVA, MD reduction would help to reduce monthly demand charges
by USD1264 or annual savings of USD15168.

Applying relevant multiplying factor of 0.291 from following table, the kVAr
rating works out to 371.

The investment for capacitors @ USD6 per kVAr works out to USD2226.
Against savings of USD15168 per annum, the measure thus offers a simple
payback period of 0.15 years, a hugely attractive opportunity.


                                   - 53 -
Training Manual on Energy Efficiency for Small and Medium Enterprises


Table 5-1 is useful for sizing capacitor banks.


Table 5-1 Multipliers to determine capacitor KVAR required for power factor
	         correction


    This table can be used for selecting capacitor ratings. Based on present
Power Factor on Y axis and desirable Power Factor on X axis, this table gives
the multiplying factor to be applied to measured kilowatt value, to arrive at the
rating in kVAr of the capacitor to be installed.


                                      - 54 -
Electrical Load Management


5.5 TIPS FOR ENERGY-EFFICIENT ELECTRICAL LOAD MANAGEMENT

•	 Review the tariff agreement with the utility supplier to meet requirements
   at optimum cost.
•	 Balance kilowatt loads on three phases of supply.
•	 Schedule plant operations to maintain a high load factor.
•	 Shift loads to off-peak times where possible.
•	 Minimize maximum demand by controlling loads through an automatic
   demand controller.
•	 Stagger start-up times for equipment with large starting currents to
   minimize load peaking.
•	 Use standby electric generation equipment for on-peak high load periods.
•	 Correct power factor to well above 0.90 by installing additional capacitors
   and automatic power factor controllers, avoid motor under-load conditions,
   and take advantage of PF improvement incentives if any are available.
•	 Ensure that all capacitors are in line and functional, by checking charging
   current.
•	 Relocate transformers close to main loads.
•	 Set transformer taps to optimum settings.
•	 Disconnect primary power to transformers that do not serve any active
   loads.
•	 Consider on-site captive generation or cogeneration as a cheaper/efficient
   alternative.
•	 Export power to grid if there is any surplus in captive generation.
•	 Periodically, calliberate the utility’s electricity meter with your own meter
   for accuracy.
•	 Shut off unnecessary and idle process equipment, utilities, and office
   equipment like computers, printers, and copiers at night.


                                     - 55 -
6. ENERGY EFFICIENCY IN ELECTRIC MOTORS


                            6.1 INTRODUCTION

Motors convert electrical energy into mechanical energy by the interaction
between the magnetic fields set up in the stator and rotor windings.
Industrial electric motors can be broadly classified as induction motors,
direct current motors, or synchronous motors. All motor types have the same
four operating components: stator (stationary windings), rotor (rotating
windings), bearings, and frame (enclosure). Squirrel cage induction motors
account for over 90% of the population.


                          Figure 6-1 Induction motor


          6.2 SALIENT ASPECTS OF MOTOR PERFORMANCE

Motor speed
The speed of a motor is the number of revolutions in a given time frame,
typically revolutions per minute (RPM). The synchronous speed in RPM is
given by the following equation, where the frequency is in hertz or cycles per
second:
                                    120 x Frequency
     Synchronous Speed (RPM) =
                                          Poles

     It can also be shown that the speed of an AC motor can be varied infinitely
by changing the frequency. The actual speed at which the motor operates will
be less than the synchronous speed. The difference between synchronous and
full load speed is called slip and is measured in as a percentage. It is calculated
using the following equation:


                                      - 56 -
Energy Efficiency in Electric Motors


     Slip (%) = Synchronous Speed-Full Load Speed x 100
                         Synchronous Speed

Voltage frequency relation
Impedance of an inductor is proportional to frequency. At low frequencies, this
impedance approaches zero, making the circuit appear to be a short-circuit.
To maintain a constant flux in the motor, the voltage to the motor must also
be changed. This ratio is constant over most of the entire speed range By
keeping the ratio constant, a fixed speed induction motor can be made to run
at variable speed offering constant torque. At low speeds, due to the motor
having inherent resistance in the windings, the ratio must be altered to provide
enough magnetizing flux to spin the motor. The VFD allows this relationship to
be altered by changing the voltage boost parameter.


                         Figure 6-2 Boosting voltage


Application of variable frequency drives and variable speed drives, for capacity
control of pumps, fans, compressors, process control, as against other
conventional methods, is the most relevant energy conservation opportunity in
the electric motor industry.

Load versus power factor
As the load on the motor is reduced, the magnitude of the active current
declines. However, there is not a corresponding reduction in the magnetizing
current, with the result that the motor power factor declines, or gets worse,
with a reduction in applied load.


                                    - 57 -
Training Manual on Energy Efficiency for Small and Medium Enterprises


                              Figure 6-3 Load and power


Motor efficiency versus load

                     Output            Input−Losses            746×HP Output
      Efficiency =            ×100 =                  ×100 =                   ×100
                     Input                Input                 Watts Input

Electric motors are electromagnetic energy converters whose function is based
on the force exerted between electrical currents and magnetic fields, which are
usually electrically excited as well. Due to their principle of functioning, electric
motors have a relatively high efficiency. A typical efficiency value for an 11 kW
standard motor is around 90%, for 100 kW, up to 94%. The efficiency levels of
large motors are higher than those of smaller motors.

It should be noted that peak efficiency occurs at about 75% loading and drops
significantly when loading is below about 30%.


                       6.3 THE TYPES OF MOTOR LOSS

Core losses:
Core loss is around 22% of total loss at full load. Core losses represent the
energy required to magnetize the core material (hysteresis) and are expended
by small electric currents that flow in the core (eddy currents). Core loss of a
motor is constant and is independent of the motor load current, and thus it
accounts for a much higher percentage of the losses at low motor loads.
Stator and rotor resistance losses:
Loss due to stator and rotor resistance is about 56% of total loss at full load. It
occers due to the current flow (I) through the motor conductors of resistance
(R). Loss is proportional to the square of the stator and rotor current and is
also called I2R loss; it is influenced largely by loading on motor.


                                         - 58 -
Energy Efficiency in Electric Motors


Friction and windage losses:
Loss due to friction and wind represents about 11% of total loss at full load.
This loss results from friction within the shaft bearings and from the resistance
to air being circulated through the motor by cooling fans. It depends on
bearing quality and condition to a great extent.
Stray load losses:
Stray load loss is about 11% of total loss at full load. Stray load loss results
from leakage of magnetic flux, and depends on the rotor slot design. Like I2R
losses, it is dependent on the square of the load current and tends to increase
with motor load.


      6.4 ENERGY EFFICIENCY OPPORTUNITIES IN MOTORS

Two approaches, namely a systems approach and operational measures, can
be adopted for energy efficiency improvements in motors.

6.4.1 Systems approach
The key to systematic or large energy savings in motors involves several
fundamental procedures:
•	 Switching off equipment when not needed.
•	 Providing energy-efficient capacity controls (variable frequency drives or
   VFDs) instead of throttling.
•	 Process re-engineering for reducing work done.


6.4.2 Operational measures
Operational measures for energy efficiency include the following:
Maintain voltage close to rating:
    Although motors are designed to operate within 10% of nameplate voltage,
large variations significantly reduce efficiency, power factor, and service life.
When operating at less than 95% of design voltage, motors typically lose 2 to
4 points of efficiency, and service temperatures increase up to 20ºF, greatly
reducing insulation life. Running a motor above its design voltage also reduces
power factor and efficiency.


                                     - 59 -
Training Manual on Energy Efficiency for Small and Medium Enterprises


             Figure 6-4 Voltage variation effect on motor performance


  Minimize phase imbalance:
  The voltage of each phase in a three-phase system should be of equal
  magnitude, symmetrical, and separated by 120°. Phase balance should be within
  1% to avoid derating of the motor. Several factors can affect voltage balance:
  single-phase loads on any one phase, different cable sizing, or faulty circuits.
  An unbalanced system increases distribution system losses and reduces motor
  efficiency.
      Voltage imbalance is defined as 100 times the maximum deviation of the
  line voltage from the average voltage on a three-phase system divided by the
  average voltage. If line voltages measured are 431, 438, and 427, the average
  is 432. The voltage imbalance is given by

         432-427
                   ×100 = 1.1%
           432

  Minimize rewind losses:
Rewinding can reduce motor efficiency and reliability. A rewind-versus-replace
decision is quite complicated and depends on such variables as the rewind
cost, expected rewind loss, energy-efficient motor purchase price, motor size
and original efficiency, load factor, annual operating hours, electricity price,
and others. The majority of users would wish to rewind the motor rather than


                                        - 60 -
Energy Efficiency in Electric Motors


replace it, because it is a cheaper option; but the disadvantage is that there
is not much quality assurance. During a motor failure, or in the stripping of
the winding from the stator core prior to rewinding, heating involved causes
exposure to high temperatures. These temperatures can, in many cases, affect
the electrical characteristics of the stator core steel and result in increased iron
losses and lower motor efficiency.
    The only area of possible loss reduction available during the rewinding
process is the copper (l2r) losses in the motor. Reduction is achieved by
rewinding the motor with a larger-diameter wire so that the effective conductor
area is increased, where slot area permits, resulting in a lower winding
resistance. The effect is to lower the stator copper loss.

    Rewinding for lower copper losses is possible only if additional slot space is
available in the original stator slot, often released by use of new, higher class
of insulating material replacing older, lower grade insulation. It follows that not
all motors are candidates for efficiency improvement by rewinding.
    Many industries operate with a population of 40%–50% rewound motors,
and it would be useful to evaluate all such motors and introduce a phasing-
out program and a quality assurance program for motor efficiency based on
measurement of load losses, stator resistance values, etc.

Optimize transmission efficiency:
Motor power transmission equipment, including shafts, belts, chains, and
gears, should be properly installed and maintained. When possible, use flat
belts in place of V-belts. Helical gears are more efficient than worm gears; use
worm gears only with motors under 10hp. As far as possible, it is better to
have a direct drive, thus avoiding losses in the transmission system.
Operate motors loaded in star mode:
When a delta motor is connected in star mode, the voltage across the windings
is reduced with a corresponding reduction in flux produced, current drawn, and
torque produced; in essence, the motor is de-rated electrically, with least cost.

    Star mode operation is applicable as an energy-saving opportunity
with motors loaded to less than 50% of rating, as a low-cost alternative to
replacement.

Use soft starters for induction motors:
AC induction motors are frequently used at fixed speeds, and the
overwhelming majority of these are powered by direct on-line (DOL) starters
and Star Delta starters which are characterized by jerky startup operations,
high transient currents, maximum demand surges, and possible damage to
motor windings and insulation. Soft starters use electronic controls, PLC, to
gradually increase the voltage applied to the motor, starting slowly and limit
start up currents. Since voltage is reduced, current also comes down, and
there is reduction in iron and copper losses. Power factor is improved as the
reactive current is reduced due to lower flux strength requirements, which in
turn results in a higher power factor. (The starting current with a soft starter


                                      - 61 -
Training Manual on Energy Efficiency for Small and Medium Enterprises


is only 1.5 to 2 times the full load current as against 5–7 times in the case of
other conventional starters). With soft starters, cable sizes, contactors, and
motors can be sized lower during the initial selection.


                   Figure 6-5 Effect of energy-saving operation


Conduct a motor load survey and performance assessment:
A motor load survey is a very useful audit step to bring out saving
opportunities in electric motors. The steps involved are:
    Inventory and list all motors by plant, department, and type of equipment,
using an hour basis.
   Document all name plate data.
   Measure run values of input power parameters, alongside machine side
parameters.
   Document and record the following:
1.	 Cases of repeated motor burnout.
2.	 Motors with high no-load losses.
3.	 Percentage of motors loading in kW as against rated input kW.
4.	 Occurrences of voltage unbalance, low power factor, loose connections, and
    low terminal voltage.
5.	 Occurrences of any mechanical problems like slippages, local heating,
    vibration, mis-alignment, poor ventilation, and dusty conditions.
6.	 Machine-side inefficiencies like idle operations, throttling of pumps, damper
    operations in fans, leakages, etc.
      Research candidate areas for VFD application for energy efficiency.

   The margins in motor efficiency may often be less than 5% of consumption,
but the load survey can help to make changes in driven machines or systems,
which can yield 30%–40% energy savings.


                                       - 62 -
Energy Efficiency in Electric Motors


   6.5 TIPS FOR ENERGY EFFICIENCY IN MOTORS AND DRIVES


•	 Properly size to the load for optimum efficiency. (High-efficiency motors
   offer 4%–5% higher efficiency than standard motors.)
•	 Use energy-efficient motors where economical.
•	 Use synchronous motors to improve power factor.
•	 Check alignment.
•	 Provide proper ventilation. (For every 10ºC increase in motor operating
   temperature over the recommended peak, the motor life is estimated to be
   halved.)
•	 Check for under-voltage and over-voltage conditions.
•	 Balance the three-phase power supply. (An umbalanced voltage can
   reducemotor input power by 3%–5%.)
•	 Demand efficiency restoration after motor rewinding. (If rewinding is not
   done properly, the efficiency can be reduced by 5%–8%.)

Drives:

•	 Use variable-speed drives for large variable loads.
•	 Use high-efficiency gear sets.
•	 Use precision alignment.
•	 Check belt tension regularly.
•	 Eliminate variable-pitch pulleys.
•	 Use nylon sandwich type energy efficient flat belts as alternatives to old
   v-belts.
•	 Eliminate inefficient couplings.
•	 Shut them off when not needed adopting interlocks, controls.


                                       - 63 -
7. ENERGY EFFICIENCY IN PUMPS


                            7.1 PUMP CHOICES

Pumps come in a variety of sizes for a wide range of applications. They can
be classified, according to their basic operating principle, as dynamic or
displacement pumps. Dynamic pumps can be sub-classified as centrifugal and
special effect pumps. Displacement pumps can be sub-classified as rotary or
reciprocating pumps.
    In principle, any liquid can be handled by any of the pump designs. Where
different pump designs could be used, the centrifugal pump is generally the
most economical, followed by rotary and reciprocating pumps. Although
positive displacement pumps are generally more efficient than centrifugal
pumps, the benefit of higher efficiency tends to be offset by increased
maintenance costs.


                  7.2 CENTRIFUGAL PUMPS IN BRIEF

A centrifugal pump has a very simple design, as shown in Figure 7-1. The two
main parts of the pump are the impeller and the diffuser. The impeller, which
is the only moving part, is attached to a shaft and driven by a motor. Impellers
are generally made of bronze, polycarbonate, cast iron, or stainless steel, as
well as other materials. The diffuser (also called a volute) houses the impeller
and captures and directs the water off the impeller.


                    Figure 7-1 Design of centrifugal pump


                                    - 64 -
Energy Efficiency in Pumps


Water enters the center (eye) of the impeller and exits the impeller with the
help of centrifugal force. As water leaves the eye of the impeller a low-pressure
area is created, causing more water to flow into the eye. Atmospheric pressure
and centrifugal force cause this to happen. Velocity is developed as the water
flows through the impeller, which is spinning at high speed. The water velocity
is collected by the diffuser and converted to pressure by specially designed
passageways that direct the flow to the discharge of the pump, or to the next
impeller should the pump have a multi-stage configuration.
    The pressure (head) that a pump will develop is in direct relationship to the
impeller diameter, the number of impellers, the size of the impeller eye, and
the shaft speed. Capacity is determined by the exit width of the impeller. The
head and capacity are the main factors that affect the horsepower size of the
motor to be used. The greater the quantity of water to be pumped, the more
energy is required.


                     7.3 SYSTEM CHARACTERISTICS

In a pumping system, the objective, in most cases, is either to transfer a liquid
from a source to a required destination (e.g. filling a high-level reservoir) or
to circulate liquid around a system (e.g. as a means of heat transfer in heat
exchanger).
Head losses
Pressure is needed to make the liquid flow at the required rate, and this
pressure must overcome head “losses” in the system. Losses are of two types:
static head and friction head.
    Static head is simply the difference in height of the supply and destination
reservoirs, as shown on the left side in Figure 7-2. In this illustration, flow
velocity in the pipe is assumed to be very small. Another example of a system
with only static head is pumping into a pressurized vessel with short pipe runs.
Static head is independent of flow and graphically would be shown as on the
right side in Figure 7-2.


                            Figure 7-2 Static head


                                     - 65 -
Training Manual on Energy Efficiency for Small and Medium Enterprises


    Friction head (sometimes called dynamic head loss) is the loss due to
friction on the liquid being moved, in pipes, valves, and equipment in the
system. Friction tables are universally available for various pipe fittings and
valves. These tables show friction loss per 100 feet (or meters) of a specific
pipe size at various flow rates. In the case of fittings, friction is stated as an
equivalent length of pipe of the same size. The friction losses are proportional
to the square of the flow rate. A closed loop circulating system, without a
surface open to atmospheric pressure, would exhibit only friction losses and
would have a system friction head loss vs. flow curve as shown in Figure 7-3.


                             Figure 7-3 Friction head


    Most systems have a combination of static and friction head, and the
system curves for the two cases are shown in Figures 7-4 and 7-5. The ratio
of static to friction head over the operating range influences the benefits
achievable from variable speed drives.


                                      - 66 -
Energy Efficiency in Pumps


                    Figure 7-4 System with high static head


                    Figure 7-5 System with low static head


    Static head is a characteristic of the specific installation, and reducing this
head where it is possible generally reduces both the cost of the installation
and the cost of pumping the liquid. Friction head losses must be minimized
to reduce pumping cost, but after eliminating unnecessary pipe fittings and
length, further reduction in friction head will require a larger-diameter pipe,
which adds to installation cost.


                                      - 67 -
Training Manual on Energy Efficiency for Small and Medium Enterprises


Pump operating point
When a pump is installed in a system, the effect can be illustrated graphically
by superimposing pump and system curves. The operating point will always be
where the two curves intersect, as shown in Figure 7-6.


                        Figure 7-6 Pump operating point


    It is ideal if the operating duty point of a pump is close to the design
best efficiency point, which implies that careful attention is needed in sizing
the pump for an application, as oversizing would lead to reduced operational
efficiency.


                                      - 68 -
Energy Efficiency in Pumps


            7.4 TYPICAL PUMP CHARACTERISTIC CURVES


                       Figure 7-7 Pump operating curves


Pump operating curves as shown in Figure 7-7 relate to the head, flow, and
efficiency values that can be obtained with various impellor diameter choices.
The same analogy can also be applied for obtaining speed variation conditions.
    Pump efficiency is linked to specific speed of the pump, and the above
curves indicate constant efficiency attributes, also called iso-efficiency curves,
at different head flow combinations. Once the the specific speed (which
depends on head, flow, and RPM of a pump) is known, achievable pump
efficiency can be predicted from standard curves.


     7.5 FLOW CONTROL METHODS AND ENERGY EFFICIENCY

7.5.1 Flow control by valve control
With the valve control method, the pump runs continuously, and a valve in
the pump discharge line is opened or closed to adjust the flow to the required
value.


                                     - 69 -
Training Manual on Energy Efficiency for Small and Medium Enterprises


                        Figure 7-8 Valve control method


    As shown in Figure 7-8, with the valve fully open, the pump operates at ‘Flow
1.’ When the valve is partially closed it introduces an additional friction loss
in the system, which is proportional to flow squared. The new system curve
cuts the pump curve at ‘Flow 2,’ which is the new operating point. The head
difference between the two curves is the pressure drop across the valve.
    It is usual practice with valve control to have the valve 10% shut, even at
maximum flow. Energy is therefore wasted overcoming the resistance through
the valve at all flow conditions. There is some reduction in pump power
absorbed at the lower flow rate, but the flow multiplied by the head drop
across the valve is wasted energy.
    It should also be noted that, while the pump will accommodate changes
in its operating point as far as it is able within its performance range, it can
be forced to operate high on the curve, where its efficiency is low, and its
reliability is affected.
    Maintenance cost of control valves can be high, particularly with
corrosive and solids-containing liquids. Therefore, the lifetime cost could be
unnecessarily high.

7.5.2 Bypass control
With the bypass control approach, the pump runs continuously at the
maximum process demand level, with a permanent bypass line attached to
the outlet. When a lower flow is required, the surplus liquid is bypassed and
returned to the supply source.


                                      - 70 -
Energy Efficiency in Pumps


    An alternative configuration may have a tank supplying a varying process
demand, which is kept full by a fixed-duty pump running at the peak flow rate.
Most of the time the tank overflows and recycles back to the pump suction.
This is even less energy-efficient than a control valve because there is no
reduction in power consumption with a reduction in process demand.
    The small bypass line sometimes installed to prevent a pump running at
zero flow is not a means of flow control, but is required for the safe operation
of the pump.

7.5.3 Fixed flow reduction by impeller trimming
Impeller trimming refers to the process of machining the diameter of an
impeller to reduce the energy added to the system fluid, and it offers a useful
correction to pumps that, through overly conservative design practices or
changes in system loads, are oversized for their application.
    Trimming an impeller provides a lesser level of correction than buying a
smaller impeller from the pump manufacturer. In many cases, the next smaller
size impeller is too small for the pump load. Also, smaller impellers may not
be available for the pump size in question, and impeller trimming is the only
practical alternative short of replacing the entire pump/motor assembly.
    Impeller trimming reduces tip speed, which in turn directly lowers the
amount of energy imparted to the system fluid and lowers both the flow and
pressure generated by the pump (see Figure 7-9).


                 Figure 7-9 Impeller trimming to reduce flow


                                    - 71 -
Training Manual on Energy Efficiency for Small and Medium Enterprises


    The Affinity Laws, which describe centrifugal pump performance, provide
a theoretical relationship between impeller size and pump output (assuming
constant pump speed):
where
     Q = flow
     H = head
     BHP = brake horsepower of the pump motor
             Subscript 1 = original pump,
            Subscript 2 = pump after impeller trimming
     D = diameter

                       D2
             Q2    =        Q1
                       D1
                            2
                       D2
             H2    =            H1
                       D1
                            3
                       D2
             BHP2 =             BHP1
                       D1

    Trimming an impeller changes its operating efficiency, and the non-
linearities of the Affinity Laws with respect to impeller machining complicate
the prediction of pump performance. Consequently, impeller diameters are
rarely reduced below 70% of their original size.

7.5.4 Meeting variable flow needs by speed reduction
Pump speed adjustments provide the most efficient means of controlling pump
flow. When pump speed is reduced, less energy is imparted to the fluid and
less energy needs to be throttled or bypassed. There are two primary methods
of reducing pump speed: multiple-speed pump motors and variable speed
drives (VSDs).
    Although both directly control pump output, multiple-speed motors and
VSDs serve entirely separate applications. Multiple-speed motors contain a
different set of windings for each motor speed; consequently, they are more
expensive and less efficient than single-speed motors. Multiple-speed motors
also lack subtle speed-changing capabilities within discrete speeds.
    VSDs allow pump speed adjustments over a continuous range, avoiding
the need to jump from speed to speed as with multiple-speed pumps. VSDs
control pump speeds using several different types of mechanical and electrical
systems. Mechanical VSDs include hydraulic clutches, fluid couplings, and
adjustable belts and pulleys. Electrical VSDs include eddy current clutches,
wound-rotor motor controllers, and variable frequency drives (VFDs). VFDs
adjust the electrical frequency of the power supplied to a motor to change
the motor’s rotational speed. VFDs are by far the most popular type of VSD.


                                       - 72 -
Energy Efficiency in Pumps


   However, pump speed adjustment is not appropriate for all systems. In
applications with high static head, slowing a pump risks inducing vibrations
and creating performance problems that are similar to those found when a
pump operates against its shutoff head.
   For systems in which the static head represents a large portion of the total
head, caution should be used in deciding whether to use VFDs. Operators
should review the performance of VFDs in similar applications and consult VFD
manufacturers to avoid the damage that can result when a pump operates too
slowly against high static head.


                7.6 PUMP PERFORMANCE ASSESSMENT

The steps in assessing pump performance are as follows:
1.	 Select the pump or pumping station for which the audit/assessment is
    being carried out.
2.	 Collect specifications, design/performance guarantee test data, pump
    characteristic curves, and schematic diagrams of the pumping system.
3.	 Collect maintenance history and records of existing problems (if any) in the
    system.
4.	 Check the availability and functionality of various online and portable
    instruments to be used for observations during the trials.
5.	 Observations should be made by running the pumps in different
    combinations (if the pumps are connected in parallel).
6.	 Take an overall perspective of the pumping system comprising pumps,
    motors, coupling, suction/discharge valves, piping, flanges, pump seals/
    glands, etc., in order to check the general health of the pumping system:
    for example, note noticeable leakages of process fluid, thermal insulation
    deterioration if the fluid handled is hot or cold.
7.	 Carry out power measurements of pumps. In the absence of power
    analyzer/energy meter, use a tong tester and estimate power consumption
    from current, volts values.
8.	 Measure fluid flow (if available directly) or make arrangements to measure
    fluid flow by the tank filling method. Otherwise, estimate fluid flow by
    measuring suction pressure, discharge pressure, and power input, and use
    pump characteristic curves.
9.	 Perform calculations to draw conclusions based on the following parameters
    (formulae given in APO’s Energy Audit Manual):
   •	 Calculate combined efficiency of pump and motor.
   •	 Estimate of fluid flow (if flow is not measured directly).
   •	 Calculate specific power consumption (kWh/M3).
   •	 Compare above values with performance guarantee/design values. If
      there is large variation, look for areas for improvement.
   •	 Suggest measures for energy savings.


                                     - 73 -
Training Manual on Energy Efficiency for Small and Medium Enterprises


Table 7-1 Calculating pump energy efficiency

 1   Energy consumption (P) in kW                 =    3VI Cos Φ

     Combined efficiency of pump and                  M×9.81×TDH (mWC) ×100
     motor (%)                                    =            P

 2   Where
                                          P       =   power input (kW)
                                          m       =   fluid flow (m3/Sec)
                                          TDH     =   Total differential head (mWC)

     Pump efficiency                              =   Combined efficiency×100
 3
                                                        motor efficiency

     Fluid flow (m3/hr)                           =   (P) (ηp) (ηm) (3600)
                                                          (TDH) (9.81)
 4   Where
                                          ηp      =   pump efficiency
                                          ηm      =   motor efficiency

     Specific power consumption                   =   Power consumption (kWh)
 5
                                                          (m3/hr) fluid flow


10.	Towards further diagnostics, one may conduct a shut-off head trial
    (maximum one-minute duration) to ensure that the discharge valve is fully
    closed and not passing. If head corresponds to less than 90%–95% of
    name plate value, look for pump internal problems like:
     •	 Gland seal leaking,
     •	 Shaft misalignment,
     •	 Impeller pitting or wearing out,
     •	 Casing wearing out, or
     •	 Bearing wearing out.
11.	Based on existing pump efficiency, evaluate cost benefits for:
     •	 Pump replacement with higher efficiency pump or
     •	 Impeller replacement.
12.	Based on % margins available on flow, head, motor input kW, and process
    demand variation, evaluate cost benefits for application of:
     •	 Variable speed drives,
     •	 Impeller size optimization, or
    •	 Smaller multi pump application.
13.	Evaluate cost benefits of pipe size and pumping network optimization on
    both suction side and discharge side.
14.	Identify the scope for improving NPSH and suction-side improvements like
    high-efficiency foot valves, high-efficiency strainers, and seamless pipelines.


                                         - 74 -
Energy Efficiency in Pumps


  7.7 TIPS FOR ENERGY CONSERVATION IN PUMPING SYSTEMS


1.	 Ensure adequate NPSH at site of installation. Site NPSH should always be
     higher than required NPSH.
2.	 Ensure availability of basic instruments at pumps like pressure gauges and
     flow meters.
3.	 Operate pumps near their best efficiency point.
4.	 Restore internal clearances if performance has changed.
5.	 Shut down unnecessary pumps.
6.	 Modify pumping system and pump losses to minimize throttling.
7.	 Adapt to wide load variation with variable speed drives or sequenced
     control of multiple units.
8.	 Stop running multiple pumps; add an auto-start for an available spare or
     add a booster pump where needed.
9.	 Use booster pumps for small loads requiring higher pressures.
10.	 Increase fluid temperature differentials to reduce pumping rates in case of
     heat exchangers.
11.	 Repair seals and packing to minimize water loss by dripping.
12.	 Balance the system to minimize flows and reduce pump power
     requirements.
13.	 Avoid pumping head with a free-fall return (gravity); use siphon effect to
     advantage:
14.	 Optimize the number of stages in a multi-stage pump in case of head
     margins.
15.	 Reduce system resistance by pressure drop assessment and pipe size
     optimization.


                                    - 75 -
8. ENERGY EFFICIENCY IN FANS


                           8.1 INTRODUCTION

Fans and blower s pr ovide air for ventilation and industrial pr ocess
requirements. Fans generate a pressure to move air (or gases) against
resistance caused by ducts, dampers, or other components in a fan system.
The fan rotor receives energy from a rotating shaft and transmits it to the air
as pressure energy.


                      Figure 8-1 Basic diagram of a fan


Difference between fans, blowers, and compressors:
Fans, blowers, and compressors are differentiated by the method used to move
the air, and by the system pressure they must operate against. As per the
American Society of Mechanical Engineers (ASME), the specific ratio—the ratio
of the discharge pressure over the suction pressure—is used for fans, blowers,
and compressors. Accordingly, fans offer a pressure rise up to 1136 mmWg,
blowers offer from 1136 to 2066 mmWg, and compressors offer pressure rises
even higher than blowers.


                              8.2 FAN TYPES

Fans fall into two general categories: centrifugal flow and axial flow. In
centrifugal flow, airflow changes direction twice: once when entering the fan
and again when leaving (forward-curved, backward-curved or -inclined, and
radial types). In axial flow, air enters and leaves the fan with no change in
direction (propeller, tube axial, vane axial).


                                    - 76 -
Energy Efficiency in Fans


                          Figure 8-2 Types of fans


The major types of centrifugal fan by type of impellors adopted are radial
forward curved and backward curved:
Radial fans are industrial workhorses because of their high static pressures
(up to 1400mm WC) and ability to handle heavily contaminated airstreams.
Because of their simple design, radial fans are well suited for high
temperatures and medium blade tip speeds.
Forward-curved fans are used in clean environments and operate at lower
temperatures. They are well suited for low tip speed and high-airflow work:
they are best suited for moving large volumes of air against relatively low
pressures.
Backward-inclined fans are more efficient than forward-curved fans.
Backward-inclined fans reach their peak power consumption and then power
demand drops off well within their usable airflow range. Backward-inclined
fans are known as “non-overloading” because changes in static pressure do
not overload the motor.


                                   - 77 -
Training Manual on Energy Efficiency for Small and Medium Enterprises


                         Figure 8-3 Types of fan blades


The major types of axial flow fans are tube axial, vane axial, and propeller:
Tube axial fans have a wheel inside a cylindrical housing, with close
clearance between blade and housing to improve airflow efficiency. The wheels
turn faster than propeller fans, enabling operation under high pressures of
250–400mm WC. The efficiency is up to 65%.
Vane axial fans are similar to tube axial fans, but with the addition of guide
vanes that improve efficiency by directing and straightening the flow. As a
result, they have a higher static pressure with less dependence on the duct
static pressure. Such fans are used generally for pressures up to 500mm WC.
Vane axial are typically the most energy-efficient fans available and should be
used whenever possible.
Propeller fans usually run at low speeds and moderate temperatures. They
experience a large change in airflow with small changes in static pressure.
They handle large volumes of air at low pressure or free delivery. Propeller
fans are often used indoors as exhaust fans. Outdoor applications include air-
cooled condensers and cooling towers.
Application choices for fans are summarized in Table 8-1.


Table 8-1 Types of fans, characteristics, and typical applications

                                Centrifugal Fans

        Type               Characteristics              Typical Applications

  Radial                High pressure, medium         Various industrial
                        flow; efficiency close        applications; suitable for
                        to that of tube-axial         dust-laden, moist air/
                        fans; power increases         gases
                        continuously

                                                        (Continued on next page)


                                      - 78 -
Energy Efficiency in Fans


( ... Continued)

  Forward-curved      Medium pressure, high        Low-pressure HVAC,
  blades              flow, dip in pressure        packaged units, suitable for
                      curve; efficiency higher     clean and dust-laden air/
                      than radial fans; power      gases
                      rises continuously

  Backward-curved     High pressure, high flow,    HVAC, various industrial
  blades              high efficiency; power       applications, forced draft
                      reduces as flow increases    fans, etc.
                      beyond point of highest
                      efficiency

  Airfoil type        Same as backward-            Same as backward-curved
                      curved type; highest         type, but for clean air
                      efficiency                   applications


                               Axial-flow Fans

       Type              Characteristics           Typical Applications

  Propeller           Low pressure, high           Air circulation, ventilation,
                      flow, low efficiency;        exhaust
                      peak efficiency close to
                      point of free air delivery
                      (zero static pressure)

  Tube-axial          Medium pressure, high        HVAC, drying ovens,
                      flow, higher efficiency      exhaust systems
                      than propeller type, dip
                      in pressure-flow curve
                      before peak pressure
                      point.

  Vane-axial          High pressure, medium        High-pressure applications
                      flow, dip in pressure-       including HVAC systems,
                      flow curve; use of           exhausts
                      guide vanes improves
                      efficiency


                       8.3 SYSTEM RESISTANCE

The term “system resistance” is used when referring to the static pressure.
The system resistance is the sum of static pressure losses in the system.
System resistance is a function of the configuration of ducts, pickups, and
elbows, and the pressure drops across equipment—for example, a bag filter
or cyclone. The system resistance varies with the square of the volume of air
flowing through the system. For a given volume of air, the fan in a system
with narrow ducts and multiple short radius elbows is going to have to work


                                     - 79 -
Training Manual on Energy Efficiency for Small and Medium Enterprises


harder to overcome a greater system resistance than it would in a system with
larger ducts and a minimum number of long radius turns. Long narrow ducts
with many bends and twists will require more energy to pull the air through
them. Consequently, for a given fan speed, the fan will be able to pull less air
through this system than through a short system with no elbows. Thus, the
system resistance increases substantially as the volume of air flowing through
the system increases. Conversely, resistance decreases as flow decreases. To
determine what volume the fan will produce, it is therefore necessary to know
the system resistance characteristics.
    In existing systems, the system resistance can be measured. In systems
that have been designed, but not built, the system resistance must be
calculated. Typically a system resistance curve is generated for various flow
rates on the x-axis and the associated resistance on the y-axis.


                          Figure 8-4 System resistance


                 8.4 FAN PERFORMANCE ASSESSMENT

Fans are tested for field performance by measurement of air flow, head
(pressure developed, also sometimes called draft), and temperature on the fan
side and electrical motor kW input on the motor side.

8.4.1 Air flow measurement
Static pressure:
Static pressure is the potential energy put into the system by the fan. It is
given up to friction in the ducts, and at the duct inlet as it is converted to
velocity pressure. At the inlet to the duct, the static pressure produces an area
of low pressure
Velocity pressure:
Velocity pressure is the pressure along the line of the flow that results from
the air flowing through the duct. The velocity pressure is used to calculate air
velocity.


                                      - 80 -
Energy Efficiency in Fans


Total pressure:
Total pressure is the sum of the static and velocity pressure. Velocity pressure
and static pressure can change as the air flows though different size ducts
while accelerating, but the total pressure stays constant, changing only with
friction losses.
     The fan flow is measured using Pitot tube manometer combination or a flow
sensor (differential pressure instrument) or an accurate anemometer. Care
must be taken regarding number of traverse points in a straight length section
(to avoid turbulent flow regimes of measurement) upstream and downstream
of measurement location. The measurements can be on the suction or
discharge side of the fan, and preferably both where feasible.
Measurement by Pitot tube:
Total pressure is measured using the inner tube of the Pitot tube, and static
pressure is measured using the outer tube of the Pitot tube, as indicated
in Figure 8-5. When the inner and outer tube ends are connected to a
manometer, we get the velocity pressure. For measuring low velocities, it is
preferable to use an inclined tube manometer instead of a U tube manometer.


                     Figure 8-5 Pitot tube measurement


8.4.2 Velocity pressure/velocity calculation
When measuring velocity pressure, the duct diameter (or the circumference
from which to calculate the diameter) should be measured as well. This will
allow us to calculate the velocity and the volume of air in the duct. In most
cases, pressure (head) must be measured at several places in the same
system. A typical format is presented in Table 8-2.


                                    - 81 -
Training Manual on Energy Efficiency for Small and Medium Enterprises


Table 8-2 Measurements of air flow
       Duct
                                                                                           Static Pressure
       Cross-                                                            Temp. of Air at
Duct               Dynamic Head (dp) at 10 Points along     Pitot-tube                     in Duct at
       sectional                                                         Measurement
Ref.               Duct Diameter/Length or Width            Constant                       Measurement
       Area                                                              Point (ºC)
                                                                                           Point (mmWC)
       (M2)

                   1   2   3   4   5   6   7   8   9   10


•	 The velocity pressure varies across the duct. Friction slows the air near the
   duct walls, so the velocity is greater in the center of the duct. The velocity
   is affected by changes in the ducting configuration such as bends and
   curves. The best place to take measurements is in a section of duct that is
   straight for at least 3–5 diameters after any elbows, branch entries, or duct
   size changes.
•	 To determine the average velocity, it is necessary to take a number of
   velocity pressure readings across the cross-section of the duct. The velocity
   should be calculated for each velocity pressure reading, and the average
   of the velocities should be used. Do not average the velocity pressure;
   average the velocities.

•	 For best results, one set of readings should be taken in one direction and
   another set at a 90º angle to the first. For square ducts, the readings can
   be taken in 16 equally spaced areas. If it is impossible to traverse the
   duct, an approximate average velocity can be calculated by measuring the
   velocity pressure in the center of the duct and calculating the velocity. This
   value is reduced to an approximate average by multiplying by 0.9.


                                                   - 82 -
Energy Efficiency in Fans


8.4.3 Air density calculation
The first calculation is to determine the density of the air. To calculate the
velocity and volume from the velocity pressure measurements it is necessary
to know the density of the air. The density is dependent on altitude and
temperature:
                          273x1.293
     Gas Density(γ)=
                           273+tºC
       where tºC – temperature of gas/air at site condition.

8.4.4 Velocity calculation
Once the air density and velocity pressure have been established, the velocity
can be determined from the equation:

                          Cp x   2×9.81×Δp×γ
       Velocity v, m/s=
                                   γ

       where Cp = Pitot tube constant, 0.85 (or) as given by the manufacturer;

       	      p = Average differential pressure measured by Pitot tube by taking
       	          measurement at number of points over the entire cross
       	          section of the duct;

       	     γ = Density of air or gas at test condition.

8.4.5 Volume calculation
The volume in a duct can be calculated for the velocity using the equation:

   Volumetric flow(Q),m3/sec = Velocity(m/sec)xArea(m2)

8.4.6 Fan efficiency
Fan manufacturers generally use two ways to mention fan efficiency:
mechanical efficiency (sometimes called total efficiency) and static efficiency.
Both measure how well the fan converts horsepower into flow and pressure.

The equation for determining mechanical efficiency is:

   Fan Mechanical Efficiency(ηmechanical),%

       Valumein m3/sec*Δp(total pressure) in mmWC
   =                                                   x100
             102*power input to fan shaft in kW

The static efficiency equation is the same except that the outlet velocity
pressure is not added to the fan static pressure:

   Fan Static Efficiency(ηStatic),%

       Valumein m3/sec*Δp(static pressure) in mmWC
   =                                                     x100
             102*power input to fan shaft in kW


                                       - 83 -
Training Manual on Energy Efficiency for Small and Medium Enterprises


Drive motor kW can be measured by a load analyzer. This kW multiplied by
motor efficiency gives the shaft power to the fan.
For analysis, the reported parameters are:
•	 Actual flow and % loading w.r.t rated flow;
•	 Actual head and % loading w.r.t rated head;
•	 Actual motor kW and % loading w.r.t rated input;
•	 As run efficiency w.r.t. rated efficiency of fan;
•	 Damper settings on suction or discharge side observed.


                8.5 ENERGY SAVINGS OPPORTUNITIES


The energy efficiency strategy in fan systems includes establishing a system
curve accurately, selecting the correct operating point of the fan and matching
it with the best efficiency point, selecting the fan with highest efficiency for the
application, achieving energy-efficient capacity controls, and adopting good
O &M practices.


8.5.1 Flow control strategies and energy conservation
Typically, once a fan system is designed and installed, the fan operates
at a constant speed. There may be occasions when a speed change is
desirable, e.g., when adding a new run of duct that requires an increase
in air flow (volume) through the fan. There are also instances when the
fan is oversized and flow reductions are required. Various ways to achieve
change in flow are: pulley change, damper control, inlet guide vane
control, variable speed drives, and series and parallel operation of fans.
Damper controls:
Some fans are designed with damper controls. Dampers can be located at
inlet or outlet. Dampers provide a means of changing air volume by adding or
removing system resistance. This resistance forces the fan to move up or down
along its characteristic curve, generating more or less air without changing fan
speed. However, dampers provide a limited amount of adjustment, and they
are not energy-efficient.
Pulley change:
When a fan volume change is required on a permanent basis, and the existing
fan can handle the change in capacity, the volume change can be achieved
with a speed change. The simplest and cheapest one-time way to change the
speed is with a pulley change. For this, the fan must be driven by a motor
through a V-belt system. The fan speed can be increased or decreased with a
change in the drive pulley or the driven pulley or, in some cases, both pulleys.
This method is normally applicable for de-rating, where a fan is oversized and
damper operation (which is inefficient) is observed at all times.


                                      - 84 -
Energy Efficiency in Fans


Inlet guide vanes:
Inlet guide vanes are another mechanism that can be used to meet variable
air demand. Guide vanes are curved sections that lie against the inlet of the
fan when they are open. When they are closed, they extend out into the
air stream. As they are closed, guide vanes pre-swirl the air entering the
fan housing. This changes the angle at which the air is presented to the fan
blades, which in turn changes the characteristics of the fan curve. Guide vanes
are energy-efficient for modest flow reduction from 100% flow to about 80%.
Below 80% flow, energy efficiency drops sharply.
    Axial-flow fans can be equipped with variable pitch blades, which can be
hydraulically or pneumatically controlled to change blade pitch while the fan is
at stationary. Variable-pitch blades modify the fan characteristics substantially
and thereby provide dramatically higher energy efficiency than the other
options.
Variable speed drives:
Although variable speed drives are expensive, they provide almost infinite
variability in speed control. Variable speed operation involves reducing the
speed of the fan to meet reduced flow requirements. Fan performance can be
predicted at different speeds using the fan laws. Since power input to the fan
changes as the cube of the flow, this will usually be the most efficient form
of capacity control. However, variable speed control may not be economical
for systems which have infrequent flow variations. When considering variable
speed drive, the efficiency of the control system (fluid coupling, eddy-current,
VFD, etc.) should be accounted for in the analysis of power consumption.
    Energy efficiency is achieved through right selection of flow control
methods. Comparison of various volume control methods with respect to
consumption (%) of required power is shown in Figure 8-6.


          Figure 8-6 Power consumption of volume control methods


                                     - 85 -
Training Manual on Energy Efficiency for Small and Medium Enterprises


    All the methods of capacity control presented above have turn-down
ratios (ratio of maximum to minimum flow rate) determined by the amount of
leakage (slip) through the control elements. For example, even with dampers
fully closed, the flow may not be zero due to leakage through the damper. In
the case of variable-speed drives the turn-down ratio is limited by the control
system. In many cases, the minimum possible flow will be determined by
the characteristics of the fan itself. Stable operation of a fan requires that it
operate in a region where the system curve has a positive slope and the fan
curve has a negative slope.
    The range of operation and the time duration at each operating point
also serves as a guide to selection of the most suitable capacity control
system. Outlet damper control, with its simplicity, ease of operation, and low
investment cost, is the most prevalent form of capacity control. However, it
is the most inefficient of all methods and is best suited for situations where
only small, infrequent changes are required (for example, minor process
variations due to seasonal changes). The economic advantage of one method
over another is determined by the time duration over which the fan operates
at different operating points. The frequency of flow change is another
important determinant. For systems requiring frequent flow control, damper
adjustment may not be convenient. Indeed, in many plants, dampers are not
easily accessible and are left at some intermediate position, to avoid frequent
control.

   The energy savings potential in fans and fan systems is maximized by
reducing the loading on flow and head, eliminating inefficient capacity controls,
and adopting need-based replacements for efficiency margins. These are
summarized as type A, B, and C categories, as follows:
1.	     Minimizing excess air level in combustion systems to reduce forced draft
        fan and induced draft fan power consumption. (A)
2.	     Minimizing air in-leaks in hot flue gas path to reduce ID fan load,
        especially in kilns, boiler plants, furnaces, etc. Cold air in-leaks increase
        ID fan load tremendously, due to density increase of flue gases and in-
        fact choke up the capacity of fan, resulting in a bottleneck for the boiler/
        furnace itself. (A)
3.	     In-leaks/out-leaks in air conditioning systems also have a major
        impact on energy efficiency and fan power consumption and need to be
        minimized. (A)
4.	     The findings of fan performance assessment trials will indicate potential
        areas for improvement, which could be one or more of the following:
4.1.	   Replacement of impeller by a high-efficiency impeller along with a cone. (C)
4.2.	   Replacement of fan assembly as a whole by a higher-efficiency fan. (C)
4.3.	   Downsizing as needed by impeller de-rating (replacement with a smaller-
        diameter impeller). (B)
4.4	    Replacement of a metallic/glass-reinforced plastic (GRP) impeller by the
        more energy-efficient hollow FRP impeller with aerofoil design, in case of
        axial flow fans, where significant savings have been reported. (C)


                                        - 86 -
Energy Efficiency in Fans


4.5.	 Fan speed reduction by pulley diameter modification for one-time de-
      rating. (C)
4.6. Option of two-speed motors or variable speed drives for variable duty
      conditions. (B)
4.7.	 Option of energy-efficient flat belts, or cogged raw edged V belts, in
      place of conventional V-belt systems, for reducing transmission losses. (C)
4.8.	 Adopting inlet guide vanes in place of discharge damper controls. (B)
4.9.	 Minimizing system resistance and pressure drops by improvements in
      duct system like larger ducts for lowering pressure drop, etc. (A)
4.10.	Use of smooth, well-rounded air inlet cones for fan air intakes. (A)
4.11.	Minimizing fan inlet and outlet obstructions. (A)


                                     - 87 -
9. ENERGY EFFICIENCY IN COMPRESSED AIR SYSTEMS


                           9.1 INTRODUCTION

Air compressors account for significant amounts of the electricity used in
industries. Air compressors are used in a variety of industries to supply
process requirements, to operate pneumatic tools and equipment, and to meet
instrumentation needs. Only 10%–30% of energy reaches the point of end-
use; the remaining 70%–90% of energy of the power of the prime mover is
converted to unusable heat energy and to a lesser extent is lost in the form of
friction, misuse, and noise.


                Figure 9-1 Losses in air compressor systems


                        9.2 COMPRESSOR TYPES

Compressors are broadly classified as positive displacement compressors and
dynamic compressors.
Positive displacement compressors increase the pressure of the gas by
reducing the volume. Positive displacement compressors are further sub-
classified as reciprocating or rotary compressors.
Dynamic compressors increase the air velocity, which is then converted to
increased pressure at the outlet. Dynamic compressors are basically centrifugal
compressors and are further classified as radial and axial flow types.
   The choice among types of compressors available is shown in Figure 9-2.
They are distinctive by method of operation and have well-established niche
areas of selection/application in industry.


                                    - 88 -
Energy Efficiency in Compressed Air Systems


                  Figure 9-2 Types of compressors available


A simple selection help tool is shown in Figure 9-3. (Cfm stands for cubic feet
output per minute, a well-accepted term in compressor systems.)


                   Figure 9-3 Compressor selection ratios


                                    - 89 -
Training Manual on Energy Efficiency for Small and Medium Enterprises


              9.3 COMPRESSED AIR SYSTEM COMPONENTS

Compressed air systems consist of the following major components: intake
air filters, inter-stage coolers, after-coolers, air dryers, moisture drain traps,
receivers, piping network, filters, regulators, and lubricators.
Intake air filters prevent dust from entering the compressor. Dust causes
sticking valves, scoured cylinders, excessive wear, etc.
Inter-stage coolers reduce the temperature of the air before it enters the
next stage to reduce the work of compression and increase efficiency. They are
normally water-cooled.
After-coolers work to remove the moisture in the air by reducing the
temperature in a water-cooled heat exchanger.
Air dryers:
The traces of moisture remaining after the application of after-coolers are
removed using air dryers, as air for instruments and pneumatic equipment
has to be free of any moisture. The moisture is removed using adsorbents
like silica gel/activated carbon, refrigerant dryers, or heat from compression
dryers.


Table 9-1 Adsorbents used to dry air

                                                                  Power
               Type                   Dew Point (ºC)           Consumption
                                                             (kW/1000 m3/hr)

  Desiccant Regeneratives
                                               –40                      20.7
  (Air purging)

  Desiccant Regeneratives
                                               –40                      18
  (Blowing)

  Desiccant Regeneratives
                                               –40                      12
  (Heat of compression)

  Refrigerants
                                               –20                      2.9
  (Drying)


Moisture drain traps:
Moisture drain traps are used for removal of moisture in the compressed air.
These traps resemble steam traps. The types of traps used include manual
drain cocks, timer-based automatic drain valves, etc.
Receivers:
Air receivers are provided for storage and smoothening of pulsating air output,
reducing variations in pressure of air from the compressor.


                                      - 90 -
Energy Efficiency in Compressed Air Systems


                    9.4 COMPRESSOR PERFORMANCE

9.4.1 Capacity of a compressor
Capacity of a compressor is the full rated volume of flow of gas compressed
and delivered at conditions of total temperature, total pressure, and
composition prevailing at the compressor inlet. It sometimes means actual
flow rate, rather than rated volume of flow. This is also termed Free Air
Delivery (FAD)—i.e., air at atmospheric conditions at any specific location.
Because the altitude, barometer, and temperature may vary at different
localities and at different times, it follows that this term does not mean air
under identical or standard conditions.

9.4.2 Compressor efficiency definitions
Adiabatic and isothermal efficiencies are computed as the isothermal or
adiabatic power divided by the actual power consumption. The figure obtained
indicates the overall efficiency of compressor and drive motor. Isothermal
compression is close to ideal, and with inter and after coolers, the work of
compression is optimized with resulting power economy.
Isothermal efficiency

                                    Isothermal power
     Isothermal Efficiency=
                              Actual measured input power

     Isothermal power (kW) = P1 x Q1 x loger/36.7

where
     P1 = Absolute intake pressure kg/ cm2

     Q1 = Free air delivered m3/hr.

     r   = Pressure ratio P2/P1

    The calculation of isothermal power does not include the power needed to
overcome friction and generally gives an efficiency that is lower than adiabatic
efficiency. The reported value of efficiency is normally the isothermal efficiency.
This is an important consideration when selecting compressors based on
reported values of efficiency.
    As an easy reference, indicative specific power consumption values for
various compressor types are presented in Figure 9-4.


                                      - 91 -
Training Manual on Energy Efficiency for Small and Medium Enterprises


            Figure 9-4 Power consumption values for compressors


   9.5 SHOP FLOOR METHODS FOR ASSESSMENT AND FACTORS
               AFFECTING ENERGY EFFICIENCY

9.5.1 Compressor capacity assessment
Due to aging of the compressors and inherent inefficiencies in the internal
components, the free air delivered may be less than the design value,
despite good maintenance practices. Sometimes other factors such as poor
maintenance, fouled heat exchangers, and effects of altitude also tend to
reduce free air delivery. In order to meet the air demand, an inefficient
compressor may have to run for a longer time, thus consuming more power
than is actually required.
    The power wastage depends on the deviation of FAD capacity. For example,
a worn-out compressor valve can reduce the compressor capacity by as much
as 20%. A periodic assessment of the FAD capacity of each compressor has
to be carried out to check its actual capacity. If the deviations are more than
10%, corrective measures should be taken to rectify the situation.
    The ideal method of compressor capacity assessment is through a nozzle
test wherein a calibrated nozzle is used as a load, to vent out the generated
compressed air. Flow is assessed based on the air temperature, stabilization
pressure, and orifice constant.

9.5.2 Simple method of capacity assessment on the shop floor
1.	 Isolate the compressor along with the individual receiver being tested from
    the main compressed air system by tightly closing the isolation valve or
    blanking it, thus closing the receiver outlet.
2.	 Open the water drain valve, drain the water fully, and empty the receiver
    and the pipeline. Make sure that water trap line is tightly closed once again
    to start the test.
3.	 Start the compressor and activate the stopwatch.
4.	 Note the time taken to attain the normal operational pressure P2 (in the
    receiver) from initial pressure P1. The capacity is calculated as per the
    formula given below:


                                      - 92 -
Energy Efficiency in Compressed Air Systems


   Actual free air discharge

          P2-P1       V
     Q=           ×       Nm3/Minute
           P0         T

   where

     P2 = Final pressure after filling (kg/cm2 a)
     P1 = Initial pressure (kg/cm2a) after bleeding

     P0 = Atmospheric pressure (kg/cm2 a)

     V = Storage volume in m3 which includes receiver, after-cooler, and
         delivery piping
     T = Time taken to build up pressure to P2 in minutes
The above equation is relevant where the compressed air temperature is the
same as the ambient air temperature, i.e., perfect isothermal compression. In
case the actual compressed air temperature at discharge, t2ºC is, higher than
ambient air temperature t1ºC (as is usual), the FAD is to be corrected by a
factor (273 + t1) / (273 + t2).

9.5.3 Simple method of leak quantification on the shop floor
1.	 Shut off compressed air operated equipment (or conduct the test when no
    equipment is using compressed air).
2.	 Run the compressor to charge the system to set pressure of operation.
3.	 Note the subsequent time taken for “load” and “unload” cycles of
    the compressors. For accuracy, take ON & OFF times for 8–10 cycles
    continuously. Then calculate total “ON” Time (T) and total “OFF” time (t).
The system leakage is calculated as:

     % leakage = T × 100 / (T + t)
     (or) System leakage (m3/minute) = Q × T / (T + t)
   where

     Q = Actual free air being supplied during trial, in cubic meters per minute (cmm)

     T = Time on load in minutes

     t = Time on unload in minutes


                                       - 93 -
Training Manual on Energy Efficiency for Small and Medium Enterprises


9.5.4 Importance of maintenance for power consumption


Table 9-2 Maintenance factors affecting power consumption

  S.                                                        Excess Power
                   Maintenance Factor
  No.                                                     Consumption (%)

   1        Worn-out pistons and gland packing                    3–5%

   2                  Worn-out valves                             5–6%

   3                Misaligned bearings                           1–3%

   4                   Wrong grade oil                             1%

   5                    Choked filter                             3-5%

   6          High cooling water temperature                       1%

   7                     Loose Belts                              4-6%


9.6 ENERGY EFFICIENCY OPPORTUNITIES IN COMPRESSED AIR SYSTEMS


•	 Ensure that air intake to compressor is not warm and humid by locating
   compressors in a well-ventilated area or by drawing cold air from outside.
   Every 4ºC rise in air inlet temperature will increase power consumption by
   1%.
•	 Clean air-inlet filters regularly. Compressor efficiency will be reduced
   by 2% for every 250mm WC pressure drop increase across the filter. (A
   compressor is a breathing machine.)
•	 Keep compressor valves in good condition by removing and inspecting
   them once every six months. Worn-out valves can reduce compressor
   efficiency by as much as 50%.
•	 Install manometers across the filter and monitor the pressure drop as a
   guide to scheduled maintenance and replacement of elements.
•	 Minimize low-load compressor operation; if air demand is less than 50%
   of compressor capacity, consider changing to a smaller compressor or
   reducing compressor speed appropriately (by reducing motor pulley size),
   in case of belt-driven compressors.
•	 Consider the use of regenerative air dryers, which use the heat of
   compressed air to remove moisture.
•	 Fouled inter-coolers reduce compressor efficiency and cause more water
   condensation in air receivers and distribution lines, resulting in increased
   corrosion. Periodic cleaning of inter-coolers must be ensured.


                                        - 94 -
Energy Efficiency in Compressed Air Systems


•	 Compressor free air delivery test (FAD) must be done periodically to check
   the present operating capacity against its design capacity, and corrective
   steps must be taken if required.
•	 If more than one compressor is feeding to a common header, compressors
   must be operated in such a way that only one small compressor handles
   the load variations, while other compressors operate at full load.
•	 The possibility of heat recovery from hot compressed air to generate hot air
   or water for process application must be economically analyzed, in cases of
   large compressors.
•	 Consideration should be given to buying a two-stage or multi-stage
   compressor as it consumes less power for the same air output than a
   single-stage compressor.
•	 If pressure requirements for processes are widely different (e.g. 3 bar to 7 bar),
   it is advisable to have two separate compressed air systems.
•	 Reduce compressor delivery pressure, wherever possible, to save energy.
•	 Provide extra air receivers at points of high cyclic-air demand, which
   permits operation without extra compressor capacity.
•	 Retrofit with variable speed drives in big compressors (say over 100 kW) to
   eliminate the ‘unloaded’ running condition altogether.
•	 Maintain the minimum possible range between load and unload pressure
   settings.
•	 Automatic timer-controlled drain traps waste compressed air every time the
   valve opens. So frequency of drainage should be optimized.
•	 Trans-vector nozzles are to be used for low and intermediate pressure air
   requirements at user points. These nozzles draw a small quantity of motive
   air at higher pressure and mix it with ambient air, to produce compressed
   air at intermediate pressure, in an efficient manner, as against routine
   valve control method.
•	 Check air compressor logs regularly for abnormal readings, especially motor
   current cooling water flow and temperature, inter-stage and discharge
   pressures, and temperatures and compressor load-cycles.
•	 Compressed air leakage of 40%–50% is not uncommon. Carry out periodic
   leak tests to estimate the quantity of leakage.
•	 Install equipment interlocked solenoid cut-off valves in the air system so that air
   supply to a machine can be switched off when it is not in use.
•	 Present energy prices justify liberal designs of pipeline sizes to reduce
   pressure drops.
•	 Compressed air piping layout should be made preferably as a ring main to
   provide desired pressures for all users.
•	 A smaller dedicated compressor can be installed at load point, located far
   away from the central compressor house, instead of supplying air through
   lengthy pipelines.


                                       - 95 -
Training Manual on Energy Efficiency for Small and Medium Enterprises


•	 All pneumatic equipment should be properly lubricated, which will reduce
   friction and prevent wear of seals and other rubber parts, thus preventing
   energy wastage due to excessive air consumption or leakage.
•	 Misuse of compressed air, such as for body cleaning, agitation, general
   floor cleaning, and other similar applications, must be discouraged in order
   to save compressed air and energy.
•	 Pneumatic equipment should not be operated above the recommended
   operating pressure as this not only wastes energy but can also lead to
   excessive wear of equipment components which leads to further energy
   wastage.
•	 Pneumatic transport can be replaced by a mechanical system as the former
   consumes about 8 times more energy than the latter.
•	 Pneumatic tools such as drill and grinders consume about 20 times more
   energy than motor-driven tools. Hence, they have to be used efficiently.
   Wherever possible, they should be replaced with electrically operated tools.

•	 Where possible, welding is a good practice and should be preferred over
   threaded connections.
•	 On account of high pressure drop, ball or plug or gate valves are preferable
   to globe valves in compressed air lines.


    9.7 GENERIC TIPS FOR EFFICIENT USE OF COMPRESSORS

•	 Install a control system to coordinate multiple air compressors.
•	 Study part–load characteristics and cycling costs to determine the most
   efficient mode for operating multiple air compressors.
•	 Avoid over-sizing: match the connected load.
•	 Avoid partial loading on modulation-controlled air compressors. (They use
   almost as much power at partial load as at full load.)
•	 Turn off the back-up air compressor until it is needed.
•	 Reduce air compressor discharge pressure to the lowest acceptable setting.
   (Reduction of 1 kg/cm2 air pressure (8 kg/cm2 to 7 kg/cm2) would result in
   9% input power savings. This will also reduce compressed air leakage rates
   by 10%.)
•	 Use the highest reasonable dryer dew point settings.
•	 Turn off refrigerated and heated air dryers when the air compressors are
   off.
•	 Use a control system to minimize heatless desiccant dryer purging.
•	 Minimize purges, leaks, excessive pressure drops, and condensation
   accumulation.


                                      - 96 -
Energy Efficiency in Compressed Air Systems


   (Compressed air leak from 1mm hole size at 7 kg/cm2 pressure would
   mean power loss equivalent to 0.5 kW.)
•	 Use drain controls instead of continuous air bleeds through the drains.
•	 Consider engine-driven or steam-driven air compression to reduce electrical
   demand charges.
•	 Replace standard V-belts with high-efficiency flat belts as the old V-belts
   wear out.
•	 Take air compressor intake air from the coolest (but not air-conditioned)
   location.
   (Every 5ºC reduction in intake air temperature will result in a 1% reduction
   in compressor power consumption.)
•	 Use an air-cooled after-cooler to heat building makeup air in winter.
•	 Be sure that heat exchangers are not fouled (e.g. with oil).
•	 Be sure that air/oil separators are not fouled.
•	 Monitor pressure drops across suction and discharge filters, and clean or
   replace filters promptly upon increase in pressure drop.
•	 Use a properly sized compressed air storage receiver. Minimize disposal
   costs by using lubricant that is fully demulsible and an effective oil–water
   separator.
•	 Consider alternatives to compressed air such as blowers for cooling,
   hydraulic rather than air cylinders, electric rather than air actuators, and
   electronic rather than pneumatic controls.
•	 Use nozzles or Venturi-type devices rather than blowing with open
   compressed air lines.
•	 Check for leaking drain valves on compressed air filter/regulator sets.
   Certain rubber-type valves may leak continuously after they age and crack.
   Replacement is the best choice.
•	 In dusty environments, control packaging lines with high-intensity photocell
   units instead of standard units with continuous air purging of lenses and
   reflectors.
•	 Establish a compressed air efficiency-maintenance program. Start with
   an energy audit and follow-up, then make a compressed air efficiency-
   maintenance program a part of your continuous energy management
   program.


                                    - 97 -
10. ENERGY EFFICIENCY IN REFRIGERATION
    SYSTEMS


                           10.1 INTRODUCTION

Refrigeration deals with the pumping out of heat, from a low-temperature heat
source to a high-temperature heat sink, by using a low boiling temperature
refrigerant. The cooling effect produced is quantified in tons of refrigeration.

     1 ton of refrigeration = 3024 kCal/hr heat rejected (pumped out)


                    10.2 TYPES OF APPLICATIONS

Depending on applications, there are several options/combinations available
for use, as listed below:
•	 Air conditioning (for human comfort/machines) using
    Split air conditioners
   Fan coil units in a larger system
   Air handling units in a larger system
•	 Small capacity modular units of direct expansion type similar to domestic
   refrigerators, small capacity refrigeration units.
•	 Centralized chilled water plants, with chilled water as a secondary coolant
   for temperature range over 5ºC typically. They can also be used for ice
   bank formation.
•	 Brine plants, which use brines as low-temperature secondary coolant, for
   typically sub-zero temperature applications, which come as modular unit
   capacities as well as large centralized plant capacities.
•	 The plant capacities up to 50 TR are usually considered as small capacity,
   50–250 TR as medium capacity and over 250 TR as large capacity units.
•	 A large industry may have a bank of such units, often with common chilled
   water pumps, condenser water pumps, cooling towers, as an off-site utility.
•	 A large industry may also have two or three levels of refrigeration & air
   conditioning such as:
     Comfort air conditioning (20º–25ºC)
     Chilled water system (8º–10ºC)
     Brine system (sub-zero applications)


                                    - 98 -
Energy Efficiency in Refrigeration Systems


               10.3 TYPES OF REFRIGERATION PLANTS

10.3.1 Vapor compression type
Heat flows naturally from a hot to a colder body. In a refrigeration system,
the opposite must occur: i.e., heat flows from a cold to a hotter body. This
is achieved by using a refrigerant, which absorbs heat and hence boils or
evaporates at a low pressure to form a gas. This gas is then compressed to
a higher pressure, such that it transfers the heat it has gained to ambient
air or water and turns it back (condenses it) into a liquid. In this way heat is
absorbed, or removed, from a low temperature source and transferred to a
higher temperature source.


                 Figure 10-1 Vapor compression refrigeration


10.3.2 Vapor absorption type
The absorption chiller is a machine which produces chilled water by using
heat such as steam, hot water, gas, oil, etc. Chilled water is produced by
the principle that liquid (refrigerant), which evaporates at low temperature,
absorbs heat from its surroundings when it evaporates. Pure water is used as
refrigerant and lithium bromide solution is used as absorbent.
    Heat for the vapor absorption refrigeration system can be provided by
waste heat extracted from process, diesel generator sets, etc. Absorption
systems require electricity only to run the pumps. Depending on the
temperature required and the power cost, it may even be economical to
generate heat or steam to operate the absorption system.


                                    - 99 -
Training Manual on Energy Efficiency for Small and Medium Enterprises


                   Figure 10-2 Vapor absorption refrigeration


                    10.4 PERFORMANCE ASSESSMENT

Specific power consumption, kW/TR, is a useful indicator of the performance
of a refrigeration system. By measuring refrigeration duty performed in TR and
the kW input, kW/TR is brought out as a performance indicator and used as a
reference energy performance indicator.

The refrigeration TR is assessed as
     TR = Q ×Cp × (Ti – To) / 3024

where
     TR is cooling TR effect produced

     Q is mass flow rate of coolant in kg/hr

     Cp is coolant specific heat in kCal/kg/ºC

     Ti is inlet temperature of coolant to evaporator (chiller) in ºC

     To is outlet temperature of coolant from evaporator (chiller) in ºC

Power consumption
    In a centralized chilled water system, apart from the compressor unit,
power is also consumed by the chilled water (secondary) coolant pump as well
as the condenser water (for heat rejection to cooling tower) pump and cooling
tower fan in the cooling tower. Effectively, the overall energy consumption
would be towards:
    • Compressor kW
   • Chilled water pump kW


                                      - 100 -
Energy Efficiency in Refrigeration Systems


   • Condenser water pump kW
   • Cooling tower fan kW

   • kW/TR of refrigeration plant = sum of all above kW/TR

    In field performance assessment, accurate instruments for inlet and outlet
chilled water temperature and condenser water temperature measurement are
required, preferably with a least count of 0.1ºC. Flow measurements of chilled
water can be made by an ultrasonic flow meter directly or inferred from pump
duty parameters. Adequacy check of chilled water is often needed, and most
units are designed for a typical 0.68 m3/hr per TR (3 gpm/TR) chilled water
flow. Condenser water flow measurement can also be made by a non-contact
flow meter directly or inferred from pump duty parameters. Adequacy check
of condenser water is also often needed, and most units are designed for a
typical 0.91 m3/hr per TR (4 gpm/TR) condenser water flow.
    In case of air conditioning units, the air flow at the Fan Coil Units (FCU) or
the Air Handling Units (AHU) can be measured with an anemometer. Dry bulb
and wet bulb temperatures are measured at the inlet and outlet of AHU or the
FCU, and the refrigeration load in TR is assessed as


              Q×p×(hin-hout)
     TR=
                  3024
where Q is the air flow in m3/h
     p is density of air kg/m3
     h   in is enthalpy of inlet air kCal/kg
     h   out 	 is enthalpy of outlet air kCal/kg


    Use of psychometric charts can help to calculate hin and hout from dry bulb
and wet bulb temperature values, which are measured during trials.
    Power measurements at compressors, pumps, AHU fans, and cooling tower
fans can be accomplished by a portable load analyzer.
    Estimation of process air conditioning load is also possible, by calculating
various heat loads (sensible and latent), based on inlet and outlet air
parameters, air ingress factors, air flow, occupancy pattern, and type of
materials stored.
    An indicative TR load profile for comfort air conditioning is presented as
follows:

     •	 Small office cabins	           = 0.1 TR/m2
     •	 Medium-size offices, i.e.,     = 0.06 TR/m2
     	 10–30 person occupancy
     	 with central A/C
     •	 Large multistoried office = 0.04 TR/ m2
     	 complexes with central A/C


                                       - 101 -
Training Manual on Energy Efficiency for Small and Medium Enterprises


  10.5 OPERATIONAL FACTORS AFFECTING PERFORMANCE AND
        ENERGY EFFICIENCY OF REFRIGERATION PLANTS

10.5.1 Design of process heat exchangers
There is a tendency with most of the process units to operate with high
safety margins, which influences the compressor suction pressure/evaporator
set point. For instance, a process cooling requirement of 15 ºC would need
chilled water at a lower temperature, but the coolant temperature range
can vary from 6ºC to perhaps 10ºC. At 10ºC chilled water temperature, the
refrigerant side temperature has to be lower, perhaps –5 ºC to +5 ºC. The
refrigerant temperature again sets the corresponding suction pressure of the
refrigerant, which determines the inlet duty conditions for work of compression
of the refrigerant compressor. Having the optimum/minimum driving force
(temperature difference) can, thus, help to achieve the highest possible suction
pressure at the compressor, thereby leading to lower energy requirements.
This requires proper sizing of heat transfer areas of process heat exchangers
and evaporators as well as rationalizing the temperature requirement to
highest possible value. A 1ºC raise in evaporator temperature can help to save
almost 3% on power consumption. The TR capacity of the same machine will
also increase with the evaporator temperature, as given in Table 10-1.


Table 10-1 Effect of variation in evaporator temperature on compressor power 	
 	         consumption

    Evaporator            Refrigeration      Specific Power         Increase in
   Temperature             Capacity*          Consumption          kW/ton (%)
       (ºC)                  (tons)

         5.0                   67.58                0.81                  -

         0.0                   56.07                0.94                16.0

         -5.0                  45.98                1.08                33.0

        -10.0                  37.20                1.25                54.0

        -20.0                  23.12                1.67                106.0

* Condenser temperature 40ºC


    In rationalizing the heat transfer areas, the heat transfer coefficient on the
refrigerant side can be considered to range from 1400–2800 watts/m2K. The
refrigerant side heat transfer areas provided are of the order of 0.5 Sqm/TR and
above in evaporators.
    Condensers in a refrigeration plant are critical equipment that influences
the TR capacity and power consumption demands. Given a refrigerant, the
condensing temperature and corresponding condenser pressure depends upon


                                       - 102 -
Energy Efficiency in Refrigeration Systems


the heat transfer area provided, thw effectiveness of heat exchange, and the
type of cooling chosen. A lower condensing temperature and pressure, in the
best of combinations, would mean that the compressor has to work between a
lower pressure differential as the discharge pressure is fixed by the design and
performance of the condenser. The choices of condensers in practice include
air-cooled, air-cooled with water spray, and heat exchanger-cooled. Generously
sized shell and tube heat exchangers as condensers, with good cooling tower
operations, help to operate with low discharge pressure values, and the TR
capacity of the refrigeration plant also improves. With the same refrigerant,
R22, a condensing pressure of 15 kg/cm2 is achieved with a water-cooled shell
and tube condenser, and 20 kg/cm2 is achieved with an air-cooled condenser,
which indicates that almost 30% additional energy consumption is required by
the plant if one selects the air-cooled version. One of the best options at the
design stage would be to select generously sized (0.65 m2/TR and above) shell
and tube condensers with water-cooling as against cheaper alternatives like
air-cooled condensers or water spray atmospheric condenser units.
    The effect of condenser temperature on refrigeration plant energy
requirements is given in Table 10-2.


Table 10-2 Effect of variation in condenser temperature on compressor power 	
 	         consumption

                                                   Specific
   Condensing
                         Refrigeration              Power            Increase in kW/
   Temperature
                        Capacity (tons)         Consumption              TR (%)
      (ºC)
                                                  (kW/TR)

        26.7                    31.5                  1.17                        -

        35.0                    21.4                  1.27                    8.5

        40.0                    20.0                  1.41                   20.5

* Reciprocating compressor using R-22 refrigerant. Evaporator temperature.-10ºC


10.5.2 Maintenance of heat exchanger surfaces
After ensuring procurement, effective maintenance holds the key to optimizing
power consumption. Heat transfer can also be improved by ensuring proper
separation of the lubricating oil and the refrigerant, timely defrosting of coils,
and increasing the velocity of the secondary coolant (air, water, etc.). However,
increased velocity results in larger pressure drops in the distribution system
and higher power consumption in pumps and fans. Therefore, careful analysis
is required to determine the most effective and efficient option.
    Fouled condenser tubes force the compressor to work harder, to attain the
desired capacity. For example, a 0.8mm scale build-up on condenser tubes can
increase energy consumption by as much as 35%. Similarly, fouled evaporators
(due to residual lubricating oil or infiltration of air) result in increased power


                                          - 103 -
Training Manual on Energy Efficiency for Small and Medium Enterprises


consumption. Equally important is proper selection, sizing, and maintenance of
cooling towers. A reduction of 0.55ºC temperature in water returning from the
cooling tower reduces compressor power consumption by 3.0 % (see Table 10-3).


Table 10-3 Effect of poor maintenance on compressor power consumption

                                                           Specific
                 Evap.     Cond.     Refrigeration                            Increase
                                                            Power
 Condition       Temp      Temp       Capacity*                              in kW/Ton
                                                         Consumption
                  (ºC)      (ºC)        (tons)                                   (%)
                                                          (kW/ton)

   Normal         7.2       40.5           17.0               0.69                 -

   Dirty
                  7.2       46.1           15.6               0.84               20.4
 condenser

    Dirty
                  1.7       40.5           13.8               0.82               18.3
 evaporator

    Dirty
 condenser
                  1.7       46.1           12.7               0.96               38.7
    and
 evaporator

* 15-ton reciprocating compressor-based system. The power consumption is lower than that for
systems typically available in India. However, the percentage change in power consumption is
indicative of the effect of poor maintenance.


10.5.3 Multi-staging for efficiency
Efficient compressor operation requires that the compression ratio be kept
low, to reduce discharge pressure and temperature. For low-temperature
applications involving high compression ratios, and for wide temperature
requirements, it is preferable (due to equipment design limitations) and often
economical to employ multi-stage reciprocating machines or centrifugal/screw
compressors.
    Multi-staging systems are of two types, compound and cascade, and
are applicable to all types of compressors. With reciprocating or rotary
compressors, two-stage compressors are preferable for load temperatures
from –20 to –58ºC, and with centrifugal machines for temperatures around
–43ºC.
    In multi-stage operation, a first-stage compressor, sized to meet the
cooling load, feeds into the suction of a second-stage compressor after inter-
cooling of the gas. A part of the high-pressure liquid from the condenser is
flashed and used for liquid sub-cooling. The second compressor, therefore, has
to meet the load of the evaporator and the flash gas. A single refrigerant is
used in the system, and the work of compression is shared equally by the two
compressors. Therefore, two compressors with low compression ratios can in
combination provide a high compression ratio.


                                         - 104 -
Energy Efficiency in Refrigeration Systems


   For temperatures in the range of –46ºC to –101ºC, cascaded systems are
preferable. In this system, two separate systems using different refrigerants
are connected such that one provides the means of heat rejection to the other.
The chief advantage of this system is that a low-temperature refrigerant which
has a high suction temperature and low specific volume can be selected for the
low-stage to meet very low temperature requirements.

10.5.4 Matching capacity to system load
During partial-load operation, the evaporator temperature rises and the
condenser temperature falls, effectively increasing the COP. But at the same
time, deviation from the design operation point and the fact that mechanical
losses form a greater proportion of the total power negate the effect of
improved COP, resulting in lower partial-load efficiency.
    Therefore, consideration of partial-load operation is important, because
most refrigeration applications have varying loads. The load may vary due to
variations in temperature and process cooling needs. Matching refrigeration
capacity to the load is a difficult exercise, requiring knowledge of compressor
performance and variations in ambient conditions, and detailed knowledge of
the cooling load.

10.5.5 Capacity control and energy efficiency
The capacity of compressors is controlled in a number of ways. Capacity control
of reciprocating compressors through cylinder unloading results in incremental
(step-by-step) modulation as against continuous capacity modulation of
centrifugal through vane control and screw compressors through sliding
valves. Therefore, temperature control requires careful system design. Usually,
when using reciprocating compressors in applications with widely varying
loads, it is desirable to control the compressor by monitoring the return water
(or other secondary coolant) temperature rather than the temperature of the
water leaving the chiller. This prevents excessive on–off cycling or unnecessary
loading/unloading of the compressor. However, if load fluctuations are not high,
the temperature of the water leaving the chiller should be monitored. This
has the advantage of preventing operation at very low water temperatures,
especially when flow reduces at low loads. The leaving water temperature
should be monitored for centrifugal and screw chillers.
    Capacity regulation through speed control is the most efficient option.
However, when employing speed control for reciprocating compressors, it
should be ensured that the lubrication system is not affected. In the case of
centrifugal compressors, it is usually desirable to restrict speed control to
about 50% of the capacity to prevent surging. Below 50%, vane control or hot
gas bypass can be used for capacity modulation.
    The efficiency of screw compressors operating at partial load is generally
higher than either centrifugal compressors or reciprocating compressors,
which may make them attractive in situations where partial-load operation is
common. Screw compressor performance can be optimized by changing the
volume ratio. In some cases, this may result in higher full-load efficiencies as


                                    - 105 -
Training Manual on Energy Efficiency for Small and Medium Enterprises


compared to reciprocating and centrifugal compressors. Also, the ability of
screw compressors to tolerate oil and liquid refrigerant slugs makes them
preferred in some situations.

10.5.6 Multi-level refrigeration for plant needs
The selection of refrigeration systems also depends on the range of
temperatures required in the plant. For diverse applications requiring a wide
range of temperatures, it is generally more economical to provide several
packaged units (several units distributed throughout the plant) instead of one
large central plant. Another advantage would be the flexibility and reliability
accorded. The selection of packaged units could also be made depending on
the distance at which cooling loads need to be met. Packaged units at load
centers reduce distribution losses in the system. Despite the advantages of
packaged units, central plants generally have lower power consumption since
at reduced loads power consumption can be reduced significantly due to the
large condenser and evaporator surfaces.
    Many industries use a bank of compressors at a central location to meet
the load. Usually the chillers feed into a common header from which branch
lines are taken to different locations in the plant. In such situations, operation
at partial-load requires extreme care. For efficient operation, the cooling load
and the load on each chiller must be monitored closely. It is more efficient
to operate a single chiller at full load than to operate two chillers at partial-
load. The distribution system should be designed such that individual chillers
can feed all branch lines. Isolation valves must be provided to ensure that
chilled water (or other coolant) does not flow through chillers that are not in
operation. Valves should also be provided on branch lines to isolate sections
where cooling is not required. This reduces pressure drops in the system and
reduces power consumption in the pumping system. Individual compressors
should be loaded to their full capacity before operating a second compressor.
In some cases it is economical to provide a separate smaller-capacity chiller,
which can be operated on an on–off control to meet peak demands, with larger
chillers meeting the base load.
    Flow control is also commonly used to meet varying demands. In such
cases the savings in pumping at reduced flow should be weighed against the
reduced heat transfer in coils due to reduced velocity. In some cases, operation
at normal flow rates, with subsequent longer periods of no-load (or shutoff)
operation of the compressor, may result in larger savings.

10.5.7 Chilled water storage
Depending on the nature of the load, it is economical to provide a chilled water
storage facility with very good cold insulation. Also, the storage facility can
be fully filled to meet the process requirements so that chillers need not be
operated continuously. This system is usually economical if small variations in
temperature are acceptable. This system has the added advantage of allowing
the chillers to be operated at periods of low electricity demand to reduce peak
demand charges. Low tariffs offered by some electric utilities for operation


                                      - 106 -
Energy Efficiency in Refrigeration Systems


at night can also be taken advantage of by using a storage facility. An
added benefit is that lower ambient temperature at night lowers condenser
temperature and thereby increases the COP.
    If temperature variations cannot be tolerated, it may not be economical to
provide a storage facility since the secondary coolant would have to be stored
at a temperature much lower than required to provide for heat gain. The
additional cost of cooling to a lower temperature may offset the benefits. The
solutions are case-specific. For example, in some cases it may be possible to
employ large heat exchangers, at a lower cost burden than low-temperature
chiller operation, to take advantage of the storage facility even when
temperature variations are not acceptable. Ice bank systems which store ice
rather than water are often economical.


          10.6 GOOD PRACTICES FOR ENERGY EFFICIENCY

In refrigeration plants and systems, adoption of the following good practices
improves energy efficiency significantly:

10.6.1 Operation and maintenance-related measures
•	 Establish a chiller efficiency-maintenance program. Start with an energy
   audit and follow-up; then make a chiller efficiency-maintenance program a
   part of your continuous energy management program.
•	 Chillers often represent a plant’s single largest electric load. Fouled tubes,
   leaking refrigerant, changes in water temperature, and a myriad of other
   variables can increase operating costs by 8%–10%. Operating a chiller at
   its peak performance saves energy as well as maintenance costs.
•	 Chiller efficiencies have improved significantly during the past ten years,
   mostly as a result of new refrigerants and microprocessor controls, as well
   as improved compressor and motor design. However, high-tech chillers
   have narrower tolerances, and service and upkeep are more crucial than
   ever for keeping them operating at peak performance.
•	 Chiller performance varies significantly with operating conditions. Full-
   load performance is not a good indicator of overall performance, because
   chiller plants rarely operate at full load. Instead, partial-load performance
   is critical to good overall chiller plant performance. A good reference
   is ASHRAE Standard 90.1-2001, which lists minimum chiller efficiency
   requirements.
•	 The daily log is still the first step in maintaining an efficiently run chiller
   plant in terms of operating conditions, including temperature, pressure,
   fluid level, and flow rate. Although microprocessor controls are recording
   more of these statistics, there is no substitute for a written log detailing
   findings from daily inspection of controls in the chiller room.
•	 Heat transfer has the greatest single effect on chiller performance, and
   maintaining good heat transfer is fundamental to maintaining efficiency.
   Chiller efficiency declines rapidly when tubes become fouled. Contaminants,


                                     - 107 -
Training Manual on Energy Efficiency for Small and Medium Enterprises


   such as minerals, scale, mud, algae and other impurities, increase thermal
   resistance and reduce overall performance. These contaminants accumulate
   on the water side of heat transfer surfaces in both closed- and open-loop
   systems. Fouling occurs gradually over time, depending on the quality and
   temperature of the water used.
•	 The compressor’s approach temperature, the difference between the
   temperature of the fluid leaving the heat exchanger, and the saturation
   temperature of the refrigerant being cooled or heated are good indicators
   of heat transfer efficiency. An increasing approach is a prime indicator that
   heat transfer efficiency is decreasing. An accurate log sheet will reveal
   when temperatures start to vary from efficient levels.
•	 Condenser tubes should be brush-cleaned, rather than chemically cleaned,
   at least annually, with an automatic rotary-cleaning machine to keep them
   free of contaminants.
•	 Condenser water using open cooling sources, such as atmospheric cooling
   towers, require water treatment to prevent fouling. Erosive conditions—for
   example, sand flowing through the tubes at high velocity—may pit tubes,
   decreasing tube effectiveness. Untreated water can damage tubes, piping,
   and other materials.
•	 A cooling tower blowdown is the most effective way to remove solids and
   contaminants. When a sensor detects high water conductivity, an automatic
   valve dumps some water and its load of dissolved and suspended solids. A
   visual inspection also is a good (although less accurate) indicator of water
   quality. Inspect chilled water loops once a year for general water quality
   and evidence of corrosion.
•	 Lowering the temperature of the water entering the condenser can improve
   the chiller’s efficiency.
•	 Flow rate must be regulated closely, because too low a flow rate reduces
   chiller efficiency, leading to laminar flow. The minimum velocity is typically
   around 3 ft/second. However, too high a flow rate leads to vibration, noise,
   and tube erosion. The maximum recommended flow rate is typically around
   12 ft/second.
•	 The amount of cooling that any chiller can provide depends on how much
   refrigerant it moves through the compressor per unit time. It’s important to
   maintain the proper level of refrigerant. Leaks, as well as air and moisture,
   decrease efficiency and system reliability. Low refrigerant charge, usually
   resulting from leaks, causes the compressor to work harder and achieve
   less cooling.
•	 Air and moisture are two non-condensables that can leak into low-
   pressure chillers. Non-condensables can reduce chiller efficiency by as
   much as 4% at 60% loads and 7% at 100% loads. Air insulates tubes,
   preventing exchange and elevating condensing temperatures, which also
   makes the compressor work harder. Moisture promotes acid formation,
   which can damage motor windings and bearings. Installing purge units on
   low-pressure chillers minimizes the effect of non-condensables. Positive


                                      - 108 -
Energy Efficiency in Refrigeration Systems


   pressure chillers using HFC-134a, HFC-410a, and HCFC-22 do not require
   purge units because non-condensables cannot enter them.
•	 Once a year, test compressor lube oil for a spectrometric chemical analysis
   that will provide details about moisture content, metals, acids, and other
   contaminants that affect performance. Oil should be replaced only if
   necessary. High moisture levels can indicate a purge unit problem, which
   has a significant effect on efficiency. Test samples from low-pressure
   chillers more frequently, using a schedule based on purge run hours.
   Replace oil filters when they exhibit a high pressure drop and when the oil
   charge is replaced.
•	 For efficient starter and motor operation, check the safety and sensor
   calibrations on microprocessor controls. Consult the manufacturer’s
   guidelines. Check chiller electrical connections, wiring, and switch gear
   for hot spots and worn contacts. To prevent insulation faults, test motor
   windings for resistance to ground and winding-to-winding. Check the shaft
   seal on open drive motors for possible refrigerant leaks, and clean motor
   cooling air vents to maximize cooling.
•	 A chiller motor is typically the largest single electrical load in a building.
   Constant-speed compressors match capacity to load through inlet vanes,
   throttling the gas allowed into the compressor impellers. This is not the
   most efficient way to modulate chiller capacity. Under the right operating
   conditions, variable speed drives offer significant energy savings. Variable
   speed drives also act as “soft starters” to reduce the motor’s inrush current
   to almost that of the full-load running amps. This reduction is important for
   chillers operating on emergency power generators. Variable speed drives
   also reduce the mechanical shock of starting large-horsepower motors,
   increasing chiller reliability and life.

10.6.2 Other generic opportunities for energy efficiency
•	 The evolution of compressor technology has progressed from reciprocating
   to rotary, to twin rotary, to scroll, to screw, to centrifugal machines,
   in terms of efficiency. Need-based replacement for renovation and
   modernization for energy efficiency is a good opportunity.
•	 Select most efficient compressors with lowest I kW/TR (integrated kW/TR
   accounting for part load performance).
•	 Rooftop coating adoption, with reflective materials and under-deck
   insulation, will reduce U factor (heat transfer coefficient, which should be
   as low as possible) and heat ingress.
•	 Maintain optimum wall area (70%) to window area (30%) ratio for
   minimizing solar heat gain.
•	 Adopt energy-efficient low-wattage lighting systems to reduce cooling load.
•	 Optimize thermostat settings for energy economy.
•	 Adopt false ceilings in air-conditioned spaces to reduce the area to be
   conditioned.
•	 Adopt double-glazed glass panes in windows to reduce solar heat gains.


                                    - 109 -
Training Manual on Energy Efficiency for Small and Medium Enterprises


•	 Adopt sun film for heat solar gain reduction.
•	 Adopt good filter maintenance practices for better AHU performance.
•	 Regular cooling coil cleaning and ultraviolet light application will reduce
   bacterial effects.
•	 Adopt energy-efficient water-cooled condensers in place of air-cooled
   condensers.
•	 Adopt energy-efficient AHU fans.
•	 Adopt heat recovery wheels in AHUs.
•	 Adopt grooved copper tubes for better heat exchange.
•	 Adopt super slit fins for better heat exchange.
•	 Adopt heat recovery condensers.
•	 Adopt variable frequency drives for pumps and fans for power savings.
•	 Adopt cooling towers with 5 ºF approach, in place of conventional 7 ºF
   approach units, to optimize condenser performance.
•	 Use soft water for condensers to avoid condenser scaling effects.
•	   Use FRP blades in cooling tower fans, for power savings.
•	   Adopt two-way valves for AHUs, to achieve better operational control.
•	   Adopt intelligent building automation and controls.
•	   Adopt chilled water storage and ice bank storage, as applicable, for peak
     demand management and energy savings.
•	 Adopt automatic PF controllers for PF improvement.
•	 Adopt VAR systems, especially where waste heat steam is available at low
   cost, as an eco-friendly and cost-effective alternative.
•	 Adopt eco-friendly refrigerants.


                                      - 110 -
11. GREEN BUILDING CONCEPTS AND GOOD 	
    BUILDING PRACTICES


                           11.1 INTRODUCTION

In current times of rapid infrastructure growth and a looming energy crisis,
there is a strong need to address and incorporate good practices for efficient
energy and resource use while planning for buildings, be it for residential
purposes or for commercial applications.
    Green buildings would squarely address ecological and environmental
impacts in a holistic manner and at the same time offer tremendous economic
benefits to the occupants. A Green building is one which incorporates several
green features, such as energy-efficient and eco-friendly equipment, recycled
and environment-friendly building materials, quality indoor air for human
safety and comfort, use of renewable energy, effective controls and building
management systems, efficient use of water, non-toxic and recycled materials,
effective use of existing landscapes, and adoption of cost-effective and
environment-friendly technologies.


           11.2 TYPICAL FEATURES OF GREEN BUILDINGS

•	 Adoption of erosion control techniques like temporary seeding, permanent
   seeding, and mulching
•	 Occupants encouraged to use mass transportation like bus or rail; use of
   bicycles and use of cleaner fuels for automobiles
•	 Reduction of building footprints to minimize their impact on the environment
•	 Reduction of impervious areas to prevent storm water run-off
•	 Installation of high-efficiency irrigation methods and selection of vegetation
   which has low water consumption
•	   Use of low water plumbing installations
•	   Harvesting of site energy
•	   Use of CFC-free HVAC equipment
•	   Adoption of energy-efficient equipment for air-conditioning and lighting
     systems
•	   Use of on-site renewable energy
•	   Measurement and verification plan to ensure energy and water savings
•	   Adoption of controls and building management systems
•	   Segregation, collection, and disposal of waste streams at source
•	 Use of salvaged or refurbished materials from other sites
•	 Recycling of construction debris to other sites
•	 Use of building materials having a high recycled content


                                    - 111 -
Training Manual on Energy Efficiency for Small and Medium Enterprises


•	 Use of rapidly renewable materials (material which could be replenished
   within a life cycle of 10 years)
•	 Declaration of the site as a non-smoking area, or provision of designated
   areas for smoking
•	 Maintenance of indoor environmental quality, to avoid ‘sick building’
   syndrome
•	 Use of low VOC (volatile organic compound) paints, sealants, and
   adhesives.


                 11.3 BENEFITS OF GREEN BUILDINGS

Green buildings have tremendous benefits, both tangible and intangible. The
most tangible benefit is in reduction of operating energy and water costs right
from day one, and during the entire life cycle of the building.
Green buildings offer a range of benefits, including the following:
•	 30% to 40% reduction in operation cost
•	 Green corporate image
•	 Health and safety of building occupants
•	 Enhanced occupant comfort
•	 Improved productivity of occupants
•	 Incorporation of best operational practices from day one
•	 Incorporation of latest techniques and technologies.


         11.4 GOOD PRACTICES IN THE BUILDING SECTOR
This section outlines some good practices criteria related to them, and
technologies and strategies available for realizing them.
Practice 1: Plan for minimum energy requirements
Criteria:
Establish the minimum level of energy efficiency for the base building and
systems.
Practice 2:
Design to meet building energy efficiency and performance as required by
ASHRAE/IESNA 90.1-1999 or the local energy code, whichever is the more
stringent.
Technologies and strategies:
•	 Design the building envelope and building systems to maximize energy
   performance.
•	 Use a computer simulation model to assess the energy performance and
   identify the most cost-effective energy efficiency measures.
•	 Quantify energy performance as compared to a baseline building.
•	 Have an energy audit performed for the facility regularly.


                                      - 112 -
Green Building Concepts and Good Building Practices


Practice 3: Optimize energy performance
Criteria:
Achieve increasing levels of energy performance above the prerequisite
standard to reduce environmental impacts associated with excessive energy
use.
Practice 4:
Reduce design energy cost compared to the energy cost budget, for regulated
energy components, described in the requirements of ASHRAE/IESNA Standard
90.1-1999, as demonstrated by a whole building simulation using the Energy
Cost Budget Method. Regulate energy components include HVAC systems,
building envelope, service hot water systems, lighting and other regulated
systems as defined by ASHRAE. It is often possible to reduce design energy
cost by 10%–60%.
Technologies and strategies:
•	 Have an energy audit conducted for the building/facility. Design the
   building envelope and building systems to maximize energy performance.
•	 Use a computer simulation model to assess the energy performance and
   identify the most cost-effective energy efficiency measures. Quantify
   energy performance as compared to a baseline building.
•	 North light roofing, transparent roof sheets, ventilation design, chimney
   effect through tower design, aerated concrete blocks/hollow bricks, high
   ceiling, roof cooling salts.
Practice 5: Plan for increasing levels of renewable technology use
Criteria:
Encourage and recognize increasing levels of self-supply through renewable
technologies to reduce environmental impacts associated with fossil fuel
energy use.
Practice 6:
•	 Supply a net fraction of the building’s total energy use (as expressed as
   a fraction of annual energy cost) through the use of on-site renewable
   energy systems.
•	 Target the achievement of renewables share of total energy cost at
   between 5% and 20%.
Technologies and strategies:
•	 Assess the project for renewable energy potential including solar, wind,
   geothermal, biomass, hydro, and bio-gas strategies.
•	 When applying these strategies, take advantage of net information and
   Institutions local and international.
•	 Solar PV, CFL Solar hot water systems, solar cookers, bio-gas plants (rural
   segment), vermin composting.
Practice 7: Plan for minimizing CFC Refrigerants in HVAC equipment
Criteria:
Reduce ozone depletion.


                                   - 113 -
Training Manual on Energy Efficiency for Small and Medium Enterprises


Practice 8:
•	 Zero use of CFC-based refrigerants in new building HVAC base building
   systems.
•	 When reusing existing base building HVAC equipment, complete a
   comprehensive CFC phase out conversion.
Technologies and strategies:
•	 When reusing existing HVAC systems, conduct an inventory to identify
   equipment that uses CFC refrigerants and adopt a replacement schedule
   for these refrigerants.
•	 For new buildings, specify new HVAC equipment that uses no CFC
   refrigerants, e.g. VAR or R134A in vapor compression systems.
•	 Eco-friendly refrigeration systems, VAR (Central A/c) chillers.
Practice 9: Plan for minimizing ozone depletion
Criteria:
Reduce ozone depletion and support early compliance with the Montreal
Protocol.
Practice 10:
Install base building level HVAC and refrigeration equipment and fire
suppression systems that do not contain HCFCs or Halons.
Technologies and strategies for adoption:
•	 When reusing buildings, replace inventory of refrigerants and fire
   suppression chemicals in existing building systems with those that contain
   HCFCs or halons.
•	 For new buildings, specify refrigeration and fire suppression systems that
   use no HCFCs or halons.
Practice 11: Plan for easy accounting of energy and water consumption
Criteria:
Provide for the ongoing accountability and optimization of building energy and
water consumption performance over time.
Practice 12:
Plan with long-term continuous measurement of performance:
•	 Lighting systems and controls
•	 Constant and variable motor loads
•	 Variable frequency drive (VFD) operation
•	 Chiller efficiency at variable loads (kW/ton)
•	 Cooling load
•	 Air and water economizer and heat recovery cycles
•	 Air distribution static pressures and ventilation air volumes
•	 Boiler efficiencies
•	 Building-specific process energy efficiency systems and equipment
•	 Indoor water risers and outdoor irrigation systems


                                      - 114 -
Green Building Concepts and Good Building Practices


Technologies and strategies:
•	 Through building energy audit, model the energy and water systems to
   predict savings.
•	 Design the building with equipment to measure energy and water
   performance.
•	 Draft a Measurement and Verification Plan to apply during building
   operation that compares predicted savings to those actually achieved in the
   field.
Practice 13: Plan for water-efficient landscaping
Criteria:
Limit or eliminate the use of potable water for landscape irrigation.
Practice 14:
•	 Use high efficiency irrigation technology, or
•	 Use captured rain or recycled site water, to reduce potable water
   consumption for irrigation over conventional means.
Technologies and strategies:
•	 Perform a soil/climate analysis to determine appropriate landscape types.
•	 Design the landscape with indigenous plants to reduce or eliminate
   irrigation requirements.
•	 Use high-efficiency irrigation systems and consider reuse of storm water
   for irrigation.
•	 Adopt ISO:14000 certification for large facilities.
•	 Use pervious paver blocks, roof cover with gardens, rainwater harvesting.
Practice 15: Plan for maximum wastewater reuse and less dependence
on municipal water source
Criteria:
Reduce the generation of wastewater and potable water demand, while
increasing the local aquifer recharge.
Practice 16:
•	 Reduce the use of municipally provided potable water for building sewage
   conveyance, or
•	 Treat all wastewater on-site for re-use application.
Technologies and strategies:
•	 Estimate the wastewater volume generated in the building and specify
   high-efficiency fixtures and dry fixtures such as composting toilets and
   waterless urinals to reduce these volumes.
•	 Consider reusing storm water for sewage conveyance or on-site wastewater
   treatment systems (mechanical or natural).
•	 Biological root zone treatment.
•	 Recycled water for gardening.
•	 Sewage water for mechanical (filter press drum) type cleaning systems,
   etc.


                                     - 115 -
Training Manual on Energy Efficiency for Small and Medium Enterprises


Practice 17: Plan for maximizing water use efficiency
Criteria:
Maximize water efficiency within buildings to reduce the burden on municipal
water supply and wastewater systems.
Practice 18:
•	 Employ strategies that in the aggregate use less water than the water-use
   baseline calculated for the building (not including irrigation).
•	 Reduce potable water use by at least 10%.
Technologies and strategies:
•	 Estimate the potable and non-potable water needs for the building.
•	 Use high-efficiency fixtures, dry fixtures such as composting toilets and
   waterless urinals, and occupant sensors to reduce the potable water
   demand.
•	 Consider reuse of storm water for non-potable applications such as toilet
   and urinal flushing, mechanical systems, and custodial uses.
Practice 19: Plan for storage and collection of recyclables while
building
Criteria:
Facilitate the reduction of waste generated by building occupants that is hauled
to and disposed of in landfills.
Practice 20:
Provide an easily accessible area that serves the entire building and is
dedicated to the separation, collection, and storage of materials for recycling
including (at a minimum) paper, glass, plastics, and metals.
Technologies and strategies:
•	 Designate an area for recyclable collection and storage that is appropriately
    sized and located in a convenient area.
•	 Identify local waste handlers and buyers for glass, plastic, office paper,
   newspaper, cardboard, and organic wastes.
•	 Instruct occupants on building recycling procedures.
•	 Consider employing cardboard balers, aluminum can crushers, recycling
   chutes, and other waste management technologies to further enhance the
   recycling program.
•	 Recycle wood, glass, aluminum and ceramic tiles, furniture made of
   bagasse-based completed wood, etc.
Practice 21: Plan for building life extension and re-use
Criteria:
•	 Extend the life cycle of existing building stock.
•	 Conserve resources.
•	 Retain cultural resources.
•	 Reduce waste.


                                      - 116 -
Green Building Concepts and Good Building Practices


•	 Reduce environmental impacts of new buildings as they relate to materials
   manufacturing and transport.
Practice 22:
•	 Reuse large portions of existing structures during renovation or
   redevelopment projects.
•	 Identify opportunities to incorporate salvage materials such as beams and
   posts, flooring, paneling doors, frames, cabinets, furniture, bricks and
   decorative items.
Technologies and strategies:
•	 Consider reuse of existing buildings, including structure, shell, and non-
   shell elements.
•	 Remove elements that pose contamination risk to building occupants and
   upgrade outdated components such as windows, mechanical systems, and
   plumbing fixtures.
Practice 23: Plan for increasing ventilation effectiveness
Criteria:
Provide for the effective delivery and mixing of fresh air to support the health,
safety, and comfort of building occupants.
Practice 24:
•	 For mechanically ventilated buildings, design ventilation systems that
   result in an air change effectiveness (E) greater than or equal to 0.9 as
   determined by ASHRAE 129-1997.
•	 For naturally ventilated spaces, demonstrate a distribution and laminar flow
   pattern that involves not less than 90% of the room or zone area in the
   direction of air flow.
Technologies and strategies:
•	 Design the HVAC system and building envelope to optimize air change
   effectiveness.
•	 Air change effectiveness can be optimized using a variety of ventilation
   strategies including displacement ventilation, low-velocity ventilation, and
   operable windows.
•	 The air change effectiveness of the building after construction should be
    regularly tested.
•	 CO2 monitoring; chimney type ducting for intake/exhaust.
Practice 25: Plan for minimum indoor air quality requirement
Criteria:
Establish minimum indoor air quality (IAQ) performance to prevent the
development of indoor air quality problems in buildings, maintaining the health
and wellbeing of the occupants.
Practice 26:
Meet the minimum requirements of voluntary consensus standard ASHRAE 62-
1999, Ventilation for Acceptable Indoor Air Quality and Approved Addenda.


                                    - 117 -
Training Manual on Energy Efficiency for Small and Medium Enterprises


Technologies and strategies
•	 Design the HVAC system to meet the ventilation requirements of the
   reference standard.
•	 Identify potential IAQ problems on the site and locate air intakes away
   from contaminant sources like low volatile organic matter paints, carpets,
   adhesives, and sealants.
Practice 27: Plan for increased use of local/regional materials
Criteria:
Increase demand for building products that are manufactured locally, thereby
reducing the environmental impacts resulting from their transportation and
supporting the local economy.
Practice 28:
Specify at least 20%–50% of building materials that are manufactured in the
local economy.
Technologies and strategies:
•	 Establish a project goal for locally sourced materials and identify materials
    and material suppliers who can achieve this goal.
•	 During construction, ensure that the specified local materials are installed
    and quantify the total percentage of local materials installed.
•	 Use compressed earth blocks, wood/straw boards, fly ash cement, hollow
    bricks.
Practice 29: Plan for efficient and safe wiring practices
Criteria:
Quality assurance of electrical wiring material, wiring accessories, grounding,
leakage protection, overload protection devices and metering to ensure a safe
and energy-efficient distribution infrastructure.
Practice 30:
Adopt well-established standard material and engineering practices.
Technologies and strategies:
MCCBs/MCBs, CVTs, UPS, electronicb, CFLs, remote controls for lights and
fans, electronic regulators, earth leakage protection relays, and occupancy
sensors are some of the devices and technologies applicable in this context.


11.5 SOME OTHER GENERIC PRACTICES THAT CAN BE ADOPTED

•	 Use of fly-ash-based cement
•	 Use of fly-ash-based Aerocon blocks
•	 Declaration of building as “non-smoking”
•	 CO2 censor installation
•	 Regular checks on AHU filters
•	 Use of composite wood in preference to hardwoods like teak


                                      - 118 -
Green Building Concepts and Good Building Practices


•	 Daylight view for 90% of occupied areas
•	 Minimum 25% open space set apart from built-up area
•	 Site location selected close to bus and rail lines
•	 Better access to community transport rather than individual transportation
•	 Extensive roof garden coverage
•	 Rain water harvesting adoption
•	 Drip irrigation adoption
•	 Adoption of fast-growing plantations
•	 Use of low-U-value glazed glass
•	 Adoption of daylight dimmer controls.


                                     - 119 -
12. CLEAN DEVELOPMENT MECHANISM


                           12.1 INTRODUCTION

The Clean Development Mechanism (CDM) was instituted in 2001, under the
Kyoto Protocol, to enable developed countries to meet their greenhouse gas
(GHG) reduction targets at lower cost through projects in developing countries.
   A CDM project is a development project, driven by market forces, that
reduces GHGs. In a CDM project, an investor from an industrialized country
supplies capital or technology, based on the future values of certified emission
reduction units (CERs), also known as carbon credits, which measure the
reduction of GHGs in the developing country. The procedure starts with the
industrialized country keeping a regularly updated inventory of its emissions.
The country may choose to allocate its national target (set by the Kyoto
Protocol) across a number of domestic emitters, in much the same way that
resources such as fishing rights or logging rights are allocated. A domestic
emitter can meet its allocated target through mitigation activities within the
country, or it can make use of the two Kyoto Protocol project-based flexibility
mechanisms. The CDM allows the emitter to invest in a project in a developing
country or buy CERs from someone who has invested in a project. Under the
CDM, all parties benefit: the host country is assisted in achieving sustainable
development; the owner of the project receives financial and technological
assistance; and the emitter in the industrialized country receives carbon
credits.


                        12.2 OBJECTIVES OF CDM

The CDM has three stated objectives:
•	 To assist parties not included in Annex I (i.e., developing countries) in
   achieving sustainable development.
•	 To contribute to the ultimate objective of the convention (i.e., stabilize GHG
   concentrations in the atmosphere at a level that would prevent dangerous
   anthropogenic interference with the climate system).
•	 To assist parties included in Annex I (developed countries) in achieving
   compliance with their quantified emission limitation and reduction
   commitments under article 3 of the Kyoto Protocol.


     12.3 CDM AS A SUSTAINABLE DEVELOPMENT STRATEGY

The Clean Development Mechanism is designed as an element of the
sustainable development strategy allowing industrialized countries investing
in “clean” projects in developing countries also to gain emission credits. These


                                    - 120 -
Clean Development Mechanism


credits are given in the form of Certified Emission Reductions (CERs), which,
like all the other Kyoto accounting units, are expressed in tons of carbon
dioxide equivalent. The financing country can use these units to offset its
own emission of greenhouse gases during a given period, or sell them to a
country. It can also bank them for use during a subsequent period. Since these
investments are viewed in a positive light, they also add to the reputation of
project developers and investors. At the same time, the recipient country gains
from an increase in investment (which may be from private or public sources)
in sustainable development.


                          12.4 METHODOLOGIES

The Marrakech Accords stipulate that an emission reduction project activity
under the CDM must, among other things:
•	 use an approved methodology to define the baseline emissions (i.e., the
   emission that would have occurred in the absence of the project), from
   which reductions are calculated;
•	 use an approved monitoring methodology to monitor actual emissions
   and collect other information needed to calculate the emission reductions
   achieved; and
•	 be reviewed by an accredited “designated operational entity” which
   confirms that the proposed baseline and monitoring methodologies are
   appropriate and that other eligibility requirements are met.


                   12.5 STAKEHOLDERS AND ROLES

The implementation of CDM projects involves a number of stakeholder
participants and organizations:
•	 Host Government DNA
•	 Annex I DNA
•	 Local Stakeholders
•	 Project Participants
•	 Designated Operating Entity
•	 Executive Board (and Panels)
•	 Meeting of parties to the Kyoto Protocol
•	 Accredited NGOs
Conference of parties serving as meeting of parties (CoP/MoP):
The Conference of Parties Serving as Meeting of Parties (CoP/MoP) to the Kyoto
Protocol is the authority and provides guidance to CDM. The CoP/MoP takes
decision on recommendations by the Executive Board (EB) and designates
Operating Entities (OE). The CoP/MoP also reviews the EB reports as well as
the distribution of Operating Entities and CDM project activities.


                                   - 121 -
Training Manual on Energy Efficiency for Small and Medium Enterprises


Executive board:
The Executive Board supervises the CDM under authority of the MoP of the
Kyoto Protocol. The EB develops the modalities and procedures for the CDM,
as well as the rules and procedures; approves new methodologies; simplifies
modalities and procedures for small-scale CDM projects; accredits and
designates OEs; develops and maintains a CDM registry; makes information
relating to CDM projects publicly available; and reports to the MoP.
Operational entities (OEs):
OEs are accredited and designated by the Executive Board based on the
accreditation standards. The OE validates proposed CDM project activities or
verifies and certifies emission reductions.
Designated National Authority (DNA):
A Designated National Authority (DNA) for CDM should be specified by all
the parties to Kyoto Protocol who participate in CDM project activities. While
the purpose of the DNAs in Annex I countries is to ensure meeting their
commitments specified in Annex B to the Kyoto Protocol and provide written
approval of voluntary participation in each CDM project activity, the DNAs in
Non-Annex I countries which are host parties have the additional responsibility
of providing host country approval and confirming that the project activity
assists the party in achieving sustainable development.
Project participants:
Project participants can either be a party participating in a CDM or public or
private entities authorized by a party to participate in CDM project activities.
Project participants usually initiate and complete measures, operations, or
actions that aim at reducing GHGs and decide on allocation of CERs.
Other stakeholders, parties, and accredited NGOs:
Stakeholders are the public, including individuals, groups, or communities who
are affected or likely to be affected by the proposed CDM activity or actions.
In the context of CDM, parties will be parties to the Kyoto Protocol. NGOs that
have been accredited by UNFCCC can also make stakeholder comments on a
CDM project activity.


   12.6 CDM APPLICATIONS IN INDUSTRIAL ENERGY SYSTEMS

Renewable energy
•	 Wind power
•	 Solar
•	 Biomass power
•	 Hydro power
Energy efficiency measures
•	 Boiler and steam efficiency
•	 Pumps and pumping system
•	 Efficient cooling systems


                                      - 122 -
Clean Development Mechanism


•	 Back pressure turbines
Co-generation in industries having both steam and power requirements
Power sector
•	 Induction of new technologies which are efficient (e.g. thermal)
•	 Reduction in technical T&D losses
Fuel switching
•	 From fossil fuel to green fuels like biomass
Waste management
•	 Capturing of landfill methane emissions to generate power
•	 Utilization of waste and waste water emissions for generation of energy


                                    - 123 -
Annex


        SME energy efficiency opportunities assessment checklist

                                            Estimated
                                                                                Estimated
                                              Energy
                                                                              Potential for
                                           Consumption
                                                                                   Savings
                                           /hr (or any    Hours of
S.      Enconomic                                                                  (Order of
                           Applicability     relevant     Operation   Nos.
No.     Opportunity                                                            magnitude of
                                              energy        /Day
                                                                              savings margin
                                            indicator)
                                                                                indicated in
                                            by Existing
                                                                                   brackets)
                                            Equipment

 1.   Soft Starters       Applicable/                                        (3% of operating
      Energy Savers       Not Applicable                                     kW)

 2.   Variable            Applicable/                                        (3–5 % of
      Speed Drives        Not Applicable                                     operating kW
      (Hydraulic/eddy
      current type)

 3.   Maximum             Applicable/                                        (Reduction of
      Demand              Not Applicable                                     demand charges)
      controller

 4.   Capacitor and       Applicable/                                        (1% on energy
      auto PF controls:   Not Applicable                                     consumption
                                                                             in terms of
                                                                             distribution loss
                                                                             reduction)

 5.   Electronic timers   Applicable/                                        (Direct savings
      for machineries     Not Applicable                                     -depends on the
      and lighting                                                           excess hours of
                                                                             operation above
                                                                             prescribed time
                                                                             of operation)

 6.   Variable            Applicable/                                        (5–15% of
      frequency drive     Not Applicable                                     operating kW
      (Electronic)

 7.   Permanent           Applicable/                                        (10–15%
      magnet motor for    Not Applicable                                     on average
      variable speed                                                         operating kW)
      applications

                                                              (Continued on next page)


                                           - 124 -
Annex


( ... Continued)


       Lighting energy                                            (15–20% on
                            Applicable/
 8.    savers (voltage                                            operating lighting
                            Not Applicable
       controller)                                                kW)


       Efficient lamps                                            (30–50% of
                            Applicable/
 9.    (T5, CFL, métal                                            existing lighting
                            Not Applicable
       halide, HPSV)                                              kW)

       Transparent                                                (Avoids at least
       roofing sheets to    Applicable/                           25% of existing
 10.
       reduce lighting      Not Applicable                        Shop Floor Day
       load                                                       Lighting)

                                                                  (Improvement in
       Energy-efficient     Applicable/
 11.                                                              existing efficiency
       water pumps          Not Applicable
                                                                  up to 75%)

                                                                  (Being small
       FRP blades for
                            Applicable/                           fans reduction of
 12.   cooling tower
                            Not Applicable                        5-7% on existing
       fans
                                                                  fan kW drawl)

                                                                  (Improves spray
       Efficient spray                                            in mist form
                            Applicable/
 13.   nozzles in cooling                                         and completely
                            Not Applicable
       towers                                                     eliminates need
                                                                  for CT-ID fan)

                                                                  (3–5% Savings
       Compressed
                            Applicable/                           in overall
 14.   air ON/OFF
                            Not Applicable                        existing kWh
       controller
                                                                  consumption)

                                                                  (8% reduction in
       Compressed                                                 motor input kW
       air generation       Applicable/                           for every 1 kg/
 15.
       pressure             Not Applicable                        cm2 reduction
       reduction                                                  in discharge
                                                                  pressure)

                                                                  (Direct saving-
                                                                  Leakage based
       Compressed
                            Applicable/                           on Trial (or
 16.   air leakage
                            Not Applicable                        estimated) varies
       reduction
                                                                  between
                                                                  10–40%)

                                                       (Continued on next page)


                                             - 125 -
Training Manual on Energy Efficiency for Small and Medium Enterprises


( ... Continued)
                                                                        (15% reduction
       Trans-vector
                                                                        in compressed
       nozzles for end
                           Applicable/                                  air end use for
 17.   use compressed
                           Not Applicable                               a particular
       air cleaning
                                                                        cleaning
       applications
                                                                        application)

                                                                        (Depending on
                                                                        ON/OFF cycles
                                                                        compressor
       Compressor
                                                                        capacity can be
       speed reduction     Applicable/
 18.                                                                    optimized by
       based on load       Not Applicable
                                                                        speed reduction–
       and unload cycles
                                                                        by pulley
                                                                        modification or
                                                                        VFD)

                                                                        (Normal existing
                                                                        kW/TR (anywhere
                                                                        between 1–2)
       Vapor absorption    Applicable/                                  will reduce to a
 19.
       chiller             Not Applicable                               meager 0.1 kW/
                                                                        TR. Feasible only
                                                                        if waste heat is
                                                                        used for VAR

                                                                        Identification of
                                                                        faulty, leaking
                                                                        traps can save
                           Applicable/
 20.   Steam traps                                                      direct steam loss
                           Not Applicable
                                                                        through them
                                                                        (10–40% on case
                                                                        to case basis)

                                                                        (Up to 70%
                                                                        recovery is
                                                                        possible–this is
                                                                        direct savings
       Condensate          Applicable/
 21.                                                                    as heat input
       recovery            Not Applicable
                                                                        to the boiler
                                                                        OR Hot Water
                                                                        requirement for
                                                                        the process)

                                                        (Continued on next page)


                                            - 126 -
Annex


( ... Continued)
                                                       (Flue gas
                                                       temperature can
                                                       be reduced from
                                                       existing value
       Air pre-heaters
                                                       to 170ºC in case
       for waste heat       Applicable/
 22.                                                   of oil fired and
       recovery in Bbiler   Not Applicable
                                                       130ºC in case
       exhaust gas
                                                       of Coal fired.
                                                       Minimum ΔT of
                                                       flue gas should
                                                       be 40–50ºC)

                                                       (Flue gas
                                                       temperature can
                                                       be reduced from
                                                       existing value
       Air pre-heaters
                                                       to 170ºC in case
       for waste heat
                            Applicable/                of oil fired and
 23.   recovery in
                            Not Applicable             130ºC in case of
       furnace exhaust
                                                       Coal fired. Here
       gas
                                                       ΔT of flue gas
                                                       will be huge and
                                                       WHR potential
                                                       also huge)

                                                       (5–7% of existing
                                                       surface heat loss
       Ceramic
                                                       for temperatures
       insulation
                            Applicable/                below 200ºC and
 24.   for heat loss
                            Not Applicable             up to 10% for
       reduction from
                                                       temperatures
       furnace surfaces
                                                       between
                                                       300–500ºC)


                                             - 127 -

Training manual on energy efficiency for SMEs

  • 1.
    Training Manual onEnergy Efficiency for Small and Medium Enterprises Training Manual on Energy Efficiency Training Manual on Energy Efficiency for Small and Medium Enterprises 550.X.2009 ISBN : 92-833-2399-8 for Small and Medium Enterprises
  • 2.
    The opinions expressedin this publication do not necessarily reflect the official view of the APO. For reproduction of the contents in part or in full, the APO’s prior permission is required. Mr. Pawan Kumar, India, served as the author. ©Asian Productivity Organization, 2010 ISBN: 92-833-7084-8
  • 3.
    CONTENTS List of Tables viii List of Figures ix-xi Foreword xiii 1. FUELS AND COMBUSTION 1 1.1 General criteria for selecting the fuel type 1 1.2 Typical calorific values of fuels 2 1.3 Coal as a fuel 2 1.3.1 Storage and handling of coal 2 1.3.2 Preparation of coal 3 1.3.3 Parameters in coal combustion 4 1.4 Oil as a fuel 5 1.4.1 Tips on storage of fuel oil 5 1.4.2 Pumping choices for fuel oil 5 1.4.3 Parameters in liquid fuel combustion 5 1.4.4 Pre-heating of fuel oil for pumping 7 1.4.5 Pre-heating requirements for oil combustion 7 1.4.6 Parameters for good efficiency in fuel oil combustion 7 1.5 Gaseous fuels 8 1.5.1 Gaseous fuel combustion 8 1.6 Combustion 8 1.6.1 Chemical reactions involved in combustion of fuels 8 1.6.2 The three T’s (temperature, time, turbulence) involved in combustion efficiency 9 1.6.3 Three types of combustion 9 1.6.4 Types of draft systems used in combustion 10 1.7 Key result areas for combustion efficiency 10 2. ENERGY EFFICIENCY IN BOILERS 11 2.1 Introduction 11 2.2 The heating surfaces in a boiler 11 2.3 Boiler types and classification 12 2.3.1 Fire tube boilers 12 2.3.2 Water tube boilers 12 2.3.3 Packaged boilers 12 2.3.4 Fluidized bed combustion (FBC) boilers 12 2.4 Performance evaluation of boilers 13 2.4.1 Thermal efficiency 13 2.4.2 Evaporation ratio 13
  • 4.
    2.5 Boiler watertreatment 14 2.6 Energy efficiency opportunities in boilers 14 2.6.1 Reduce excess air 14 2.6.2 Minimize stack temperature 16 2.6.2.1 Feed water preheating from waste heat of stack gases 16 2.6.2.2 Combustion air preheating from waste heat of stack gases 16 2.6.3 Avoid incomplete combustion 17 2.6.4 Reduce scaling and soot losses 17 2.6.5 Minimize radiation and convection losses 17 2.6.6 Adopt automatic blowdown controls 18 2.6.7 Optimize boiler steam pressure 18 2.6.8 Variable speed control for fans, blowers, and pumps 18 2.6.9 Effect of boiler loading on efficiency 18 2.6.10 Boiler replacement 18 2.7 Case study 19 2.8 Tips for energy efficiency in boilers 20 3. ENERGY EFFICIENCY IN STEAM DISTRIBUTION AND UTILIZATION 21 3.1 Introduction 21 3.2 Important properties of steam 21 3.3 The temperature-enthalpy relationship 22 3.4 Steam tables 22 3.5 Steam distribution system 23 3.6 Steam piping: good practices 23 3.7 Tips on steam piping sizing and layout 24 3.8 Maintenance of steam traps 24 3.9 Good practices for efficient steam utilization 25 3.9.1 Steam leakage quantification 25 3.9.2 Providing dry steam for the process 26 3.9.3 Utilizing steam at the lowest acceptable pressure for the process 27 3.9.4 Insulation of steam pipelines and hot process equipment 27 3.9.5 Minimizing heat transfer barriers 28 3.9.6 Condensate recovery 29 3.9.7 Flash steam recovery 29 3.9.8 Reducing the work to be done by steam 29 3.9.9 Proper utilization of directly injected steam 30 3.9.10 Proper air venting 31 4. ENERGY EFFICIENCY IN FURNACES 32 4.1 Introduction 32 4.2 Types and classification of furnaces 32
  • 5.
    4.3 Characteristics ofan efficient furnace 32 4.4 Furnace energy supply 33 4.5 Oil-fired furnaces 33 4.6 Typical furnace systems 33 4.6.1 Forging furnaces 33 4.6.2 Rerolling mill furnaces 34 4.7 Performance evaluation of a typical furnace 34 4.7.1 Furnace efficiency 35 4.7.2 Useful data 36 4.7.3 Determining black body radiation at a particular temperature 37 4.8 General fuel economy measures in furnaces 40 4.8.1 Combustion with minimum excess air 40 4.8.2 Correct heat distribution 40 4.9 Furnace waste heat recovery 41 4.9.1 Some common waste heat recovery systems 42 4.9.2 Ceramic fiber for reducing thermal mass 44 4.9.3 Ceramic coatings to improve emissivity 45 4.10 Tips for improving energy efficiency in furnaces 45 5. ELECTRICAL LOAD MANAGEMENT 47 5.1 Introduction 47 5.2 Maximum demand basics 47 5.2.1 Load curve of a plant 47 5.2.2 MD recording 48 5.3 Load management strategies 49 5.3.1 Rescheduling and staggering loads 49 5.3.2 Storage of products in process materials and process utilities like refrigeration 49 5.3.3 How ice storage helps in demand control 50 5.4 Power factor (PF) improvement 50 5.4.1 Example problem: 53 5.5 Tips for energy-efficient electrical load management 55 6. ENERGY EFFICIENCY IN ELECTRIC MOTORS 56 6.1 Introduction 56 6.2 Salient aspects of motor performance 56 6.3 The types of motor loss 58 6.4 Energy efficiency opportunities in motors 59 6.4.1 Systems approach 59 6.4.2 Operational measures 59 6.5 Tips for energy efficiency in motors and drives 63
  • 6.
    7. ENERGY EFFICIENCYIN PUMPS 64 7.1 Pump choices 64 7.2 Centrifugal pumps in brief 64 7.3 System characteristics 65 7.4 Typical pump characteristic curves 69 7.5 Flow control methods and energy efficiency 69 7.5.1 Flow control by valve control 69 7.5.2 Bypass control 70 7.5.3 Fixed flow reduction by impeller trimming 71 7.5.4 Meeting variable flow needs by speed reduction 72 7.6 Pump performance assessment 73 7.7 Tips for energy conservation in pumping systems 75 8. ENERGY EFFICIENCY IN FANS 76 8.1 Introduction 76 8.2 Fan types 76 8.3 System resistance 79 8.4 Fan performance assessment 80 8.4.1 Air flow measurement 80 8.4.2 Velocity pressure/velocity calculation 81 8.4.3 Air density calculation 83 8.4.4 Velocity calculation 83 8.4.5 Volume calculation 83 8.4.6 Fan efficiency 83 8.5 Energy savings opportunities 84 8.5.1 Flow control strategies and energy conservation 84 9. ENERGY EFFICIENCY IN COMPRESSED AIR SYSTEMS 88 9.1 Introduction 88 9.2 Compressor types 88 9.3 Compressed air system components 90 9.4 Compressor performance 91 9.4.1 Capacity of a compressor 91 9.4.2 Compressor efficiency definitions 91 9.5 Shop floor methods for assessment and factors affecting energy efficiency 92 9.5.1 Compressor capacity assessment 92 9.5.2 Simple method of capacity assessment on the shop floor 92 9.5.3 Simple method of leak quantification on the shop floor 93 9.5.4 Importance of maintenance for power consumption 94 9.6 Energy efficiency opportunities in compressed air systems 94 9.7 Generic tips for efficient use of compressors 96
  • 7.
    10. ENERGY EFFICIENCYIN REFRIGERATION SYSTEMS 98 10.1 Introduction 98 10.2 Types of applications 98 10.3 Types of refrigeration plants 99 10.3.1 Vapor compression type 99 10.3.2 Vapor absorption type 99 10.4 Performance assessment 100 10.5 Operational factors affecting performance and energy efficiency of refrigeration plants 102 10.5.1 Design of process heat exchangers 102 10.5.2 Maintenance of heat exchanger surfaces 103 10.5.3 Multi-staging for efficiency 104 10.5.4 Matching capacity to system load 105 10.5.5 Capacity control and energy efficiency 105 10.5.6 Multi-level refrigeration for plant needs 106 10.5.7 Chilled water storage 106 10.6 Good practices for energy efficiency 107 10.6.1 Operation and maintenance-related measures 107 10.6.2 Other generic opportunities for energy efficiency 109 11. GREEN BUILDING CONCEPTS AND GOOD BUILDING PRACTICES 111 11.1 Introduction 111 11.2 Typical features of green buildings 111 11.3 Benefits of green buildings 112 11.4 Good practices in the building sector 112 11.5 Some other generic practices that can be adopted 118 12. CLEAN DEVELOPMENT MECHANISM 120 12.1 Introduction 120 12.2 Objectives of CDM 120 12.3 CDM as a sustainable development strategy 120 12.4 Methodologies 121 12.5 Stakeholders and roles 121 12.6 CDM applications in industrial energy systems 122 Annex: 124 SME energy efficiency opportunities assessment checklist 124
  • 8.
    LIST OF TABLES 1-1 Gross calorific values of fuels 2 1-2 Viscosity and pumping temperature 7 2-1 Oxygen coutent and excess air 15 2-2 Boiler specifications 19 3-1 Extract from the steam table 23 3-2 Quantity of heat lost at different temperatures 28 4-1 Radiant heat loss comparison at various temperatures 37 4-2 Pusher type billet reheating furnaces (for rolling mills) 39 4-3 Pusher type forging furnaces 39 4-4 Heat loss in flue gas based on excess air level 40 5-1 Multipliers to determine capacitor KVAR reguired for power factor correction 54 7-1 Calculating pump energy efficiency 74 8-1 Types of fans, characteristics, and typical applications 78-79 8-2 Measurements of air flow 82 9-1 Adsorbents used to dry air 90 9-2 Maintenance factors affecting power consumption 94 10-1 Effect of variation in evaporator temperature on compressor power consumption 102 10-2 Effect of variation in condenser temperature on compressor power consumption 103 10-3 Effect of poor maintenance on compressor power consumption 104 - viii -
  • 9.
    LIST OF FIGURES 1-1 Examples of spontaneous combustion 3 1-2 Temperature and viscosity 6 1-3 Example of chemical reaction producing combustion 9 3-1 Phase diagram 22 3-2 Estimating steam leakage 26 3-3 Dry steam 27 4-1 Furnace classification 32 4-2 Basic diagram of furnace operation 34 4-3 Furnace efficiency 35 4-4 Black body radiation 37 4-5 Burner alignment and heat distribution 41 4-6 Waste heat diagram 42 4-7 Heat exchanger 42 4-8 Convection recuperators 43 4-9 Regenerative burners 44 4-10 Use of ceramic fiber 45 5-1 Maximum demand curve 48 5-2 Time-integrated demand 48 5-3 Load shifting 49 5-4 Using ice storage to reduce peak demand 50 5-5 Maximizing capacity 51 5-6 Capacitor array 52 - ix -
  • 10.
    6-1 Induction motor 56 6-2 Boosting voltage 57 6-3 Load and power 58 6-4 Voltage variation effect on moter performance 60 6-5 Effect of enrgy-saving operation 62 7-1 Design of centrifugal pump 64 7-2 Static head 65 7-3 Friction head 66 7-4 System with high static head 67 7-5 System with low static head 67 7-6 Pump operating point 68 7-7 Pump operating curves 69 7-8 Valve control method 70 7-9 Impeller trimming to reduce flow 71 8-1 Basic diagram of a fan 76 8-2 Types of fans 77 8-3 Types of fan blades 78 8-4 System resistance 80 8-5 Pitot tube measurement 81 8-6 Power consumption of volume control methods 85 9-1 Losses in air compressor systems 88 9-2 Types of compressors available 89 9-3 Compressor selection ratios 89 9-4 Power consumption values for compressors 92 -x-
  • 11.
    10-1 Vapor compression refrigeration 99 10-2 Vapor absorption refrigeration 100 - xi -
  • 12.
    FOREWORD With the risingcosts of energy and concerns about global warming, it is imperative that countries adopt the most efficient energy conservation measures and technologies. Energy conservation must evolve as a way of life in developing countries in the Asia-Pacific region given the limited availability of resources. If we are to share commercial energy equitably across all sections of society, it is necessary to conserve energy and use it efficiently. Industries can become globally competitive when their production process consumes the least amount of energy. For this purpose, energy audits and conservation studies must be conducted at regular intervals in all industries. One of the main bottlenecks in conducting these studies is the lack of technical information on various type of equipment and how energy performance should be measured. The Working Manual on Energy Efficiency in SMEs is an attempt to address this issue in a practical manner. The manual is the outcome of a series of projects organized by the Asian Productivity Organization (APO) comprising e-learning courses, international workshops organized with the National Productivity Council, New Delhi, India and in Kish Island, Islamic Republic of Iran with the National Iranian Productivity Center (NIPC) and national workshops conducted by the author in 2008/09, during which the practical aspects of energy efficiency were discussed. The manual explains energy efficiency aspects for adoption by SMEs from various aspects, and is meant to provide the knowledge needed for energy efficiency adoption in the SME Sector as a complementary resource to the APO’s recently published manual Energy Auditing. The Working Manual on Energy Efficiency for SMEs was developed by the APO to promote the energy efficiency concepts so that industries in the region can perform comprehensive energy audits and become more competitive. I hope that it will find wide acceptance among industry professionals in the Asia- Pacific. Shigeo Takenaka Secretary-General Tokyo, February 2010 - xiii -
  • 13.
    1. FUELS ANDCOMBUSTION Different types of fuels, such as solid, liquid and gaseous, are available for firing in industrial boilers and furnaces. 1.1 GENERAL CRITERIA FOR SELECTING THE FUEL TYPE General criteria for selecting a fuel include the following: Availability: Availability is one of the important criteria in the selection of a fuel. It is desirable to select a fuel that is indigenous and is locally available. Storage and handling: It is desirable to select a fuel that is easy to handle; and, for storage, adequate space is required so that the fuel can be stored safely. Cost of fuel: Cost is a key deciding factor for any management. Fuel properties: The constituent properties are important from the perspectives of storage, handling, preparation, and combustion equipment performance. Calorific value: The calorific value of a fuel is the measure of energy content; it is reported as either gross calorific value (GCV) or net calorific value (NCV), units being kCals/kG. The difference between the two calorific values is the latent heat of condensation of the water vapor produced during the combustion process. Efficiency is reported both ways (GCV as well as NCV basis). It is important to note that the efficiency value reported with NCV basis would be higher than the value reported with GCV basis. Sulphur content in fuel: The presence of sulphur in fuel is related to cold end corrosion in cool parts of the chimney/stack, pre-heated air, and economic factors as the sulphur content determines the minimum stack temperature for avoiding acid dewpoint corrosion in a stack. This means higher losses from the stack when sulphur content in the fuel is higher. Analysis (composition) of fuel: Two types of analysis, proximate and ultimate analysis, are used. Ultimate analysis is at the elemental level, and includes carbon, hydrogen, nitrogen, sulphur, etc, and is often useful in design, while proximate analysis gives the broader composition of carbon, volatile matter, moisture, and ash. -1-
  • 14.
    Training Manual onEnergy Efficiency for Small and Medium Enterprises 1.2 TYPICAL CALORIFIC VALUES OF FUELS The calorific value of coal varies considerably depending on the ash, the moisture content, and the type of coal. In fact coal is classified as of a particular grade with respect to its GCV and ash content, and the price varies accordingly. Calorific values of liquid fuels are much more consistent. Agro- based fuels have varying calorific values with respect to composition. Natural gas also has a varying calorific value due to varying constituent share. Table 1-1 Gross calorific values of fuels Fuel Typical GCV (Kcal/Kg) Kerosene 11,100 Diesel Oil 10,800 Light Diesel Oil 10,700 Furnace Oil 10,500 LSHS 10,600 Coal 4,000 to 6,000 Natural Gas 8,200 to 8,600 kCal/NM3 Agro fuels 3,100 to 4,500 KCal/Kg LPG 11,600 to 11,700 KCal/Kg 1.3 COAL AS A FUEL 1.3.1 Storage and handling of coal Storage of coal has its own disadvantages; these include build-up of inventory, space constraints, deterioration in quality over time, and potential fire hazards. Other losses associated with the storage of coal include oxidation, wind, and carpet loss. So our main effort should be to minimize the loss due to spontaneous combustion and carpet loss. -2-
  • 15.
    Fuels and Combustion Figure 1-1 Examples of spontaneous combustion Measures to minimize spontaneous combustion include: • Releasing stagnant trapped air in stacked coal by inserting perforated pipes in coal heaps; • Sprinkling water occasionally as needed, especially in the hot summer months; • Adopting “first in, first out” principles for coal use and avoiding long durations of coal stacking/storage. Measures to reduce carpet losses include: • Preparing a hard surface for coal to be stacked upon; • Preparing standard storage bays made of concrete and brick; • Controlling the height of coal heaps in storage. In industry, modes of coal handling range from manual to conveyor systems. It would be advisable to minimize the handling of coal so that further generation of fine coal dust is avoided. 1.3.2 Preparation of coal Sizing of coal Proper coal sizing, to match the specifications of the type of combustion system, helps to maintain even burning, reduce ash losses, and achieve better combustion efficiency. Proper maintenance and upkeep of equipment like crushers, screens, and mills is very important to ensure proper coal sizing in accordance with manufacturer specifications. Using undersized coal will lead to increased loss through unburnt coal, and using oversized coal can lead to clinker formation losses apart from increases in unburnt losses. Conditioning of coal Segregation of fine particles from larger coal pieces can be reduced to a great extent by conditioning coal with water. Water helps fine particles to stick to the bigger lumps due to surface tension of the moisture, thus stopping fines from -3-
  • 16.
    Training Manual onEnergy Efficiency for Small and Medium Enterprises falling through grate bars or being carried away by the furnace draft. Blending of coal When coal lots have excessive fines, it is advisable to blend the predominantly lumped coal with lots containing excessive fines. Coal blending may thus help to limit the proportion of fines in coal being fired to 25% or less. Blending of different qualities of coal may also help to supply a uniform coal feed to the boiler. 1.3.3 Parameters in coal combustion Fixed carbon: Fixed carbon gives a rough estimate of the heating value of coal. Higher carbon means higher calorific value. Volatile matter: Volatile matter includes such substances as methane, hydrocarbons, hydrogen, carbon monoxide, and incombustible gases like carbon dioxide and nitrogen found in coal. Thus volatile matter is an index of the gaseous fuels present. The typical proportion of volatile matter in coal is 20 to 35%. The presence of volatile matter: • Proportionately increases flame length and helps in easier ignition of coal; • Sets minimum limits on the furnace height and volume; • Influences secondary air requirement and distribution aspects. Ash content: Ash is inorganic material that will not burn. The typical proportion of ash found in coal is 0.5 to 40%, and the ash presence has several detrimental effects: • It reduces handling and burning capacity. • It Increases handling costs. • It affects flame temperature, heat transfer, combustion efficiency, and boiler efficiency. • It causes clinkering and slagging, affecting availability. • It increases auxiliary power consumption. Moisture content: The presence of moisture decreases the heat content per kg of coal, typically by amounts ranging from 0.5 to 10%. It also increases heat loss through stack gases, due to evaporation and superheating. A small quantity, however, at times helps in binding fines together. Sulphur content: The typical amount of sulphur found in coal is 0.5 to 5%. An excess of it affects clinkering and slagging tendencies, corrodes mild steel chimneys and other equipment such as air heaters and economizers, limits the exit flue gas temperature due to acid dewpoint, and affects efficiency. -4-
  • 17.
    Fuels and Combustion 1.4 OIL AS A FUEL 1.4.1 Tips on storage of fuel oil • It is hazardous to store furnace oil in barrels. • It is preferable to store oil in cylindrical tanks either above or below the ground. • Storage capacity should be at least 10 days of normal consumption. • Bund walls should be built around tanks. • Periodical cleaning of tanks is necessary: annually for heavy fuels and every two years for light fuels. • Leaks from joints, flanges, and pipelines must be attended to immediately, and should be avoided at all costs. - Loss of even one drop of oil every second can cost over 4000 liters a year. - Fuel oil should be free from contaminants such as dirt, sludge, and water before it is fed to a combustion system. 1.4.2 Pumping choices for fuel oil The following are good pumping choices for fuel oils: • Positive displacement pumps are best for heavy fuel oils. • Gear pumps are best for light diesel oils. • Diaphragm pumps have a shorter service life, but are easier and less expensive to repair. • Light fuels are best pumped with centrifugal or turbine pumps. When higher pressures are required, piston or diaphragm pumps should be used. 1.4.3 Parameters in liquid fuel combustion Density: Density is the ratio of mass of fuel to the volume of fuel. Density: Mass of fuel Volume of fue Reference temperature is typically 15ºC, and units are (kg/m3.) Specific gravity: Specific gravity is the ratio of weight of a given volume of oil to the weight of the same volume of water at a given temperature. Specific gravity: Weight of a given volume of oil Weight of the same volume of water at a given temperature Higher specific gravity normally means higher heating value: • Light oil = 0.85–0.87 -5-
  • 18.
    Training Manual onEnergy Efficiency for Small and Medium Enterprises • Furnace oil = 0.89–0.95 • L.S.H.S. = 0.88–0.98 Viscosity: Viscosity is internal resistance to flow of fluid. It influences the degree of pre- heat required for handling, storage, and satisfactory atomization. Figure 1-2 Temperature and viscosity Specific heat: The specific heat of a fuel oil is the amount of energy (kcals) needed to raise the temperature of 1 kg of oil by 1ºC. The unit of specific heat is kcal/kgºC and denotes heat capacity, and is useful in designing of heating systems. It varies from 0.22 to 0.28 depending on the oil-specific gravity. It also helps to quantify how much steam or electrical energy is required for preheating. Flash point: Flash point is the lowest temperature at which the fuel vapors released flash momentarily when an open flame is passed over them. The flash point for furnace oil is 66ºC. It affects safe storage conditions. Pour point: Pour point is the lowest temperature at which fuel oil can be poured/can flow under prescribed conditions. It is a very rough indication of the lowest temperature at which fuel oil can be readily pumped. Water content: Water content of fuel oil is normally very low as the product is handled hot at the refinery site and a maximum limit of 1% is specified in the standard, but water may be present in free or emulsified form. Water can cause damage to the inside furnace surfaces during combustion, especially if it contains dissolved salts. It can also cause spluttering of the flame at -6-
  • 19.
    Fuels and Combustion theburner tip, possibly extinguishing the flame and reducing the flame temperature or lengthening the flame. 1.4.4 Pre-heating of fuel oil for pumping Pre-heating oil in storage may be needed to make it less viscous and easily pumpable. Heating an entire oil tank or outflow heater may be needed to heat oil which is to be pumped away. Outflow heaters with steam or electricity are also used often to ensure smooth pumping. 1.4.5 Pre-heating requirements for oil combustion For pre-heating of oil, in-line heaters are to be used to raise oil temperature from pumping to combustion temperature. In-line heaters are of either electrical or steam tracing type. The pre-heat temperatures of oil are determined by the viscosity of oil supplied at room temperature and the recommended viscosity at the burner tip. Table 1-2 Viscosity and pumping temperature Viscosity (Centistokes) Pumping Temperature, ºC 50 60 230 104 900 121 1.4.6 Parameters for good efficiency in fuel oil combustion • Maintain viscosity of oil of 100 Redwood sec I at burner tip by proper setting of pre-heat temperature. • Provide atomizing air at 1–3 kg/cm2 (about 2% of total air requirement) • About 14 kg of air/kg of fuel oil is required for complete combustion. Optimum efficiency occurs with around 10% excess air. • To control for excess air, flue gases should be continuously analyzed for CO2 or O2. • Acid formation occurs at around 160ºC, and cold end corrosion should be avoided by maintaining stack temperature at above 160ºC. • Slightest damage to the burner tip may increase fuel consumption by 10– 15%, and hence any wornout tips should be replaced immediately. • Oil pressure at the burner tip for pressure jet burners should be 17–20 kg/cm2. • Correct flame is normally short. Flame impingement on walls and tubes is to be avoided since it causes carbon/soot deposits. -7-
  • 20.
    Training Manual onEnergy Efficiency for Small and Medium Enterprises • Too short a flame indicates high excess air, and air supply to burners should be adjusted for a light hazy brown color at the chimney. 1.5 GASEOUS FUELS LPG LPG is a mixture of gases, predominantly propane and butane with a small percentage of unsaturated hydrocarbon chains (propylene and butylene). It is gaseous at normal atmospheric pressure, but may be condensed to a liquid state at normal temperature by the application of moderate pressure. Liquid LPG evaporates to produce about 250 times the volume of gas. Its vapor is denser than air. Natural gas Methane is the main constituent of natural gas, accounting for about 95% of the total volume. Other components are ethane, propane, butane, pentane, and nitrogen. The content of sulphur is negligible. Natural gas is lighter than air and disperses into air easily. 1.5.1 Gaseous fuel combustion Combustion of gaseous fuels is similar to that of liquid fuels; in fact, highest efficiencies can be achieved with gaseous fuels, as very good atomization conditions can be achieved. 1.6 COMBUSTION • Combustion is a high-speed, high-temperature chemical reaction in which the rapid union of an element or compound with oxygen liberate heat – controlled explosion. • Combustion occurs when elements of fuel such as carbon and hydrogen combine with oxygen. (see Figure 1-3). 1.6.1 Chemical reactions involved in combustion of fuels C + O2 CO2 + 8084 kcals/kg of carbon 2C + O2 2 CO + 2430 kcals/kg of carbon 2H 2 + O2 2H2O + 28,922 kcals/kg of hydrogen S + O2 SO2 + 2,224 kcals/kg of sulphur -8-
  • 21.
    Fuels and Combustion Figure 1-3 Example of chemical reaction producing combustion 1.6.2 The three T’s (Temperature, Time, Turbulence) involved in combustion efficiency Time All combustion reactions require sufficient time (residence time) for completion, or else incomplete and inefficient combustion results. Temperature The temperature around the fuel release area at the burner tip must be must be greater than ignition temperature, or else incomplete combustion results. Turbulence Proper turbulence close to the flame area helps to bring fuel and air into intimate contact and provides ideal conditions for complete combustion. 1.6.3 Three types of combustion • Perfect combustion is achieved when all the fuel is burnt, using only the theoretically ideal amount of air, but perfect combustion can rarely be achieved in practice. • Good/complete combustion is achieved when all the fuel is burnt, using the minimal amount of excess air (over and above the theoretically ideal amount of air needed to burn the fuel). Complete combustion with minimum excess air is always our goal since heat losses due to high excess air in flue gases are unaffordable and unacceptable from the efficiency point of view. • Incomplete combustion occurs when the fuel is not completely burnt and some escapes as CO in flue gases or as unburnts in refuse, both of which result in high losses and low efficiency. Flue gas analysis of combustion is important, as it helps us to achieve efficient combustion conditions by controlling excess air and reducing CO in flue gases. -9-
  • 22.
    Training Manual onEnergy Efficiency for Small and Medium Enterprises 1.6.4 Types of draft systems used in combustion The function of a draft in a combustion systems is to exhaust the products of combustion into the atmosphere. Natural draft: A natural draft is the draft produced by a chimney alone. It is caused by the difference in weight between the column of hot gas inside the chimney and the column of outside air at the same height and cross-section. Mechanical draft: A mechanical draft is a draft artificially produced by fans. (There are three basic types.) Forced draft: A forced draft system uses a fan to deliver the combustion air into the furnace, and to force combustion products to pass through the boiler/furnace and up the stack. Induced draft: An induced draft system provides suction at the chimney side, to evacuate products of combustion all through the furnace. The furnace is kept at a slight negative pressure below the atmospheric pressure. Balanced draft: A balanced draft is a combination of a forced and an induced draft system where a forced-draft fan pushes combustion air into the furnace and an induced-draft fan draws gases into the chimney, thereby providing a draft to remove the gases from the boiler (0.05 to 0.10 in. of water gauge below atmospheric pressure). In all the above mechanical draft systems, electric power is used for fan requirements. 1.7 KEY RESULT AREAS FOR COMBUSTION EFFICIENCY For energy efficiency in combustion systems, irrespective of the fuel used, the following are the key result areas to be pursued: • Ensuring proper fuel storage, handling, and preparation, for achieving good combustion conditions. • Avoiding partial load operations of combustion equipment. • Operating with minimum excess air for fuel economy. • Operating with lowest the possible stack temperature for fuel economy. • Operating with minimum amounts of combustibles in refuse (ash) and CO in flue gases. • Operating with variable speed options for fan motors, if capacity control is needed (rather than inefficient damper control operations) in order to achieve power savings. - 10 -
  • 23.
    2. ENERGY EFFICIENCYIN BOILERS 2.1 INTRODUCTION A boiler is an enclosed pressure vessel that provides means for combustion heat to be transferred into water until it becomes steam. The steam under pressure is then usable for providing heat for an industrial process. When water is boiled into steam, its volume increases about 1,600 times, producing a force that is almost as explosive as gunpowder. This makes a boiler an extremely dangerous piece of equipment that must be treated with utmost care. A boiler system comprises three parts: 1. A feed water system, 2. A steam system, and 3. A fuel system. The feed water system provides water to the boiler and regulates it automatically to meet the steam demand. Various valves provide access for maintenance and repair. The steam system collects and controls the steam produced in the boiler. Steam is directed through a piping system to the point of use. Throughout the system, steam pressure is regulated using valves and checked with steam pressure gauges. The fuel system includes all the equipment used to provide fuel to generate the necessary heat. The equipment required in the fuel system depends on the type of fuel used by the system. 2.2 THE HEATING SURFACES IN A BOILER The amount of heating surface of a boiler is expressed in square meters. Any part of the boiler metal that actually contributes to making steam is a heating surface. The larger the heating surface a boiler has, the higher will be its capacity to raise steam. Heating surfaces can be classified into several types: 1. Radiant Heating Surfaces (direct or primary) include all water-backed surfaces that are directly exposed to the radiant heat of the combustion flame. 2. Convection Heating Surfaces (indirect or secondary) include all those water-backed surfaces exposed only to hot combustion gases. 3. Extended Heating Surfaces include economizers and super heaters used in certain types of water tube boilers. - 11 -
  • 24.
    Training Manual onEnergy Efficiency for Small and Medium Enterprises 2.3 BOILER TYPES AND CLASSIFICATION Broadly, boilers found in SME industries can be classified into four types: fire tube boilers, water tube boilers, packaged boilers, and fluidized bed combustion boilers. 2.3.1 Fire tube boilers Fire tube or “fire in tube” boilers contain long steel tubes through which the hot gases from a furnace pass and around which the water to be converted to steam circulates. It is used for small steam capacities (up to 12000 kg/hr and 17.5kg/cm2). The advantages of fire tube boilers include their low capital cost and fuel efficiency (over 80%). They are easy to operate, accept wide load fluctuations, and, because they can handle large volumes of water, produce less variation in steam pressure. 2.3.2 Water tube boilers In water tube or “water in tube” boilers, water passes through the tubes and the hot gasses pass outside the tubes. These boilers can be of single- or multiple-drum type. They can be built to handle larger steam capacities and higher pressures, and have higher efficiencies than fire tube boilers. They are found in power plants whose steam capacities range from 4.5–120 t/hr, and are characterized by high capital cost. These boilers are used when high- pressure high-capacity steam production is demanded. They require more controls and very stringent water quality standards. 2.3.3 Packaged boilers The packaged boiler is so called because it comes as a complete package. Once delivered to a site, it requires only steam, water pipe work, fuel supply, and electrical connections in order to become operational. Package boilers are generally of shell type with fire tube design so as to achieve high heat transfer rates by both radiation and convection. These boilers are classified based on the number of passes (the number of times the hot combustion gases pass through the boiler). The combustion chamber is taken as the first pass, after which there may be one, two, or three sets of fire tubes. The most common boiler of this class is a three-pass unit with two sets of fire tubes and with the exhaust gases exiting through the rear of the boiler. 2.3.4 Fluidized bed combustion (FBC) boilers In fluidized bed boilers, fuel burning takes place on a floating (fluidized) bed in suspension. When an evenly distributed air or gas is passed upward through a finely divided bed of solid particles such as sand supported on a fine mesh, the particles are undisturbed at low velocity. As air velocity is gradually increased, a stage is reached when the individual particles are suspended in the air stream. A further increase in velocity gives rise to bubble formation, vigorous - 12 -
  • 25.
    Energy Efficiency inBoilers turbulence, and rapid mixing, and the bed is said to be fluidized. Fluidized bed boilers offer advantages of lower emissions, good efficiency, and adaptability for use of low calorific-value fuels like biomass, municipal waste, etc. 2.4 PERFORMANCE EVALUATION OF BOILERS The performance of a boiler, which include thermal efficiency and evaporation ratio (or steam to fuel ratio), deteriorates over time for reasons that include poor combustion, fouling of heat transfer area, and inadequacies in operation and maintenance. Even for a new boiler, deteriorating fuel quality and water quality can result in poor boiler performance. Boiler efficiency tests help us to calculate deviations of boiler efficiency from the design value and identify areas for improvement. 2.4.1 Thermal efficiency Thermal efficiency of a boiler is defined as the percentage of heat input that is effectively utilized to generate steam. There are two methods of assessing boiler efficiency: direct and indirect. In the direct method, the ratio of heat output (heat gain by water to become steam) to heat input (energy content of fuel) is calculated. In the indirect method, all the heat losses of a boiler are measured and its efficiency computed by subtracting the losses from the maximum of 100. The various losses are calculated as indicated in the example given below. The loss quantification formulae are given in Chapter 4 (Section 4.2.1) of this manual. 2.4.2 Evaporation ratio Evaporation ratio, or steam to fuel ratio, is another simple, conventional parameter to track performance of boilers on-day-to-day basis. For small- capacity boilers, direct method can be attempted, but it is preferable to conduct indirect efficiency evaluation, since an indirect method permits assessment of all losses and can be a tool for loss minimization. In the direct method, steam quality measurement poses uncertainties. Standards can be referred to for computations and methodology of evaluation. The audit worksheets given in APO’s Energy Audit Manual can also be used for this purpose. EXAMPLE OF DIRECT EFFICIENCY CALCULATION: Calculate the efficiency of the boiler from the following data: - Type of boiler : coal-fired - Quantity of steam (dry) generated : 8 TPH - Steam pressure (gauge)/temp : 10 Kg/cm2 (g) / 180 degC - Quantity of coal consumed : 1.8 TPH - Feed water temperature : 85 degC - GCV of coal : 3200 kcal/kg - 13 -
  • 26.
    Training Manual onEnergy Efficiency for Small and Medium Enterprises - Enthalpy of steam at 10 kg/cm2 (g) pressure : 665 kcal/kg (saturated) - Enthalpy of inlet fed water : 85 kcal/kg 8 TPH x1000Kgx (665–85) x 100 Boiler efficiency (η)= 1.8 TPH x 1000Kg x 3200 = 80.0% Evaporation Ratio = 8 TPH of steam/1.8 TPH of coal = 4.4 2.5 BOILER WATER TREATMENT Boiler water treatment is an important area for attention since water quality has a major influence on the efficiency of a boiler as well as on its safe operation. The higher the pressure rating, the more stringent the water quality requirements become. Boiler water quality is continuously monitored for buildup of total dissolved solids (TDS) and hardness, and blowdown is carried out (involving heat loss) to limit the same. Boiler water treatment methods are dependant upon quality limits specified for TDS and hardness by the manufacturers, the operating pressure of the boiler, the extent of make-up water used, and the quality of raw water at the site. For small-capacity and low-pressure boilers, water treatment is carried out by adding chemicals to the boiler to prevent the formation of scale, and by converting the scale-forming compounds to free-flowing sludge, which can be removed by blowdown. Limitations: Treatment is applicable to boilers where feed water is low in hardness salts, where low pressure – high TDS content in boiler water is tolerated, and where only small quantities of water need to be treated. If these conditions are not met, then high rates of blowdown are required to dispose of the sludge, and treatment become uneconomical based on heat and water loss considerations. Chemicals Used: Sodium carbonate, sodium aluminate, sodium phosphate, sodium sulphite, and compounds of vegetable or inorganic origin are used for treatment. Internal treatment alone is not recommended. 2.6 ENERGY EFFICIENCY OPPORTUNITIES IN BOILERS The various energy efficiency opportunities in boiler systems can be related to combustion, heat transfer, avoidable losses, high auxiliary power consumption, water quality, and blowdown, and are discussed below. 2.6.1 Reduce excess air To minimize escape of heat through flue gases, reducing excess air (the air - 14 -
  • 27.
    Energy Efficiency inBoilers quantity over and above the theoretical amount needed for combustion) is one of the most important methods of improving boiler efficiency. • Perfect combustion is achieved when all the fuel is burned using only the theoretical amount of air, but perfect combustion can rarely be achieved in practice. • Good/complete combustion is achieved when all the fuel is burned using the minimal amount of excess air (over and above the theoretical amount of air needed to burn the fuel). Complete combustion with minimum excess air is always our goal since heat losses due to high excess air in flue gases are unaffordable and unacceptable from the point of view of efficiency. • Incomplete combustion occurs when all the fuel is not completely burned and escapes as CO in flue gases or as unburnts in refuse, both of which result in higher losses and low efficiency. • Flue gas analysis of combustion is important as it helps to achieve efficient combustion conditions by excess air control and reduction of CO in flue gases. Using gas analyzers, the excess air quantity can be established from measurement of oxygen or carbon dioxide. Based on oxygen value in flue gas, excess air is given as: % of excess air = 100 *% of O2 /(21-% of O2). The relation between % O2 and flue gas and excess air is illustrated in Table 2-1. The advantage of oxygen based analysis is that it is the same for any fuel or fuel combination: Table 2-1 Oxygen content and excess air % O2 % excess air 1 5 2 10.52 3 16.67 4 23.53 5 31.25 6 40 7 50 8 61.7 9 77 10 90.9 11 110 - 15 -
  • 28.
    Training Manual onEnergy Efficiency for Small and Medium Enterprises The effort, therefore, should be to operate the boiler with minimum % O2 in flue gases (excess air), eliminating all avenues of excess air used for combustion and in the flue gas path. 2.6.2 Minimize stack temperature The stack temperature should be as low as possible, since it carries all the heat from the fuel. However, it should not be so low that water vapor from exhaust condenses on the stack walls. This is important in fuels containing significant sulphur, as low temperature can lead to sulphur dew point corrosion and acid attack effects on metallic parts in the flue gas path. A stack temperature greater than 200ºC indicates potential for recovery of waste heat. It also sometimes indicates the fouling and scaling of heat transfer/recovery equipment. Boiler users must monitor stack temperature and compare it with design value. When it has increased over time, maintenance of heat transfer surfaces is called for. If the design value itself is high, the stack temperature can be reduced by adopting one of the following waste heat recovery methods. Waste heat recovery systems are typically shell and tube type heat exchangers and heat transfer area, and other design features depend on flow rates, temperature drop considered, etc. 2.6.2.1 Feed water preheating from waste heat of stack gases Where feasible, adoption of feed water heating, using economizer from flue gases with economizer application, gives the highest fuel economy, as one can pre-heat feed water almost up to the saturation temperature of steam. The economizer is a pressure vessel. A lower order and cheaper alternative for achieving fuel economy through flue gas waste heat recovery would be a non-pressurized feed water heater, which allows feed water pre-heating up to a maximum of 100ºC only. Every rise of 6ºC in boiler feed water temperature through waste heat recovery would offer about 1% fuel savings. 2.6.2.2 Combustion air preheating from waste heat of stack gases Combustion air preheating is an alternative to feed water heating, and can be adopted, if no further scope for feed water pre-heating exists and where stack gases still have waste heat potential left to be tapped. Shell and tube type and rotary regenerative type air pre-heaters and regenerative burners are some of the options that can be adopted for waste heat recovery. For every reduction in flue gas temperature by 22ºC for heat recovery, fuel savings of about 1% can be achieved. The combustion air pre-heat temperature limiting value is decided by - 16 -
  • 29.
    Energy Efficiency inBoilers permissible exit flue gas temperature for avoiding chimney corrosion on the one hand, and recommended limits of pre-heat temperature by burner manufacturers on the other. 2.6.3 Avoid incomplete combustion Incomplete combustion can arise from a shortage of air or sulphur of fuel or poor distribution of fuel. It is usually obvious from the color or smoke, and must be corrected immediately. In the case of oil and gas-fired systems, CO or smoke (for oil-fired system only) with normal and high excess air indicates burner system problems like poor mixing of fuel air at the burner. Incomplete combustion can result from high viscosity, worn burner tips, carbonization on burner tips, and deterioration of diffusers or spinner plates. With coal firing, unburnt carbon can escape through fly ash or bottom ash and can lead to 2% to 3% heat loss. Coal preparation, sizing, and air supply should be looked into, in order to avoid this loss. 2.6.4 Reduce scaling and soot losses In oil and coal-fired boilers, soot buildup on tubes acts as an insulator against heat transfer. Any such deposits should be removed on a regular basis. Elevated stack temperatures may indicate excessive soot buildup. The same result will also occur due to scaling on the water side. High exit gas temperatures at normal excess air indicate poor heat transfer performance. This condition can result from a gradual build-up of gas-side or water-side deposits. Water-side deposits require a review of water treatment procedures and tube cleaning, to remove the deposits. Incorrect water treatment, poor combustion, and poor cleaning schedules can easily reduce overall thermal efficiency. However, the additional cost of maintenance and cleaning must be taken into consideration when assessing savings. Every millimeter thickness of soot coating increases the stack temperature by about 55 ºC. A deposit of 3mm of soot can cause an increase in fuel consumption by 2.5%. A 1mm thick scale (deposit) on the water side could increase fuel consumption by 5% to 8%. Stack temperature should be checked and recorded regularly as an indicator of soot deposits and soot removal frequencies decided by trends of temperature rise of flue gas. Fire-side (fuel additives) and water-side additives may be judiciously adopted where justified. 2.6.5 Minimize radiation and convection losses The boiler’s exposed surfaces lose heat to the surroundings depending on the surface area and the difference in temperature between the surface and the surroundings. The heat loss from the boiler shell is normally assumed as fixed energy loss, irrespective of the boiler output. With modern boiler designs, this may represent only 1.5% of the gross calorific value at full rating, but it will increase to around 6% if the boiler operates at only 25% output. Repairing or augmenting insulation can reduce heat loss through boiler walls. - 17 -
  • 30.
    Training Manual onEnergy Efficiency for Small and Medium Enterprises 2.6.6 Adopt automatic blowdown controls As a first choice, ensure maximum condensate recovery, since condensate is the purest form of water, and this would help reduce dependence on make-up water and also blowdown requirements. Uncontrolled, continuous blowdown is very wasteful. For optimizing blowdown, automatic controls can be installed, which can sense and respond to boiler water conductivity and pH. Relate blowdown to TDS limits/Conductivity of boiler and feed water TDS/ Conductivity, by online monitoring. 2.6.7 Optimize boiler steam pressure Wherever permissible, operating a boiler at lower steam pressure (a lower saturated steam temperature, higher latent heat of steam, and a similar reduction in the temperature of the flue gas temperature) helps to achieve fuel economy. In some cases, the process demands are not continuous, and there are periods when the boiler pressure could be reduced. Pressure could be reduced in stages, and no more than a 20% reduction should be considered. Care should be taken that adverse effects, such as an increase in water carryover from the boiler owing to pressure reduction, do not negate any potential savings. 2.6.8 Variable speed control for fans, blowers, and pumps Generally, combustion air control in boilers is achieved by throttling dampers fitted at forced and induced draft fans. Though dampers are a simple means of control, they are an inefficient means of capacity control as they lack accuracy, giving poor control characteristics at the top and bottom of the operating range. If the steam demand characteristic of the boiler is variable, the possibility of replacing an inefficient damper and throttling controls by electronic Variable Speed Drives should be considered for reducing auxiliary power consumed in boiler fans and pumps. 2.6.9 Effect of boilder loading on efficiency Optimum boiler efficiency occurs at 65%–85% of full load. As the steam demand falls, so does the value of the mass flow rate of the flue gases through the tubes. This reduction in flow rate for the available heat transfer area helps to reduce the exit flue gas temperature by a small extent, reducing the sensible heat loss. However, at below 50% load, most combustion appliances need more excess air to burn the fuel completely, and this would increase the sensible heat loss. Operation of a boiler at low loading should be avoided. 2.6.10 Boiler replacement If the existing boiler is old and inefficient, not capable of firing cheaper substitute fuels, over or under-sized for present requirements, not designed for ideal loading conditions, or not responsive to load changes, replacement by a more efficient one needs to be explored. - 18 -
  • 31.
    Energy Efficiency inBoilers 2.7 CASE STUDY Installing Economizer for Heat Recovery: A paper mill retrofitted an economizer to existing boiler. The general specifications of the boiler are given in Table 2-2: Table 2-2 Boiler specifications Boiler Capacity Feed Water Steam Pressure Fuel Oil (T/h) Temp. (ºC) (bar) 8 110 18 Furnace oil The thermal efficiency of the boiler was measured and calculated by the indirect method using a flue gases analyzer and a data log. The result is summarized below: Thermal efficiency : 81% Flue gas temperature : 315ºC CO2 % : 13CO (ppm) : 167 The temperature in the flue gas was in the range of 315 to 320ºC. The waste heat in the flue gas was recovered by installing an economizer, which transfers waste heat from the flue gases to the boiler feed water. This resulted in a rise in feed water temperature by about 26ºC. Basic data: • Average quantity of steam generated.... : 5T/hr • Average flue gas temperature.... : 315ºC • Average steam generation/kg of fuel oil : 14 kg • Feed water inlet temperature.... : 110ºC • Fuel of supply rate : 314 kg/hr • Flue gas quantity : 17.4 kg/kg of fuel Fuel savings achieved: • Quantity of fuel gases : 314x17.4 = 5463.6 kg/hr • Quantity of recovered heat in the flue gases : 5463.6x0.24x(315-200)=150795 kCal/hr • Raise in the feed water temperature : 26ºC • Savings in fuel oil : 16.3 kg/h • Annual operating hours : 8600 • Annual fuel oil savings : 8600x16.3 = 140,180 kg Through recovery of waste heat by installation of an economizer, the paper mill was thus able to achieve fuel savings of 16.3kg/h (in other words 5.19% of previous fuel consumption). - 19 -
  • 32.
    Training Manual onEnergy Efficiency for Small and Medium Enterprises 2.8 TIPS FOR ENERGY EFFICIENCY IN BOILERS • Establish a boiler efficiency-maintenance program. Start with an energy audit and follow-up, then make a boiler efficiency-maintenance program a part of your continuous energy management program. • Preheat combustion air with waste heat. Add an economizer to preheat boiler feed water using exhaust heat. (Every 22°C reduction in flue gas temperature increases boiler efficiency by 1%.) • Use variable speed drives on large boiler combustion air fans with variable flows instead of damper controls. • Insulate exposed hot oil tanks. • Clean burners, nozzles, and strainers regularly. • Inspect oil heaters to ensure proper oil temperature. • Close burner air and/or stack dampers when the burner is off, to minimize heat loss up the stack. • Introduce oxygen trim controls (limit excess air to less than 10% on clean fuels). (Every 5% reduction in excess air increases boiler efficiency by 1%; every 1% reduction of residual oxygen in stack gas increases boiler efficiency by 1%.) • Automate/optimize boiler blowdown. Recover boiler blowdown heat. • Optimize de-aerator venting to minimize steam losses. • Inspect door gaskets for leakage avoidance. • Inspect for scale and sediment on the water side. (Every 1mm-thick scale (deposit) on the water side could increase fuel consumption by 5%–8 %.) • Inspect heating surfaces for soot, fly-ash, and slag deposits on the fire side. (A 3mm-thick soot deposition on the heat transfer surface can cause an increase in fuel consumption of 2.5%.) • Optimize boiler water treatment. • Recycle steam condensate to the maximum extent. • Study part–load characteristics and cycling costs to determine the most efficient combination for operating multiple boiler installations. • Consider using multiple units instead of one or two large boilers, to avoid partial load inefficiencies. - 20 -
  • 33.
    3. ENERGY EFFICIENCYIN STEAM DISTRIBUTION AND UTILIZATION 3.1 INTRODUCTION Steam is used for generating power as well as for process heating applications in industries such as sugar, paper, fertilizer, refineries, petrochemicals, chemicals, food, synthetic fiber and textiles. The following characteristics of steam make it so popular and useful to the industry: • Highest specific heat and latent heat; • Highest heat transfer coefficient; • Easy to control and distribute; • Cheap and inert. 3.2 IMPORTANT PROPERTIES OF STEAM Liquid enthalpy (also known as “Sensible Heat”) When water is first heated to the boiling point, it is called sensible heat addition (with change in temperature); liquid enthalpy (hf) is the “enthalpy” (heat energy) available when it is in the water form, and is typically represented in kCal/kg. Enthalpy of evaporation (also known as “Latent Heat”) Once water reaches its boiling point, the enthalpy of evaporation (hfg) is the additional heat energy to be added to this hot water in order to change it into steam. There is no change in temperature during evaporation, hence the name latent heat. The temperature at which water boils is also called the boiling point or saturation temperature. This value depends on the steam pressure and increases as the steam pressure increases. As the steam pressure increases, the useful latent heat energy in the steam (enthalpy of evaporation) actually decreases. The total heat carried by dry saturated steam or enthalpy of saturated steam is given by the sum of these two enthalpies (hf +hfg). If the heat energy added is less than required latent heat, wet steam is produced, which contains partial water content, and the total heat carried by such wet steam will be lower than that of dry saturated steam. It is detrimental to use wet steam for process and steam distribution. Dryness fraction is the property which tells us how dry the steam is. If saturated steam is heated further to a still higher temperature, it starts behaving like a hot gas, and this steam is called superheated steam. Superheating is the addition of heat to dry saturated steam without an increase in pressure. The temperature of superheated steam, expressed as - 21 -
  • 34.
    Training Manual onEnergy Efficiency for Small and Medium Enterprises degrees above saturation corresponding to the pressure, is known as the degree of superheat. 3.3 THE TEMPERATURE–ENTHALPY RELATIONSHIP The properties of steam provided in the steam tables can also be expressed in a graphic form. Figure 3-1 shows the relationship between the enthalpy and the temperature at different pressures, and is known as a phase diagram. This is also called the Mollier diagram, and it helps us to understand the conditions and transition zones of water to steam and to superheated steam. Figure 3-1 Phase diagram 3.4 STEAM TABLES The steam tables (see Table 3-1) present various steam parameters at different pressure and temperature state points and are a helpful tool for design and analysis of steam systems. - 22 -
  • 35.
    Energy Efficiency inSteam Distribution and Utilization Table 3-1 Extract from the steam table Enthalpy in Kcal/kg Specific Pressure Temperature Water Evaporation Steam Volume (kg/cm2) ºC (hf) (hfg) (hg) (m3/kg) 1 100 100.09 539.06 639.15 1.673 2 120 119.92 526.26 646.18 0.901 3 133 133.42 517.15 650.57 0.616 4 143 143.70 509.96 653.66 0.470 5 151 152.13 503.90 656.03 0.381 6 158 159.33 498.59 657.92 0.321 7 164 165.67 493.82 659.49 0.277 8 170 171.35 489.46 660.81 0.244 3.5 STEAM DISTRIBUTION SYSTEM For efficient steam distribution, an adequate quantity of steam that is dry and free of air must reach the plant at correct pressure; the diameter of steam piping should be optimum, in order to minimize pressure drops and reduce investment and operating costs. 3.6 STEAM PIPING: GOOD PRACTICES • While laying new pipes, it is often necessary to compromise between aesthetics and the architect’s plans. • Steam pipes should be laid along the shortest possible distance. • Provisions need to be made for proper draining of condensate. For example, a 100mm well-lagged pipe 30 meters in length, carrying steam at 7kg/cm2 pressure, can condense nearly 10kg of water in the pipe in one hour unless it is removed from the pipe through traps. • The pipes should run with a fall (slope) of not less than 12.5mm for every 3 meters distance, in the direction of flow. • Drain pockets should be provided every 30–50 meters and at any low point in the pipe network. • Expansion loops are required to take care of the expansion of pipes when they get heated up. • Automatic air vents should be fixed at the dead ends of steam mains, to allow removal of air, which will tend to accumulate. - 23 -
  • 36.
    Training Manual onEnergy Efficiency for Small and Medium Enterprises 3.7 TIPS ON STEAM PIPING SIZING AND LAYOUT Pipe sizing Proper sizing of steam pipelines helps in minimizing pressure drop. The velocities for various types of steam are: • Superheated: 50–70 m/sec • Saturated: 30–40 m/sec • Wet or Exhaust: 20–30 m/sec The steam piping should be sized based on permissible velocity and the available pressure drop in the line. A higher pipe size will reduce the pressure drop and thus the energy cost. However, higher pipe size will increase the initial installation cost. By use of smaller pipe size, even though the installation cost can be reduced, the energy cost will increase due to higher-pressure drop. Thus, optimum sizing is necessary. (Pressure drop change is inversely proportional to the 5th power of diameter change.) Pipe redundancy Pipe redundancy is to be avoided in steam distribution since it leads to significant losses. All redundant pipelines must be eliminated; this could reduce steam distribution losses significantly Drain points Drain points help in removing water in the pipes due to condensation of steam. The presence of water in steam is undesirable as it causes water hammer, leading to damage to steam pipes and eventually leakages. Steam traps must be provided at the drain points to avoid leakage of steam. 3.8 MAINTENANCE OF STEAM TRAPS The key functions of steam traps are: • to discharge condensate once it is formed; • to prevent steam from escaping; and • to discharge air and non-condensable gases. Steam trap performance is very important for fuel economy in all steam-use systems and is one of the major energy efficiency opportunities which can yield surprising results. • Traps that are open, meaning those draining steam and condensate, result in loss of energy and direct loss of condensate (the purest form of water) and significant economic loss as boiler operating costs increase. • Traps that are closed, or become blocked, result in reduced heating capacity of steam heating equipment, and direct loss of production, which is undesirable. - 24 -
  • 37.
    Energy Efficiency inSteam Distribution and Utilization Some tips for steam trap monitoring and maintenance are presented here: • Dirt is one of the most common problem areas. Dirt, scale, or foreign material finds its way to the traps and often damages the valve seat, preventing it from closing properly and leading to leakages. • Strainers provided for handling dirt and other material before it reaches the traps must be maintained properly. • Sight glasses, fitted after the traps, permit visual identification of blowing traps and need to be properly taken care of. • If the trap selected is not the appropriate type and size for the given application, significant losses take place. • Inverted bucket and thermodynamic traps should have intermittent condensate discharge. • Float and thermostatic traps should have a continuous condensate discharge. • Flash steam and leaking steam are not the same. Leaking steam is continuous, like an exhaust, while flash steam is intermittent and like a cloud. • A regular schedule of maintenance should be adopted, to repair and replace defective traps in the interest of fuel economy. • Mechanisms within the traps produce sonic and ultrasonic sounds due to passage of condensate and steam. Using suitable listening devices, ranging from a simple screwdriver a mechanic’s stethoscope, or an ultrasonic trap tester a trap monitoring , , system can be established in an industry. • Similarly, temperature sensing by contact and non-contact devices can help to monitor trap performance. 3.9 GOOD PRACTICES FOR EFFICIENT STEAM UTILIZATION 3.9.1 Steam leakage quantification Steam leakage is a visible indicator of waste and must be avoided. Regular leakage monitoring and rectification is one of the major steam economy measures. A simple graph (see Figure 3-2) can be used for estimating steam leakage. The plume is the visible jet of steam issuing from the point of leakage. And, irrespective of pressure, the length of plume helps us to quantify steam loss in kg per hour. - 25 -
  • 38.
    Training Manual onEnergy Efficiency for Small and Medium Enterprises Figure 3-2 Eestmating steam leakage Example: For a plume length of 700 mm, steam loss is 10 kg/hr. 3.9.2 Providing dry steam for the process Almost all heat transfer processes call for dry steam, and it is necessary to ensure dry steam conditions for efficient use. Wet steam can reduce plant productivity and product quality, and can cause damage to most items of equipment. Disadvantages of allowing wet steam include lower heat content, extended process time, irregular heating, creation of barriers to heat transfer, and overloading of steam traps. At the same time, superheated steam is not desirable for process heating because of its poor heat transfer coefficient; and it also takes time to give up superheat by conduction. The benefit of using dry steam is that heat transfer is rapid. To ensure dry steam for processing, steam separators may be fitted appropriately at the steam head and near steam use equipment. - 26 -
  • 39.
    Energy Efficiency inSteam Distribution and Utilization Figure 3-3 Dry steam 3.9.3 Utilizing steam at the lowest acceptable pressure for the process The latent heat in steam reduces as the steam pressure increases. It is this latent heat of steam that takes part in the heating process when applied to a direct heating system. Thus, it is important that its value be kept as high as possible. This can only be achieved if we try to obtain lower steam pressures. As a guide, the steam should always be generated and distributed at the highest possible pressure, but utilized at as low a pressure as possible since it then has higher latent heat. However, it can also be seen from the steam tables that the lower the steam pressure, the lower will be its temperature. Since temperature is the driving force for the transfer of heat at lower steam pressure, the rate of heat transfer will be slower and the processing time greater. In equipment where fixed losses are high (e.g. big drying cylinders), there may even be an increase in steam consumption at lower pressures due to increased processing time. There are, however, several items of equipment with which one can profitably go in for lower pressures and realize economy in steam consumption without materially affecting production time. Depending on the equipment design, the lowest possible steam pressure with which the equipment can work should be selected without sacrificing either production time or steam consumption. 3.9.4 Insulation of steam pipelines and hot process equipment Heat can be lost due to radiation from steam pipes. For example, while lagging steam pipes, it is common to see flanges uncovered. An uncovered flange is equivalent to leaving 0.6m of pipeline unlagged. If a steam pipe 0.15m in diameter has 5 uncovered flanges, there would be a loss of heat equivalent to wasting 5 tons of coal or 3000 liters of oil a year. Uncovering is usually done to facilitate checking the condition of the flange, but at the cost of considerable heat loss. The remedy is to provide prefabricated insulation covers, which can be easily removed when necessary. The insulating materials used are cork, - 27 -
  • 40.
    Training Manual onEnergy Efficiency for Small and Medium Enterprises glass wool, rock wool, and asbestos. Table 3-2 indicates the heat loss from a hot uninsulated surface to the environment: Table 3-2 Quantity of heat lost at different temperatures Difference in Temperature between Heat Loss Ambient and Hot Surfaces (kCal/m2 /hr) (ºC) 50 500 100 1350 200 3790 400 13640 This is based on 35ºC ambient temperature, 0.9 emissivity factor, and still- wind conditions. The effective insulation of a steam system can bring down the heat losses to less than 75 kCal/m2/hr. It is desirable to limit hot surface temperature to not more than 20ºC above ambient temperature, by insulation, for fuel economy. 3.9.5 Minimizing heat transfer barriers In indirect heating, a temperature difference is required to transfer heat from steam to the material. The main barrier to heat transfer is the thermal conductivity of the pipe carrying steam. Other impediments include the heat transfer barrier of an air film as well as scaling on the steam side, and scaling as well as a stagnation product film on the product side. For instance, it has been estimated that air is 1500 times more resistant to heat transfer than steel and 13,000 times more resistant than copper. Air is probably the best heat insulator ever known. It is also the most likely material to be trapped in all steam supplies, because when steam condenses, air always tries to take its place, on account of the partial vacuum created. Air is also carried into the steam space by incoming steam during startup. It is, therefore, essential that steam-heated equipment should be so designed that all trapped air is pumped out automatically using proper air venting systems. Similarly, scaling of heat transfer areas should be regularly monitored and taken care of by measures like cleaning and de-scaling. - 28 -
  • 41.
    Energy Efficiency inSteam Distribution and Utilization 3.9.6 Condensate recovery Steam condenses after giving off its latent heat in the heating coil or the jacket of the process equipment. A sizable portion (about 25%) of the total heat contained in the steam leaves the process equipment as condensate (hot water). If this hot condensate is returned to the boiler house, it will reduce the fuel requirements in the boiler. For every 6 º C rise in the feed water temperature, there will be approximately 1% saving of fuel in the boiler. Further, in most cases, the boiler water has to be chemically treated to prevent or reduce scale formation, whereas condensate is almost entirely pure water, which needs no treatment. With a high share of the condensate returning to the boiler house, the expenses involved for water treatment can therefore be reduced by an appreciable amount. 3.9.7 Flash steam recovery Flash steam is produced when high pressure condensate is flashed in an enclosure to produce low pressure steam, and can be used for heating application. The specially designed enclosure is called a flash vessel, which is available with most steam equipment suppliers. The flash steam quantity can be calculated by the following formula with the help of steam tables: Flash steam is calculated in % = S1 – S2) / L2 where S1 is the sensible heat of higher pressure condensate, S2 is the sensible heat of steam at lower pressure (at which it has been flashed), and L2 is the latent heat of flash steam (at lower pressure) Thus, higher the steam pressure and lower the flash steam pressure, the greater is the quantity of flash steam that can be generated. In many cases, flash steam from high-pressure equipment is made use of directly by the low- pressure equipment, to reduce the use of fresh steam, through pressure- reducing valves. Flash steam can also be used on low-pressure applications like direct injection and can replace an equal quantity of fresh steam that would otherwise be required. 3.9.8 Reducing the work to be done by steam All the equipment should be supplied with dry saturated steam. To reduce the work done by steam, if any product is to be dried, a press could be used to squeeze as much water as possible, before being heated up in a dryer using steam, which is a more efficient method. - 29 -
  • 42.
    Training Manual onEnergy Efficiency for Small and Medium Enterprises Always use the most economical way to remove the bulk of water from the wet material. Steam can then be used to complete the process. For this reason, hydro extractors, spin dryers, squeeze or calendar rolls, presses, and other equipment are initially used in many drying processes to remove the mass of water. The efficiency with which this operation is carried out is most important. For example, in a laundry for finishing sheets, the normal moisture content of the sheets as they leave the hydro extractor is 48% by weight. Thus, the steam heated iron has to evaporate nearly 48% of water. This requires 62kg of steam. If, due to inefficient drying in the hydro-extractor, finishing sheets arrive at the iron with 52% moisture content, 52kg of water has to be evaporated; the steam quantity required is 67 kg. So, for the same quantity of finished product, the steam consumption increases by 8%. When steam reaches the place where its heating is required, it must be ensured that the steam has no more work to do than is absolutely necessary. Air–heater batteries, for example, which provide hot air for drying, will use the same amount of steam whether the plant is fully or partly loaded. So, if the plant is running only at 50% load, it is wasting twice as much steam (or twice as much fuel) as is necessary. By reducing work done by steam, energy saving can be achieved by the following measures: • Reduction in operating hours; • Reduction in steam quantity required per hour; • Use of more efficient technologies; • Avoiding part load operations; and • Minimizing wastage. 3.9.9 Proper utilization of directly injected steam Where feasible, the heating of a liquid by direct injection of steam is often desirable. The equipment required is relatively simple, cheap, and easy to maintain. No condensate recovery system is necessary. The heating is quick, and the sensible heat of the steam is used up along with the latent heat, making the process thermally efficient. If the dilution of the tank contents and agitation are not acceptable in the process (i.e., if direct steam agitation is not acceptable), indirect steam heating is the only answer. Ideally, the injected steam should be condensed completely as the bubbles rise through the liquid. This is possible if the inlet steam pressures are kept very low, around 0.5 kg/cm2 to 1.0 kg/cm2. If pressures are high, the velocity of the steam bubbles will also be high, and they will not have sufficient time condense before they reach the surface. A large number of small-diameter holes (2–5mm), facing downwards, may be drilled on the steam distributor pipe. This will help in dissipating the velocity of bubbles in the liquid. Adopting thermostatic control of steam admitted is highly desirable. - 30 -
  • 43.
    Energy Efficiency inSteam Distribution and Utilization 3.9.10 Proper air venting A 0.25mm thick air film offers the same resistance to heat transfer as a 330mm thick copper wall. The presence of air inside the process equipment will reduce the partial pressure of steam in the steam air mixture, thus dropping the overall temperature of the steam air mixture, which is the heating medium. However, it is impossible to avoid the entry of air into a steam system that is working intermittently. If the steam condenses during the shutdowns, air enters the process equipment from the steam mains at the time of startup. Adequate air venting provision should be made at appropriate positions in the pipelines, to purge air as quickly as possible from the equipment, making heat transfer more efficient. - 31 -
  • 44.
    4. ENERGY EFFICIENCYIN FURNACES 4.1 INTRODUCTION A furnace is a piece of equipment used to melt metal for casting or to heat materials in order to change their shape (rolling, forging, etc.) or their properties (heat treatment). 4.2 TYPES AND CLASSIFICATION OF FURNACES Furnaces can be broadly classified into three categories based on mode of heat transfer, mode of charging, and mode of heat recovery. The furnace classification is given in Figure 4-1. Figure 4-1 Furnace classification 4.3 CHARACTERISTICS OF AN EFFICIENT FURNACE A furnace should be designed so that in a given time, as much of the material as possible can be heated to as uniform a temperature as possible with the least possible fuel and labor. - 32 -
  • 45.
    Energy Efficiency inFurnaces 4.4 FURNACE ENERGY SUPPLY The products of flue gases directly contact the stock, so the type of fuel chosen is of importance. For example, some materials will not tolerate sulphur in the fuel. In addition, use of solid fuels will generate particulate matter, which may affect the stock placed inside the furnace. Hence, the majority of furnaces use liquid fuel, gaseous fuel, or electricity as energy input. Melting furnaces for steel and cast iron use electricity in induction and arc furnaces. Non-ferrous melting furnaces utilize oil as fuel. 4.5 OIL-FIRED FURNACES Furnace oil is the major fuel used in reheating and heat treatment furnaces. LDO is used in furnaces where the presence of sulphur is undesirable. Some furnaces operate with efficiencies as low as 7% as against up to 90% achieved in other combustion equipment such as boilers. Factors reducing efficiency include the high temperatures at which the furnaces have to operate, huge thermal masses, high exit flue gas temperatures, standing losses during soaking, partial load operations, losses due to lack of temperature controls, opening losses, delays in stock removal even after heating has been achieved, and others. For example, a furnace heating the stock to 1200 ºC will have its exhaust gases leaving at least at 1200ºC if no heat recovery is installed, resulting in a huge heat loss through the stack. 4.6 TYPICAL FURNACE SYSTEMS 4.6.1. Forging furnaces Forging furnaces use an open fireplace system, and most of the heat is transmitted by radiation. It is used for preheating billets and ingots to attain forging temperature. Thus, furnace temperature is maintained at 1200– 1250ºC. The typical loading in a forging furnace is 5 to 6 tons, with the furnace operating for 16 to 18 hours daily. The total operating cycle can be divided into (i) heat-up time (ii) soaking time, and (iii) forging time. Specific fuel consumption depends upon the type of material and number of such “reheats” required. - 33 -
  • 46.
    Training Manual onEnergy Efficiency for Small and Medium Enterprises Figure 4-2 Basic diagram of furnace operation 4.6.2 Rerolling mill furnaces i) Batch type furnaces Batch type furnaces are used for heating scrap, small ingots, and billets weighing 2–20 kg. For batch type rerolling, charging and discharging of the “material” is done manually, and the final product is in the form of rods, strips, etc. The operating temperature is 1200ºC. The total cycle time can be divided into heat-up time and rerolling time. ii) Continuous pusher type furnaces The process flow and operating cycles of a continuous pusher type of furnace is the same as that of a batch furnace. The operating temperature is 1250ºC. The material or stock recovers a part of the heat in flue gases as it moves down the length of the furnace. Heat absorption by the material in the furnace is slow, steady, and uniform throughout the cross-section compared with a batch type furnace. 4.7 PERFORMANCE EVALUATION OF A TYPICAL FURNACE A furnace heat balance will have the components shown in Figure 4-3. It can be seen that some of these losses do not exist in equipment like boilers, which is the reason why boilers are often much more efficient than furnaces. - 34 -
  • 47.
    Energy Efficiency inFurnaces Figure 4-3 Furnace efficiency Normal furnace losses include the following: • Heat storage in the furnace structure; • Losses from the furnace outside walls or structure; • Heat transported out of the furnace by the load conveyors, fixtures, trays; • Radiation losses from openings, hot exposed parts, etc.; • Heat carried by cold air infiltration into the furnace; and • Heat carried by the excess air used in the burners. 4.7.1 Furnace efficiency The efficiency of a furnace is the ratio of useful output to heat input. The furnace efficiency can be determined by both a direct and an indirect method. Direct method testing The efficiency of the furnace can be computed by measuring the amount of fuel consumed per unit weight of material produced from the furnace. Heat in the stock Thermal efficiency of the fumance= Heat in the fuel consumed The quantity of heat to be imparted (Q) to the stock can be found from the formula Q=mxCpx(t2-t1) - 35 -
  • 48.
    Training Manual onEnergy Efficiency for Small and Medium Enterprises where Q = Quantity of heat in kCal m = Weight of the material in kg Cp = Mean specific heat, in kCal/kgºC t2 = Final temperature desired, in ºC t1 = Initial temperature of the charge before it enters the furnace, in ºC Indirect method testing Similar to the method of evaluating boiler efficiency by indirect methods, furnace efficiency can also be calculated by an indirect method. Furnace efficiency is calculated after subtracting sensible heat loss in flue gas, loss due to moisture in flue gas, heat loss due to openings of the furnace, heat loss through the furnace skin, and other unaccounted losses from the input to the furnace. The parameters that must be taken into account in order to calculate furnace efficiency using the indirect method include hourly furnace oil consumption, material output, excess air quantity, temperature of flue gas, temperature of the furnace at various zones, skin temperature. and hot combustion air temperature. Efficiency is determined by subtracting all the heat losses from 100. Measurement parameters The following measurements should be made to calculate the energy balance in oil-fired reheating furnaces (e.g. heating furnaces): i) Weight of stock / Number of billets heated; ii) Temperature of furnace walls, roof, etc,; iii) Flue gas temperature; iv) Flue gas analysis; and v) Fuel oil consumption. Instruments like infrared thermometer, fuel consumption monitor, surface thermocouple and other measuring devices are required to measure the above parameters. Reference manuals should be referred to for data like specific heat, humidity, etc. 4.7.2 Useful data • In addition to conventional methods, Japanese Industrial Standard (JIS) GO 702: “Method of heat balance for continuous furnaces for steel” is used for the purpose of establishing the heat losses and efficiency of reheating furnaces. • Heat transfer by radiation is proportional to the absolute temperature to the power of 4. Consequently, the radiation losses increase exponentially as temperature increases. Table 4-1 illustrates the observation. - 36 -
  • 49.
    Energy Efficiency inFurnaces Table 4-1 Radiant heat loss comparison at various temperatures C1 C2 K1 K2 Relative (K1/K2)4 (ºC) (ºC) (C1 +273) (C2 +273) Radiant Heat Transfer 700 20 973 293 122 1.0 (baseline value) 900 20 1173 293 255 2.1 1100 20 1373 293 482 3.96 1300 20 1573 293 830 6.83 1500 20 1773 293 1340 11.02 1700 20 1973 293 2056 16.91 (Note: C1 is hot body temperature and C2 is ambient air temperature) In other words, the radiation losses from an open furnace door at 1500ºC are 11 times greater than the losses of the same furnace at 700ºC. A good practice for iron and steel melters is to keep the furnace lid closed at all times and maintain a continuous feed of cold charge onto the molten bath. 4.7.3 Determining black body radiation at a particular temperature If a furnace body has an opening, the heat in the furnace escapes to the outside as radiant heat. Heat loss due to openings can be calculated by computing black body radiation at furnace temperature, and multiplying these values by emissivity (usually 0.8 for furnace brick work), and the factor of radiation through openings. The black body radiation losses can be directly computed from the curves as given in Figure 4-4. Figure 4-4 Black body radiation - 37 -
  • 50.
    Training Manual onEnergy Efficiency for Small and Medium Enterprises Furnace utilization factor Utilization has a critical effect on furnace efficiency and is a factor that is often ignored or underestimated. If the furnace is at temperature, then standby losses occur whether or not a product is in the furnace. Standby losses Energy is lost from the charge or its enclosure in the forms of heat: (a) conduction, (b) convection; and/or (c) radiation. Furnace draft control Furnace pressure control has a major effect on fuel-fired furnace efficiency. Running a furnace at a slight positive pressure reduces air ingress and can increase its efficiency. Theoretical heat In the example of melting one ton of steel from an ambient temperature of 20ºC: Specific heat of steel = 0.186 Wh/kg/ºC. Latent heat for melting of steel = 40 Wh/kg/ºC. The melting point of steel = 1600 ºC. Theoretical total heat = Sensible heat + Latent heat Sensible heat = 1000 kg x 0.186 Wh/kgºC x (1600-20)ºC = 294 kWh/T Latent heat = 40 Wh/kg x 1000 kg = 40 kWh/T Total heat = 294 + 40 = 334 kWh/T So the theoretical energy needed to melt one ton of steel from 20ºC = 334 kWh. Actual energy used to melt to 1600ºC is 700 kWh. Efficiency = 334 kWh x 100 = 48% 700 kWh Typical furnace efficiency values for reheating and forging furnaces (as observed in few trials undertaken by an Energy Auditing Agency on such furnaces) are given in Tables 4-2 and 4-3. - 38 -
  • 51.
    Energy Efficiency inFurnaces Table 4-2 Pusher type billet reheating furnaces (for rolling mills) Furnace Specific Fuel Thermal Efficiency Capacity Consumption Achieved Upto 6 T/hr 40-45 Ltrs/ton 52% 7-8 T/hr 35-40 Ltrs/ton 58.5% 10-12 T/hr 33-38 Ltrs/ton 63% 15-20 T/hr 32-34 Ltrs/ton 66.6% 20 T/hr & above 30-32 Ltrs/ton 71% Table 4-3 Pusher type forging furnaces Furnace Specific Fuel Thermal Efficiency Capacity Consumption Achieved 500-600 kg/hr 80-90 Ltrs/ton 26% 1.0 T/hr 70-75 Ltrs/ton 30% 1.5-2.0 T/hr 65-70 Ltrs/ton 32.5% 2.5-3.0 T/hr 55-60 Ltrs/ton 38% The fuel consumption figures in the tables correspond to conditions when the furnaces were operating continuously at their rated capacity. Note: These are trial figures and cannot be presumed as standards for the furnaces concerned. - 39 -
  • 52.
    Training Manual onEnergy Efficiency for Small and Medium Enterprises 4.8 GENERAL FUEL ECONOMY MEASURES IN FURNACES 4.8.1 Combustion with minimum excess air To obtain complete combustion of fuel with the minimum amount of air, it is necessary to control air infiltration, maintain the pressure of combustion air, and monitor fuel quality and excess air. Higher excess air will reduce flame temperature, furnace temperature, and heating rate. A simple equation to calculate excess air from the percentage of oxygen in flue gases for any fuel in a combustion system is: % excess air = (% Oxygen)*100/ (21 – % Oxygen). On the other hand, if the excess air is reduced, then unburnt components in flue gases will increase and will be carried away in the flue gases through the stack. Therefore the optimization of combustion air is the most attractive and economical measure for energy conservation. The impact of this measure is higher when the temperature of the furnace is high. The amount of heat lost in the flue gases depends upon amount of excess air. In the case of a furnace carrying away flue gases at 900ºC, percentage of heat lost is shown in Table 4-4. Table 4-4 Heat loss in flue gas based on excess air level % of total heat in the fuel carried away Excess Air by waste gases (flue gas temp. 900ºC) 25 48 50 55 75 63 100 71 4.8.2 Correct heat distribution For proper heat distribution, when using oil burners, the following measures should be taken: i) Prevent flame impingement by aligning the burner properly to avoid touching the material. The flame should not touch any solid object and should propagate clear of any solid object. Any obstruction will disturb the atomized fuel particles, thus affecting combustion and creating black smoke. If flame impinges on the stock, there will be an increase in scale losses, which are often hidden in nature but precious in value. - 40 -
  • 53.
    Energy Efficiency inFurnaces ii) If the flames impinge on refractories, the incomplete combustion products can settle and react with the refractory constituents at high flame temperatures. iii) The flames of different burners in the furnace should stay clear of each other. If they intersect, inefficient combustion will occur. It is desirable to stagger the burners on the opposite sides. iv) The burner flame has a tendency to travel freely in the combustion space just above the material. In small reheating furnaces, the axis of the burner is never placed parallel to the hearth but always at an upward angle. Flames should not hit the roof. Figure 4-5 Burner alignment and heat distribution v) Designs with few large-capacity burners produce a long flame, which may be difficult to contain within the furnace walls. More burners of less capacity give a better distribution of heat in the furnace and also increase furnace life. vi) For small reheating furnaces, it is desirable to have a long flame with golden yellow color while firing furnace oil for uniform heating. The flame should not be so long that it enters the chimney and comes out through the top or through the doors. This will happen if excess oil is fired. In such cases, a major portion of additional fuel is carried away from the furnace. 4.9 FURNACE WASTE HEAT RECOVERY Since furnaces operate in high temperature domains; the stack temperatures are very high, and waste heat recovery is a major energy efficiency opportunity in furnaces. The recovered waste heat is conventionally used for either pre-heating of combustion air or to heat he material itself. - 41 -
  • 54.
    Training Manual onEnergy Efficiency for Small and Medium Enterprises Figure 4-6 Waste heat diagram 4.9.1 Some common waste heat recovery systems Simple double pipe type heat exchangers These generally take the form of concentric cylinders, in which the combustion air passes through the annulus and the exhaust gases from the furnace pass through the center. Such recuperators are very cheap to make, are suitable for use with dirty gases, have a negligible resistance to flow, and can replace the flue or chimney if space is limited. Figure 4-7 Heat exchanger - 42 -
  • 55.
    Energy Efficiency inFurnaces Convection recuperators Convection recuperators consist essentially of bundles of drawn or cast tubes. Internal and/or external fins can be added to assist with heat transfer. The combustion air normally passes through the tubes and the exhaust gases outside the tubes, but there are some applications where this is reversed. For example, with dirty gases, it is easier to keep the tubes clean if the air flows on the outside. Design variations include ‘U’ tube and double pass systems. Convection recuperators are more suitable for exhaust gas temperatures of less than about 900°C. Beyond 900ºC, ceramic recuperators can be used which can withstand higher temperatures. Figure 4-8 Convection recuperators Regenerative burners In regenerative burners, the heat of the gases is stored before they exit and incoming combustion air is preheated from this stored heat, switching between two chambers alternately. The cycle time is accurately controlled for switchover. Options include regenerative burners and regenerative air pre- heaters for heat recovery. - 43 -
  • 56.
    Training Manual onEnergy Efficiency for Small and Medium Enterprises Figure 4-9 Regenerative burners 4.9.2 Ceramic fiber for reducing thermal mass Thermal mass in a furnace contributes significantly to storage heat loss, especially in those batch furnaces with huge refractory brickwork. Every time the furnace goes through a heating cycle, the whole refractory mass needs to be heated all over. Introduction of ceramic fiber to replace conventional fire brick lining helps to reduce thermal mass to almost 15% of the original, helping to lower fuel consumption and batch time reduction as well. - 44 -
  • 57.
    Energy Efficiency inFurnaces Figure 4-10 Use of ceramic fiber 4.9.3 Ceramic coatings to improve emissivity Heat transfer in a furnace depends mainly on radiation, which in turn depends on emissivity. At higher temperatures, the emissivity decreases and is on the order of 0.3. High emissivity refractory coating, if applied on the internal surface of the furnace, increases the emissivity to 0.8, thus contributing to increased heat transfer. The application of high-emissivity coatings in furnace chambers promotes rapid and efficient transfer of heat, uniform heating, and extended life of refractories and metallic components such as radiant tubes and heating elements. For intermittent furnaces or where rapid heating is required, use of such coatings is found to reduce fuel consumption up to 10%. Other benefits are temperature uniformity and increased refractory life. 4.10 TIPS FOR IMPROVING ENERGY EFFICIENCY IN FURNACES General • Establish a management information system on loading, efficiency, and specific fuel consumption. • Prevent infiltration of air, using doors or air curtains. • Monitor O2/CO2/CO ratios and control excess air level. • Improve burner design, combustion control, and instrumentation. • Ensure that the furnace combustion chamber is under slight positive pressure. • Use ceramic fiber linings in the case of batch operations. • Match the load to the furnace capacity. • Retrofit with heat recovery devices. - 45 -
  • 58.
    Training Manual onEnergy Efficiency for Small and Medium Enterprises • Investigate cycle times and avoid extended hours of runtime and excess heating. • Provide temperature controllers. • Ensure that the flame does not touch the stock. Insulation • Repair damaged insulation. • Use an infrared gun to check for hot wall areas during hot weather. • Ensure that all insulated surfaces are clad with aluminum lining. • Insulate all flanges, valves, and couplings. Waste heat recovery • Recover maximum heat from flue gases. • Ensure upkeep of heating surfaces by regular cleaning. - 46 -
  • 59.
    5. ELECTRICAL LOADMANAGEMENT 5.1 INTRODUCTION In industrial type electricity billing, where mostly a two-part tariff is adopted, the consumer pays for two components: • For the maximum demand (kVA) recorded during billing duration; and • For the energy (kWh) consumed during billing duration. Electrical load management for a company involves measures to reduce maximum demand and to improve power factors so that the maximum demand charges are minimized. Energy consumption mainly relates to end-use equipment efficiency and can be reduced by various relevant measures. 5.2 MAXIMUM DEMAND BASICS Maximum demand charges relate to the fixed cost of capacity blocked to be provided for serving a consumer’s needs. A tri-vector meter installed at the consumer end records the maximum demand registered by a consumer during billing duration, apart from other important consumption features like active power (kWh), reactive power (kVarh), apparent power (kVah), and power factor (PF). At present many utilities have a “time of day tariff” in place, and charge a consumer variable rates for maximum demand drawn during different times of day. For instance, there could be lower rates for night hours when the utility is lightly loaded and higher rates during evening hours when utilities are stretched to meet maximum load demands. It would thus help to study the load curve patterns and, based on prevalent tariff structure provisions, optimize maximum demand to save on maximum demand charges. 5.2.1 Load curve of a plant From Figure 5-1, one can see that demand varies from time to time, due to the combination of users and consumption of electricity changing all the time. The demand is measured over a predetermined time interval and averaged out for the interval as shown by the horizontal dotted line. - 47 -
  • 60.
    Training Manual onEnergy Efficiency for Small and Medium Enterprises Figure 5-1 Maximum demand curve 5.2.2 MD recording It is important to note that while maximum demand is recorded, it is not the instantaneous demand drawn, as is often misunderstood, but rather is the time-integrated demand over the duration of the recording cycle. As example, in an industry, if the draw over a recording cycle of 30 minutes is: 2500 kVA for 4 minutes 3600 kVA for 12 minutes 4100 kVA for 6 minutes 3800 kVA for 8 minutes, Figure 5-2 Time-integrated demand - 48 -
  • 61.
    Electrical Load Management theMD recorder will be computing MD for the duration of 30 minutes as: (2500 x 4) + (3600 x 12) + (4100 x 6) + (3800 x 8) = 3606.7 kVA 30 5.3 LOAD MANAGEMENT STRATEGIES Various techniques applicable to optimize maximum demand of an industry include: • Rescheduling loads; • Staggering of motor loads; • Storage of products/in process material/process utilities like refrigeration; • Shedding of non-essential loads; • Operation of captive power generation; and • Reactive power compensation. 5.3.1 Rescheduling and staggering loads In Figure 5-3 the left side shows the demand curve of a consumer before load shifting, and the right side shows the demand curve of a unit after load shifting (leading to kVA reduction). Figure 5-3 Load shifting 5.3.2 Storage of products in process materials and process utilities like refrigeration In many plants, studies reveal extra capacity available, for producing certain products, in process material and utilities like pumps and refrigeration, all of which consume electricity. Using these capacities during lean demand - 49 -
  • 62.
    Training Manual onEnergy Efficiency for Small and Medium Enterprises durations like late night hours, the maximum demand during peak hours can be optimized. One example may be pumping and storing all water needs during off-peak hours in overhead tanks and reducing corresponding demand during peak hours. 5.3.3 How ice storage helps in demand control In order for 1kg of ice to form, about 80kcals must be rejected from water at 0ºC, and forming 38kg of ice will require around one TR of refrigeration. Thus, making ice during low peak demand night hours and using this stored refrigeration capacity during daytime helps to reduce corresponding peak demand. Dairy plants, pharmaceuticals, bulk drugs, and processing industries with massive refrigeration capacities can adopt refrigeration storage for MD control since every TR of load shifted means 1.2 to 2.5 kW per TR demand shifting. Figure 5-4 Using ice storage to reduce peak demand 5.4 POWER FACTOR (PF) IMPROVEMENT In most modern electrical distribution systems, the predominant loads are resistive and inductive. • Typical resistive loads are incandescent lighting and resistance heating. • Typical inductive loads are A.C. Motors, induction furnaces, transformers and ballast-type lighting. Inductive loads require two kinds of power: • Active (or working) power to perform the work (motion), and • Reactive power to create and maintain electromagnetic fields. - 50 -
  • 63.
    Electrical Load Management Figure 5-5 Maximizing capacity The vector sum of the active power and reactive power make up the total (or apparent) power used. This is the power to be supplied by the utility for meeting all active and reactive power needs of users and utility electrical generation and distribution systems are designed accordingly. Since it is only the active power or kilowatts that are of real use, there is an advantage in operating with a power factor close to unity—that is, drawing close to zero reactive power from the utility. In this way, the capacity of a utility electrical network can be optimally used, with minimum losses. In fact, the utilities penalize users for low power factors and sometimes incentivize high power factors at the user end, in their tariff structures. Installing and maintaining capacitors helps industry to balance the reactive power of inductive loads and to improve power factors at the user end, which also offers benefits of better voltage, reduced maximum demand, and lower distribution losses within the industry premises. Capacitor locations: For motors of 50 hp and above, it is best to install power factor correction capacitors at the motor terminals since distribution circuit loading is reduced. Figure 5-6 shows capacitor banks connected at the bus for each motor control centre. This compromise to Method 1 will reduce installation costs. The least expensive method shows capacitor banks connected at the service entrance. However, the disadvantage is that higher feeder currents still flow from the service entrance to the end-of-line equipment and will only benefit the utility in a real sense. - 51 -
  • 64.
    Training Manual onEnergy Efficiency for Small and Medium Enterprises Figure 5-6 Capacitor array PF improvement can significantly reduce distribution loads and maximum demand within the facility. As current flows through conductors, the conductors are heated up due to resistance property; this is called distribution loss. In industry this loss can be anywhere from less than 1% to as high as 6%. Distribution loss is proportional to square of current handled, which declines as the power factor is improved, especially at use end locations. % Loss Reduction = 100 x 1- (Original P.F.)2 (Desired P.F.)2 We know that active power is the product of apparent power and power factor; to reduce the maximum demand, it would help to keep the power factor close to unity. Reduced maximum demand charges are evaluated against investment for capacitors, for payback analysis. Tariff structure data and monthly bill analysis can help the utility to figure out cost benefits. For maximum demand optimization, it would be desirable to adopt automatic PF controls. - 52 -
  • 65.
    Electrical Load Management 5.4.1Example problem: If the maximum demand is 1500 kVA at 0.85 PF, calculate the reduction in demand with improved PF to 0.95, and work out the cost benefits of PF improvement. Active power kW which is being presently served = 1500 x 0.85 = 1275 New kVA for serving same 1275 kW of active power at 0.95 PF = 1275/0.95 = 1342 Reduction in maximum demand with higher PF =1500 kVA – 1342 kVA =158 kVA. At USD8 per kVA, MD reduction would help to reduce monthly demand charges by USD1264 or annual savings of USD15168. Applying relevant multiplying factor of 0.291 from following table, the kVAr rating works out to 371. The investment for capacitors @ USD6 per kVAr works out to USD2226. Against savings of USD15168 per annum, the measure thus offers a simple payback period of 0.15 years, a hugely attractive opportunity. - 53 -
  • 66.
    Training Manual onEnergy Efficiency for Small and Medium Enterprises Table 5-1 is useful for sizing capacitor banks. Table 5-1 Multipliers to determine capacitor KVAR required for power factor correction This table can be used for selecting capacitor ratings. Based on present Power Factor on Y axis and desirable Power Factor on X axis, this table gives the multiplying factor to be applied to measured kilowatt value, to arrive at the rating in kVAr of the capacitor to be installed. - 54 -
  • 67.
    Electrical Load Management 5.5TIPS FOR ENERGY-EFFICIENT ELECTRICAL LOAD MANAGEMENT • Review the tariff agreement with the utility supplier to meet requirements at optimum cost. • Balance kilowatt loads on three phases of supply. • Schedule plant operations to maintain a high load factor. • Shift loads to off-peak times where possible. • Minimize maximum demand by controlling loads through an automatic demand controller. • Stagger start-up times for equipment with large starting currents to minimize load peaking. • Use standby electric generation equipment for on-peak high load periods. • Correct power factor to well above 0.90 by installing additional capacitors and automatic power factor controllers, avoid motor under-load conditions, and take advantage of PF improvement incentives if any are available. • Ensure that all capacitors are in line and functional, by checking charging current. • Relocate transformers close to main loads. • Set transformer taps to optimum settings. • Disconnect primary power to transformers that do not serve any active loads. • Consider on-site captive generation or cogeneration as a cheaper/efficient alternative. • Export power to grid if there is any surplus in captive generation. • Periodically, calliberate the utility’s electricity meter with your own meter for accuracy. • Shut off unnecessary and idle process equipment, utilities, and office equipment like computers, printers, and copiers at night. - 55 -
  • 68.
    6. ENERGY EFFICIENCYIN ELECTRIC MOTORS 6.1 INTRODUCTION Motors convert electrical energy into mechanical energy by the interaction between the magnetic fields set up in the stator and rotor windings. Industrial electric motors can be broadly classified as induction motors, direct current motors, or synchronous motors. All motor types have the same four operating components: stator (stationary windings), rotor (rotating windings), bearings, and frame (enclosure). Squirrel cage induction motors account for over 90% of the population. Figure 6-1 Induction motor 6.2 SALIENT ASPECTS OF MOTOR PERFORMANCE Motor speed The speed of a motor is the number of revolutions in a given time frame, typically revolutions per minute (RPM). The synchronous speed in RPM is given by the following equation, where the frequency is in hertz or cycles per second: 120 x Frequency Synchronous Speed (RPM) = Poles It can also be shown that the speed of an AC motor can be varied infinitely by changing the frequency. The actual speed at which the motor operates will be less than the synchronous speed. The difference between synchronous and full load speed is called slip and is measured in as a percentage. It is calculated using the following equation: - 56 -
  • 69.
    Energy Efficiency inElectric Motors Slip (%) = Synchronous Speed-Full Load Speed x 100 Synchronous Speed Voltage frequency relation Impedance of an inductor is proportional to frequency. At low frequencies, this impedance approaches zero, making the circuit appear to be a short-circuit. To maintain a constant flux in the motor, the voltage to the motor must also be changed. This ratio is constant over most of the entire speed range By keeping the ratio constant, a fixed speed induction motor can be made to run at variable speed offering constant torque. At low speeds, due to the motor having inherent resistance in the windings, the ratio must be altered to provide enough magnetizing flux to spin the motor. The VFD allows this relationship to be altered by changing the voltage boost parameter. Figure 6-2 Boosting voltage Application of variable frequency drives and variable speed drives, for capacity control of pumps, fans, compressors, process control, as against other conventional methods, is the most relevant energy conservation opportunity in the electric motor industry. Load versus power factor As the load on the motor is reduced, the magnitude of the active current declines. However, there is not a corresponding reduction in the magnetizing current, with the result that the motor power factor declines, or gets worse, with a reduction in applied load. - 57 -
  • 70.
    Training Manual onEnergy Efficiency for Small and Medium Enterprises Figure 6-3 Load and power Motor efficiency versus load Output Input−Losses 746×HP Output Efficiency = ×100 = ×100 = ×100 Input Input Watts Input Electric motors are electromagnetic energy converters whose function is based on the force exerted between electrical currents and magnetic fields, which are usually electrically excited as well. Due to their principle of functioning, electric motors have a relatively high efficiency. A typical efficiency value for an 11 kW standard motor is around 90%, for 100 kW, up to 94%. The efficiency levels of large motors are higher than those of smaller motors. It should be noted that peak efficiency occurs at about 75% loading and drops significantly when loading is below about 30%. 6.3 THE TYPES OF MOTOR LOSS Core losses: Core loss is around 22% of total loss at full load. Core losses represent the energy required to magnetize the core material (hysteresis) and are expended by small electric currents that flow in the core (eddy currents). Core loss of a motor is constant and is independent of the motor load current, and thus it accounts for a much higher percentage of the losses at low motor loads. Stator and rotor resistance losses: Loss due to stator and rotor resistance is about 56% of total loss at full load. It occers due to the current flow (I) through the motor conductors of resistance (R). Loss is proportional to the square of the stator and rotor current and is also called I2R loss; it is influenced largely by loading on motor. - 58 -
  • 71.
    Energy Efficiency inElectric Motors Friction and windage losses: Loss due to friction and wind represents about 11% of total loss at full load. This loss results from friction within the shaft bearings and from the resistance to air being circulated through the motor by cooling fans. It depends on bearing quality and condition to a great extent. Stray load losses: Stray load loss is about 11% of total loss at full load. Stray load loss results from leakage of magnetic flux, and depends on the rotor slot design. Like I2R losses, it is dependent on the square of the load current and tends to increase with motor load. 6.4 ENERGY EFFICIENCY OPPORTUNITIES IN MOTORS Two approaches, namely a systems approach and operational measures, can be adopted for energy efficiency improvements in motors. 6.4.1 Systems approach The key to systematic or large energy savings in motors involves several fundamental procedures: • Switching off equipment when not needed. • Providing energy-efficient capacity controls (variable frequency drives or VFDs) instead of throttling. • Process re-engineering for reducing work done. 6.4.2 Operational measures Operational measures for energy efficiency include the following: Maintain voltage close to rating: Although motors are designed to operate within 10% of nameplate voltage, large variations significantly reduce efficiency, power factor, and service life. When operating at less than 95% of design voltage, motors typically lose 2 to 4 points of efficiency, and service temperatures increase up to 20ºF, greatly reducing insulation life. Running a motor above its design voltage also reduces power factor and efficiency. - 59 -
  • 72.
    Training Manual onEnergy Efficiency for Small and Medium Enterprises Figure 6-4 Voltage variation effect on motor performance Minimize phase imbalance: The voltage of each phase in a three-phase system should be of equal magnitude, symmetrical, and separated by 120°. Phase balance should be within 1% to avoid derating of the motor. Several factors can affect voltage balance: single-phase loads on any one phase, different cable sizing, or faulty circuits. An unbalanced system increases distribution system losses and reduces motor efficiency. Voltage imbalance is defined as 100 times the maximum deviation of the line voltage from the average voltage on a three-phase system divided by the average voltage. If line voltages measured are 431, 438, and 427, the average is 432. The voltage imbalance is given by 432-427 ×100 = 1.1% 432 Minimize rewind losses: Rewinding can reduce motor efficiency and reliability. A rewind-versus-replace decision is quite complicated and depends on such variables as the rewind cost, expected rewind loss, energy-efficient motor purchase price, motor size and original efficiency, load factor, annual operating hours, electricity price, and others. The majority of users would wish to rewind the motor rather than - 60 -
  • 73.
    Energy Efficiency inElectric Motors replace it, because it is a cheaper option; but the disadvantage is that there is not much quality assurance. During a motor failure, or in the stripping of the winding from the stator core prior to rewinding, heating involved causes exposure to high temperatures. These temperatures can, in many cases, affect the electrical characteristics of the stator core steel and result in increased iron losses and lower motor efficiency. The only area of possible loss reduction available during the rewinding process is the copper (l2r) losses in the motor. Reduction is achieved by rewinding the motor with a larger-diameter wire so that the effective conductor area is increased, where slot area permits, resulting in a lower winding resistance. The effect is to lower the stator copper loss. Rewinding for lower copper losses is possible only if additional slot space is available in the original stator slot, often released by use of new, higher class of insulating material replacing older, lower grade insulation. It follows that not all motors are candidates for efficiency improvement by rewinding. Many industries operate with a population of 40%–50% rewound motors, and it would be useful to evaluate all such motors and introduce a phasing- out program and a quality assurance program for motor efficiency based on measurement of load losses, stator resistance values, etc. Optimize transmission efficiency: Motor power transmission equipment, including shafts, belts, chains, and gears, should be properly installed and maintained. When possible, use flat belts in place of V-belts. Helical gears are more efficient than worm gears; use worm gears only with motors under 10hp. As far as possible, it is better to have a direct drive, thus avoiding losses in the transmission system. Operate motors loaded in star mode: When a delta motor is connected in star mode, the voltage across the windings is reduced with a corresponding reduction in flux produced, current drawn, and torque produced; in essence, the motor is de-rated electrically, with least cost. Star mode operation is applicable as an energy-saving opportunity with motors loaded to less than 50% of rating, as a low-cost alternative to replacement. Use soft starters for induction motors: AC induction motors are frequently used at fixed speeds, and the overwhelming majority of these are powered by direct on-line (DOL) starters and Star Delta starters which are characterized by jerky startup operations, high transient currents, maximum demand surges, and possible damage to motor windings and insulation. Soft starters use electronic controls, PLC, to gradually increase the voltage applied to the motor, starting slowly and limit start up currents. Since voltage is reduced, current also comes down, and there is reduction in iron and copper losses. Power factor is improved as the reactive current is reduced due to lower flux strength requirements, which in turn results in a higher power factor. (The starting current with a soft starter - 61 -
  • 74.
    Training Manual onEnergy Efficiency for Small and Medium Enterprises is only 1.5 to 2 times the full load current as against 5–7 times in the case of other conventional starters). With soft starters, cable sizes, contactors, and motors can be sized lower during the initial selection. Figure 6-5 Effect of energy-saving operation Conduct a motor load survey and performance assessment: A motor load survey is a very useful audit step to bring out saving opportunities in electric motors. The steps involved are: Inventory and list all motors by plant, department, and type of equipment, using an hour basis. Document all name plate data. Measure run values of input power parameters, alongside machine side parameters. Document and record the following: 1. Cases of repeated motor burnout. 2. Motors with high no-load losses. 3. Percentage of motors loading in kW as against rated input kW. 4. Occurrences of voltage unbalance, low power factor, loose connections, and low terminal voltage. 5. Occurrences of any mechanical problems like slippages, local heating, vibration, mis-alignment, poor ventilation, and dusty conditions. 6. Machine-side inefficiencies like idle operations, throttling of pumps, damper operations in fans, leakages, etc. Research candidate areas for VFD application for energy efficiency. The margins in motor efficiency may often be less than 5% of consumption, but the load survey can help to make changes in driven machines or systems, which can yield 30%–40% energy savings. - 62 -
  • 75.
    Energy Efficiency inElectric Motors 6.5 TIPS FOR ENERGY EFFICIENCY IN MOTORS AND DRIVES • Properly size to the load for optimum efficiency. (High-efficiency motors offer 4%–5% higher efficiency than standard motors.) • Use energy-efficient motors where economical. • Use synchronous motors to improve power factor. • Check alignment. • Provide proper ventilation. (For every 10ºC increase in motor operating temperature over the recommended peak, the motor life is estimated to be halved.) • Check for under-voltage and over-voltage conditions. • Balance the three-phase power supply. (An umbalanced voltage can reducemotor input power by 3%–5%.) • Demand efficiency restoration after motor rewinding. (If rewinding is not done properly, the efficiency can be reduced by 5%–8%.) Drives: • Use variable-speed drives for large variable loads. • Use high-efficiency gear sets. • Use precision alignment. • Check belt tension regularly. • Eliminate variable-pitch pulleys. • Use nylon sandwich type energy efficient flat belts as alternatives to old v-belts. • Eliminate inefficient couplings. • Shut them off when not needed adopting interlocks, controls. - 63 -
  • 76.
    7. ENERGY EFFICIENCYIN PUMPS 7.1 PUMP CHOICES Pumps come in a variety of sizes for a wide range of applications. They can be classified, according to their basic operating principle, as dynamic or displacement pumps. Dynamic pumps can be sub-classified as centrifugal and special effect pumps. Displacement pumps can be sub-classified as rotary or reciprocating pumps. In principle, any liquid can be handled by any of the pump designs. Where different pump designs could be used, the centrifugal pump is generally the most economical, followed by rotary and reciprocating pumps. Although positive displacement pumps are generally more efficient than centrifugal pumps, the benefit of higher efficiency tends to be offset by increased maintenance costs. 7.2 CENTRIFUGAL PUMPS IN BRIEF A centrifugal pump has a very simple design, as shown in Figure 7-1. The two main parts of the pump are the impeller and the diffuser. The impeller, which is the only moving part, is attached to a shaft and driven by a motor. Impellers are generally made of bronze, polycarbonate, cast iron, or stainless steel, as well as other materials. The diffuser (also called a volute) houses the impeller and captures and directs the water off the impeller. Figure 7-1 Design of centrifugal pump - 64 -
  • 77.
    Energy Efficiency inPumps Water enters the center (eye) of the impeller and exits the impeller with the help of centrifugal force. As water leaves the eye of the impeller a low-pressure area is created, causing more water to flow into the eye. Atmospheric pressure and centrifugal force cause this to happen. Velocity is developed as the water flows through the impeller, which is spinning at high speed. The water velocity is collected by the diffuser and converted to pressure by specially designed passageways that direct the flow to the discharge of the pump, or to the next impeller should the pump have a multi-stage configuration. The pressure (head) that a pump will develop is in direct relationship to the impeller diameter, the number of impellers, the size of the impeller eye, and the shaft speed. Capacity is determined by the exit width of the impeller. The head and capacity are the main factors that affect the horsepower size of the motor to be used. The greater the quantity of water to be pumped, the more energy is required. 7.3 SYSTEM CHARACTERISTICS In a pumping system, the objective, in most cases, is either to transfer a liquid from a source to a required destination (e.g. filling a high-level reservoir) or to circulate liquid around a system (e.g. as a means of heat transfer in heat exchanger). Head losses Pressure is needed to make the liquid flow at the required rate, and this pressure must overcome head “losses” in the system. Losses are of two types: static head and friction head. Static head is simply the difference in height of the supply and destination reservoirs, as shown on the left side in Figure 7-2. In this illustration, flow velocity in the pipe is assumed to be very small. Another example of a system with only static head is pumping into a pressurized vessel with short pipe runs. Static head is independent of flow and graphically would be shown as on the right side in Figure 7-2. Figure 7-2 Static head - 65 -
  • 78.
    Training Manual onEnergy Efficiency for Small and Medium Enterprises Friction head (sometimes called dynamic head loss) is the loss due to friction on the liquid being moved, in pipes, valves, and equipment in the system. Friction tables are universally available for various pipe fittings and valves. These tables show friction loss per 100 feet (or meters) of a specific pipe size at various flow rates. In the case of fittings, friction is stated as an equivalent length of pipe of the same size. The friction losses are proportional to the square of the flow rate. A closed loop circulating system, without a surface open to atmospheric pressure, would exhibit only friction losses and would have a system friction head loss vs. flow curve as shown in Figure 7-3. Figure 7-3 Friction head Most systems have a combination of static and friction head, and the system curves for the two cases are shown in Figures 7-4 and 7-5. The ratio of static to friction head over the operating range influences the benefits achievable from variable speed drives. - 66 -
  • 79.
    Energy Efficiency inPumps Figure 7-4 System with high static head Figure 7-5 System with low static head Static head is a characteristic of the specific installation, and reducing this head where it is possible generally reduces both the cost of the installation and the cost of pumping the liquid. Friction head losses must be minimized to reduce pumping cost, but after eliminating unnecessary pipe fittings and length, further reduction in friction head will require a larger-diameter pipe, which adds to installation cost. - 67 -
  • 80.
    Training Manual onEnergy Efficiency for Small and Medium Enterprises Pump operating point When a pump is installed in a system, the effect can be illustrated graphically by superimposing pump and system curves. The operating point will always be where the two curves intersect, as shown in Figure 7-6. Figure 7-6 Pump operating point It is ideal if the operating duty point of a pump is close to the design best efficiency point, which implies that careful attention is needed in sizing the pump for an application, as oversizing would lead to reduced operational efficiency. - 68 -
  • 81.
    Energy Efficiency inPumps 7.4 TYPICAL PUMP CHARACTERISTIC CURVES Figure 7-7 Pump operating curves Pump operating curves as shown in Figure 7-7 relate to the head, flow, and efficiency values that can be obtained with various impellor diameter choices. The same analogy can also be applied for obtaining speed variation conditions. Pump efficiency is linked to specific speed of the pump, and the above curves indicate constant efficiency attributes, also called iso-efficiency curves, at different head flow combinations. Once the the specific speed (which depends on head, flow, and RPM of a pump) is known, achievable pump efficiency can be predicted from standard curves. 7.5 FLOW CONTROL METHODS AND ENERGY EFFICIENCY 7.5.1 Flow control by valve control With the valve control method, the pump runs continuously, and a valve in the pump discharge line is opened or closed to adjust the flow to the required value. - 69 -
  • 82.
    Training Manual onEnergy Efficiency for Small and Medium Enterprises Figure 7-8 Valve control method As shown in Figure 7-8, with the valve fully open, the pump operates at ‘Flow 1.’ When the valve is partially closed it introduces an additional friction loss in the system, which is proportional to flow squared. The new system curve cuts the pump curve at ‘Flow 2,’ which is the new operating point. The head difference between the two curves is the pressure drop across the valve. It is usual practice with valve control to have the valve 10% shut, even at maximum flow. Energy is therefore wasted overcoming the resistance through the valve at all flow conditions. There is some reduction in pump power absorbed at the lower flow rate, but the flow multiplied by the head drop across the valve is wasted energy. It should also be noted that, while the pump will accommodate changes in its operating point as far as it is able within its performance range, it can be forced to operate high on the curve, where its efficiency is low, and its reliability is affected. Maintenance cost of control valves can be high, particularly with corrosive and solids-containing liquids. Therefore, the lifetime cost could be unnecessarily high. 7.5.2 Bypass control With the bypass control approach, the pump runs continuously at the maximum process demand level, with a permanent bypass line attached to the outlet. When a lower flow is required, the surplus liquid is bypassed and returned to the supply source. - 70 -
  • 83.
    Energy Efficiency inPumps An alternative configuration may have a tank supplying a varying process demand, which is kept full by a fixed-duty pump running at the peak flow rate. Most of the time the tank overflows and recycles back to the pump suction. This is even less energy-efficient than a control valve because there is no reduction in power consumption with a reduction in process demand. The small bypass line sometimes installed to prevent a pump running at zero flow is not a means of flow control, but is required for the safe operation of the pump. 7.5.3 Fixed flow reduction by impeller trimming Impeller trimming refers to the process of machining the diameter of an impeller to reduce the energy added to the system fluid, and it offers a useful correction to pumps that, through overly conservative design practices or changes in system loads, are oversized for their application. Trimming an impeller provides a lesser level of correction than buying a smaller impeller from the pump manufacturer. In many cases, the next smaller size impeller is too small for the pump load. Also, smaller impellers may not be available for the pump size in question, and impeller trimming is the only practical alternative short of replacing the entire pump/motor assembly. Impeller trimming reduces tip speed, which in turn directly lowers the amount of energy imparted to the system fluid and lowers both the flow and pressure generated by the pump (see Figure 7-9). Figure 7-9 Impeller trimming to reduce flow - 71 -
  • 84.
    Training Manual onEnergy Efficiency for Small and Medium Enterprises The Affinity Laws, which describe centrifugal pump performance, provide a theoretical relationship between impeller size and pump output (assuming constant pump speed): where Q = flow H = head BHP = brake horsepower of the pump motor Subscript 1 = original pump, Subscript 2 = pump after impeller trimming D = diameter D2 Q2 = Q1 D1 2 D2 H2 = H1 D1 3 D2 BHP2 = BHP1 D1 Trimming an impeller changes its operating efficiency, and the non- linearities of the Affinity Laws with respect to impeller machining complicate the prediction of pump performance. Consequently, impeller diameters are rarely reduced below 70% of their original size. 7.5.4 Meeting variable flow needs by speed reduction Pump speed adjustments provide the most efficient means of controlling pump flow. When pump speed is reduced, less energy is imparted to the fluid and less energy needs to be throttled or bypassed. There are two primary methods of reducing pump speed: multiple-speed pump motors and variable speed drives (VSDs). Although both directly control pump output, multiple-speed motors and VSDs serve entirely separate applications. Multiple-speed motors contain a different set of windings for each motor speed; consequently, they are more expensive and less efficient than single-speed motors. Multiple-speed motors also lack subtle speed-changing capabilities within discrete speeds. VSDs allow pump speed adjustments over a continuous range, avoiding the need to jump from speed to speed as with multiple-speed pumps. VSDs control pump speeds using several different types of mechanical and electrical systems. Mechanical VSDs include hydraulic clutches, fluid couplings, and adjustable belts and pulleys. Electrical VSDs include eddy current clutches, wound-rotor motor controllers, and variable frequency drives (VFDs). VFDs adjust the electrical frequency of the power supplied to a motor to change the motor’s rotational speed. VFDs are by far the most popular type of VSD. - 72 -
  • 85.
    Energy Efficiency inPumps However, pump speed adjustment is not appropriate for all systems. In applications with high static head, slowing a pump risks inducing vibrations and creating performance problems that are similar to those found when a pump operates against its shutoff head. For systems in which the static head represents a large portion of the total head, caution should be used in deciding whether to use VFDs. Operators should review the performance of VFDs in similar applications and consult VFD manufacturers to avoid the damage that can result when a pump operates too slowly against high static head. 7.6 PUMP PERFORMANCE ASSESSMENT The steps in assessing pump performance are as follows: 1. Select the pump or pumping station for which the audit/assessment is being carried out. 2. Collect specifications, design/performance guarantee test data, pump characteristic curves, and schematic diagrams of the pumping system. 3. Collect maintenance history and records of existing problems (if any) in the system. 4. Check the availability and functionality of various online and portable instruments to be used for observations during the trials. 5. Observations should be made by running the pumps in different combinations (if the pumps are connected in parallel). 6. Take an overall perspective of the pumping system comprising pumps, motors, coupling, suction/discharge valves, piping, flanges, pump seals/ glands, etc., in order to check the general health of the pumping system: for example, note noticeable leakages of process fluid, thermal insulation deterioration if the fluid handled is hot or cold. 7. Carry out power measurements of pumps. In the absence of power analyzer/energy meter, use a tong tester and estimate power consumption from current, volts values. 8. Measure fluid flow (if available directly) or make arrangements to measure fluid flow by the tank filling method. Otherwise, estimate fluid flow by measuring suction pressure, discharge pressure, and power input, and use pump characteristic curves. 9. Perform calculations to draw conclusions based on the following parameters (formulae given in APO’s Energy Audit Manual): • Calculate combined efficiency of pump and motor. • Estimate of fluid flow (if flow is not measured directly). • Calculate specific power consumption (kWh/M3). • Compare above values with performance guarantee/design values. If there is large variation, look for areas for improvement. • Suggest measures for energy savings. - 73 -
  • 86.
    Training Manual onEnergy Efficiency for Small and Medium Enterprises Table 7-1 Calculating pump energy efficiency 1 Energy consumption (P) in kW = 3VI Cos Φ Combined efficiency of pump and M×9.81×TDH (mWC) ×100 motor (%) = P 2 Where P = power input (kW) m = fluid flow (m3/Sec) TDH = Total differential head (mWC) Pump efficiency = Combined efficiency×100 3 motor efficiency Fluid flow (m3/hr) = (P) (ηp) (ηm) (3600) (TDH) (9.81) 4 Where ηp = pump efficiency ηm = motor efficiency Specific power consumption = Power consumption (kWh) 5 (m3/hr) fluid flow 10. Towards further diagnostics, one may conduct a shut-off head trial (maximum one-minute duration) to ensure that the discharge valve is fully closed and not passing. If head corresponds to less than 90%–95% of name plate value, look for pump internal problems like: • Gland seal leaking, • Shaft misalignment, • Impeller pitting or wearing out, • Casing wearing out, or • Bearing wearing out. 11. Based on existing pump efficiency, evaluate cost benefits for: • Pump replacement with higher efficiency pump or • Impeller replacement. 12. Based on % margins available on flow, head, motor input kW, and process demand variation, evaluate cost benefits for application of: • Variable speed drives, • Impeller size optimization, or • Smaller multi pump application. 13. Evaluate cost benefits of pipe size and pumping network optimization on both suction side and discharge side. 14. Identify the scope for improving NPSH and suction-side improvements like high-efficiency foot valves, high-efficiency strainers, and seamless pipelines. - 74 -
  • 87.
    Energy Efficiency inPumps 7.7 TIPS FOR ENERGY CONSERVATION IN PUMPING SYSTEMS 1. Ensure adequate NPSH at site of installation. Site NPSH should always be higher than required NPSH. 2. Ensure availability of basic instruments at pumps like pressure gauges and flow meters. 3. Operate pumps near their best efficiency point. 4. Restore internal clearances if performance has changed. 5. Shut down unnecessary pumps. 6. Modify pumping system and pump losses to minimize throttling. 7. Adapt to wide load variation with variable speed drives or sequenced control of multiple units. 8. Stop running multiple pumps; add an auto-start for an available spare or add a booster pump where needed. 9. Use booster pumps for small loads requiring higher pressures. 10. Increase fluid temperature differentials to reduce pumping rates in case of heat exchangers. 11. Repair seals and packing to minimize water loss by dripping. 12. Balance the system to minimize flows and reduce pump power requirements. 13. Avoid pumping head with a free-fall return (gravity); use siphon effect to advantage: 14. Optimize the number of stages in a multi-stage pump in case of head margins. 15. Reduce system resistance by pressure drop assessment and pipe size optimization. - 75 -
  • 88.
    8. ENERGY EFFICIENCYIN FANS 8.1 INTRODUCTION Fans and blower s pr ovide air for ventilation and industrial pr ocess requirements. Fans generate a pressure to move air (or gases) against resistance caused by ducts, dampers, or other components in a fan system. The fan rotor receives energy from a rotating shaft and transmits it to the air as pressure energy. Figure 8-1 Basic diagram of a fan Difference between fans, blowers, and compressors: Fans, blowers, and compressors are differentiated by the method used to move the air, and by the system pressure they must operate against. As per the American Society of Mechanical Engineers (ASME), the specific ratio—the ratio of the discharge pressure over the suction pressure—is used for fans, blowers, and compressors. Accordingly, fans offer a pressure rise up to 1136 mmWg, blowers offer from 1136 to 2066 mmWg, and compressors offer pressure rises even higher than blowers. 8.2 FAN TYPES Fans fall into two general categories: centrifugal flow and axial flow. In centrifugal flow, airflow changes direction twice: once when entering the fan and again when leaving (forward-curved, backward-curved or -inclined, and radial types). In axial flow, air enters and leaves the fan with no change in direction (propeller, tube axial, vane axial). - 76 -
  • 89.
    Energy Efficiency inFans Figure 8-2 Types of fans The major types of centrifugal fan by type of impellors adopted are radial forward curved and backward curved: Radial fans are industrial workhorses because of their high static pressures (up to 1400mm WC) and ability to handle heavily contaminated airstreams. Because of their simple design, radial fans are well suited for high temperatures and medium blade tip speeds. Forward-curved fans are used in clean environments and operate at lower temperatures. They are well suited for low tip speed and high-airflow work: they are best suited for moving large volumes of air against relatively low pressures. Backward-inclined fans are more efficient than forward-curved fans. Backward-inclined fans reach their peak power consumption and then power demand drops off well within their usable airflow range. Backward-inclined fans are known as “non-overloading” because changes in static pressure do not overload the motor. - 77 -
  • 90.
    Training Manual onEnergy Efficiency for Small and Medium Enterprises Figure 8-3 Types of fan blades The major types of axial flow fans are tube axial, vane axial, and propeller: Tube axial fans have a wheel inside a cylindrical housing, with close clearance between blade and housing to improve airflow efficiency. The wheels turn faster than propeller fans, enabling operation under high pressures of 250–400mm WC. The efficiency is up to 65%. Vane axial fans are similar to tube axial fans, but with the addition of guide vanes that improve efficiency by directing and straightening the flow. As a result, they have a higher static pressure with less dependence on the duct static pressure. Such fans are used generally for pressures up to 500mm WC. Vane axial are typically the most energy-efficient fans available and should be used whenever possible. Propeller fans usually run at low speeds and moderate temperatures. They experience a large change in airflow with small changes in static pressure. They handle large volumes of air at low pressure or free delivery. Propeller fans are often used indoors as exhaust fans. Outdoor applications include air- cooled condensers and cooling towers. Application choices for fans are summarized in Table 8-1. Table 8-1 Types of fans, characteristics, and typical applications Centrifugal Fans Type Characteristics Typical Applications Radial High pressure, medium Various industrial flow; efficiency close applications; suitable for to that of tube-axial dust-laden, moist air/ fans; power increases gases continuously (Continued on next page) - 78 -
  • 91.
    Energy Efficiency inFans ( ... Continued) Forward-curved Medium pressure, high Low-pressure HVAC, blades flow, dip in pressure packaged units, suitable for curve; efficiency higher clean and dust-laden air/ than radial fans; power gases rises continuously Backward-curved High pressure, high flow, HVAC, various industrial blades high efficiency; power applications, forced draft reduces as flow increases fans, etc. beyond point of highest efficiency Airfoil type Same as backward- Same as backward-curved curved type; highest type, but for clean air efficiency applications Axial-flow Fans Type Characteristics Typical Applications Propeller Low pressure, high Air circulation, ventilation, flow, low efficiency; exhaust peak efficiency close to point of free air delivery (zero static pressure) Tube-axial Medium pressure, high HVAC, drying ovens, flow, higher efficiency exhaust systems than propeller type, dip in pressure-flow curve before peak pressure point. Vane-axial High pressure, medium High-pressure applications flow, dip in pressure- including HVAC systems, flow curve; use of exhausts guide vanes improves efficiency 8.3 SYSTEM RESISTANCE The term “system resistance” is used when referring to the static pressure. The system resistance is the sum of static pressure losses in the system. System resistance is a function of the configuration of ducts, pickups, and elbows, and the pressure drops across equipment—for example, a bag filter or cyclone. The system resistance varies with the square of the volume of air flowing through the system. For a given volume of air, the fan in a system with narrow ducts and multiple short radius elbows is going to have to work - 79 -
  • 92.
    Training Manual onEnergy Efficiency for Small and Medium Enterprises harder to overcome a greater system resistance than it would in a system with larger ducts and a minimum number of long radius turns. Long narrow ducts with many bends and twists will require more energy to pull the air through them. Consequently, for a given fan speed, the fan will be able to pull less air through this system than through a short system with no elbows. Thus, the system resistance increases substantially as the volume of air flowing through the system increases. Conversely, resistance decreases as flow decreases. To determine what volume the fan will produce, it is therefore necessary to know the system resistance characteristics. In existing systems, the system resistance can be measured. In systems that have been designed, but not built, the system resistance must be calculated. Typically a system resistance curve is generated for various flow rates on the x-axis and the associated resistance on the y-axis. Figure 8-4 System resistance 8.4 FAN PERFORMANCE ASSESSMENT Fans are tested for field performance by measurement of air flow, head (pressure developed, also sometimes called draft), and temperature on the fan side and electrical motor kW input on the motor side. 8.4.1 Air flow measurement Static pressure: Static pressure is the potential energy put into the system by the fan. It is given up to friction in the ducts, and at the duct inlet as it is converted to velocity pressure. At the inlet to the duct, the static pressure produces an area of low pressure Velocity pressure: Velocity pressure is the pressure along the line of the flow that results from the air flowing through the duct. The velocity pressure is used to calculate air velocity. - 80 -
  • 93.
    Energy Efficiency inFans Total pressure: Total pressure is the sum of the static and velocity pressure. Velocity pressure and static pressure can change as the air flows though different size ducts while accelerating, but the total pressure stays constant, changing only with friction losses. The fan flow is measured using Pitot tube manometer combination or a flow sensor (differential pressure instrument) or an accurate anemometer. Care must be taken regarding number of traverse points in a straight length section (to avoid turbulent flow regimes of measurement) upstream and downstream of measurement location. The measurements can be on the suction or discharge side of the fan, and preferably both where feasible. Measurement by Pitot tube: Total pressure is measured using the inner tube of the Pitot tube, and static pressure is measured using the outer tube of the Pitot tube, as indicated in Figure 8-5. When the inner and outer tube ends are connected to a manometer, we get the velocity pressure. For measuring low velocities, it is preferable to use an inclined tube manometer instead of a U tube manometer. Figure 8-5 Pitot tube measurement 8.4.2 Velocity pressure/velocity calculation When measuring velocity pressure, the duct diameter (or the circumference from which to calculate the diameter) should be measured as well. This will allow us to calculate the velocity and the volume of air in the duct. In most cases, pressure (head) must be measured at several places in the same system. A typical format is presented in Table 8-2. - 81 -
  • 94.
    Training Manual onEnergy Efficiency for Small and Medium Enterprises Table 8-2 Measurements of air flow Duct Static Pressure Cross- Temp. of Air at Duct Dynamic Head (dp) at 10 Points along Pitot-tube in Duct at sectional Measurement Ref. Duct Diameter/Length or Width Constant Measurement Area Point (ºC) Point (mmWC) (M2) 1 2 3 4 5 6 7 8 9 10 • The velocity pressure varies across the duct. Friction slows the air near the duct walls, so the velocity is greater in the center of the duct. The velocity is affected by changes in the ducting configuration such as bends and curves. The best place to take measurements is in a section of duct that is straight for at least 3–5 diameters after any elbows, branch entries, or duct size changes. • To determine the average velocity, it is necessary to take a number of velocity pressure readings across the cross-section of the duct. The velocity should be calculated for each velocity pressure reading, and the average of the velocities should be used. Do not average the velocity pressure; average the velocities. • For best results, one set of readings should be taken in one direction and another set at a 90º angle to the first. For square ducts, the readings can be taken in 16 equally spaced areas. If it is impossible to traverse the duct, an approximate average velocity can be calculated by measuring the velocity pressure in the center of the duct and calculating the velocity. This value is reduced to an approximate average by multiplying by 0.9. - 82 -
  • 95.
    Energy Efficiency inFans 8.4.3 Air density calculation The first calculation is to determine the density of the air. To calculate the velocity and volume from the velocity pressure measurements it is necessary to know the density of the air. The density is dependent on altitude and temperature: 273x1.293 Gas Density(γ)= 273+tºC where tºC – temperature of gas/air at site condition. 8.4.4 Velocity calculation Once the air density and velocity pressure have been established, the velocity can be determined from the equation: Cp x 2×9.81×Δp×γ Velocity v, m/s= γ where Cp = Pitot tube constant, 0.85 (or) as given by the manufacturer; p = Average differential pressure measured by Pitot tube by taking measurement at number of points over the entire cross section of the duct; γ = Density of air or gas at test condition. 8.4.5 Volume calculation The volume in a duct can be calculated for the velocity using the equation: Volumetric flow(Q),m3/sec = Velocity(m/sec)xArea(m2) 8.4.6 Fan efficiency Fan manufacturers generally use two ways to mention fan efficiency: mechanical efficiency (sometimes called total efficiency) and static efficiency. Both measure how well the fan converts horsepower into flow and pressure. The equation for determining mechanical efficiency is: Fan Mechanical Efficiency(ηmechanical),% Valumein m3/sec*Δp(total pressure) in mmWC = x100 102*power input to fan shaft in kW The static efficiency equation is the same except that the outlet velocity pressure is not added to the fan static pressure: Fan Static Efficiency(ηStatic),% Valumein m3/sec*Δp(static pressure) in mmWC = x100 102*power input to fan shaft in kW - 83 -
  • 96.
    Training Manual onEnergy Efficiency for Small and Medium Enterprises Drive motor kW can be measured by a load analyzer. This kW multiplied by motor efficiency gives the shaft power to the fan. For analysis, the reported parameters are: • Actual flow and % loading w.r.t rated flow; • Actual head and % loading w.r.t rated head; • Actual motor kW and % loading w.r.t rated input; • As run efficiency w.r.t. rated efficiency of fan; • Damper settings on suction or discharge side observed. 8.5 ENERGY SAVINGS OPPORTUNITIES The energy efficiency strategy in fan systems includes establishing a system curve accurately, selecting the correct operating point of the fan and matching it with the best efficiency point, selecting the fan with highest efficiency for the application, achieving energy-efficient capacity controls, and adopting good O &M practices. 8.5.1 Flow control strategies and energy conservation Typically, once a fan system is designed and installed, the fan operates at a constant speed. There may be occasions when a speed change is desirable, e.g., when adding a new run of duct that requires an increase in air flow (volume) through the fan. There are also instances when the fan is oversized and flow reductions are required. Various ways to achieve change in flow are: pulley change, damper control, inlet guide vane control, variable speed drives, and series and parallel operation of fans. Damper controls: Some fans are designed with damper controls. Dampers can be located at inlet or outlet. Dampers provide a means of changing air volume by adding or removing system resistance. This resistance forces the fan to move up or down along its characteristic curve, generating more or less air without changing fan speed. However, dampers provide a limited amount of adjustment, and they are not energy-efficient. Pulley change: When a fan volume change is required on a permanent basis, and the existing fan can handle the change in capacity, the volume change can be achieved with a speed change. The simplest and cheapest one-time way to change the speed is with a pulley change. For this, the fan must be driven by a motor through a V-belt system. The fan speed can be increased or decreased with a change in the drive pulley or the driven pulley or, in some cases, both pulleys. This method is normally applicable for de-rating, where a fan is oversized and damper operation (which is inefficient) is observed at all times. - 84 -
  • 97.
    Energy Efficiency inFans Inlet guide vanes: Inlet guide vanes are another mechanism that can be used to meet variable air demand. Guide vanes are curved sections that lie against the inlet of the fan when they are open. When they are closed, they extend out into the air stream. As they are closed, guide vanes pre-swirl the air entering the fan housing. This changes the angle at which the air is presented to the fan blades, which in turn changes the characteristics of the fan curve. Guide vanes are energy-efficient for modest flow reduction from 100% flow to about 80%. Below 80% flow, energy efficiency drops sharply. Axial-flow fans can be equipped with variable pitch blades, which can be hydraulically or pneumatically controlled to change blade pitch while the fan is at stationary. Variable-pitch blades modify the fan characteristics substantially and thereby provide dramatically higher energy efficiency than the other options. Variable speed drives: Although variable speed drives are expensive, they provide almost infinite variability in speed control. Variable speed operation involves reducing the speed of the fan to meet reduced flow requirements. Fan performance can be predicted at different speeds using the fan laws. Since power input to the fan changes as the cube of the flow, this will usually be the most efficient form of capacity control. However, variable speed control may not be economical for systems which have infrequent flow variations. When considering variable speed drive, the efficiency of the control system (fluid coupling, eddy-current, VFD, etc.) should be accounted for in the analysis of power consumption. Energy efficiency is achieved through right selection of flow control methods. Comparison of various volume control methods with respect to consumption (%) of required power is shown in Figure 8-6. Figure 8-6 Power consumption of volume control methods - 85 -
  • 98.
    Training Manual onEnergy Efficiency for Small and Medium Enterprises All the methods of capacity control presented above have turn-down ratios (ratio of maximum to minimum flow rate) determined by the amount of leakage (slip) through the control elements. For example, even with dampers fully closed, the flow may not be zero due to leakage through the damper. In the case of variable-speed drives the turn-down ratio is limited by the control system. In many cases, the minimum possible flow will be determined by the characteristics of the fan itself. Stable operation of a fan requires that it operate in a region where the system curve has a positive slope and the fan curve has a negative slope. The range of operation and the time duration at each operating point also serves as a guide to selection of the most suitable capacity control system. Outlet damper control, with its simplicity, ease of operation, and low investment cost, is the most prevalent form of capacity control. However, it is the most inefficient of all methods and is best suited for situations where only small, infrequent changes are required (for example, minor process variations due to seasonal changes). The economic advantage of one method over another is determined by the time duration over which the fan operates at different operating points. The frequency of flow change is another important determinant. For systems requiring frequent flow control, damper adjustment may not be convenient. Indeed, in many plants, dampers are not easily accessible and are left at some intermediate position, to avoid frequent control. The energy savings potential in fans and fan systems is maximized by reducing the loading on flow and head, eliminating inefficient capacity controls, and adopting need-based replacements for efficiency margins. These are summarized as type A, B, and C categories, as follows: 1. Minimizing excess air level in combustion systems to reduce forced draft fan and induced draft fan power consumption. (A) 2. Minimizing air in-leaks in hot flue gas path to reduce ID fan load, especially in kilns, boiler plants, furnaces, etc. Cold air in-leaks increase ID fan load tremendously, due to density increase of flue gases and in- fact choke up the capacity of fan, resulting in a bottleneck for the boiler/ furnace itself. (A) 3. In-leaks/out-leaks in air conditioning systems also have a major impact on energy efficiency and fan power consumption and need to be minimized. (A) 4. The findings of fan performance assessment trials will indicate potential areas for improvement, which could be one or more of the following: 4.1. Replacement of impeller by a high-efficiency impeller along with a cone. (C) 4.2. Replacement of fan assembly as a whole by a higher-efficiency fan. (C) 4.3. Downsizing as needed by impeller de-rating (replacement with a smaller- diameter impeller). (B) 4.4 Replacement of a metallic/glass-reinforced plastic (GRP) impeller by the more energy-efficient hollow FRP impeller with aerofoil design, in case of axial flow fans, where significant savings have been reported. (C) - 86 -
  • 99.
    Energy Efficiency inFans 4.5. Fan speed reduction by pulley diameter modification for one-time de- rating. (C) 4.6. Option of two-speed motors or variable speed drives for variable duty conditions. (B) 4.7. Option of energy-efficient flat belts, or cogged raw edged V belts, in place of conventional V-belt systems, for reducing transmission losses. (C) 4.8. Adopting inlet guide vanes in place of discharge damper controls. (B) 4.9. Minimizing system resistance and pressure drops by improvements in duct system like larger ducts for lowering pressure drop, etc. (A) 4.10. Use of smooth, well-rounded air inlet cones for fan air intakes. (A) 4.11. Minimizing fan inlet and outlet obstructions. (A) - 87 -
  • 100.
    9. ENERGY EFFICIENCYIN COMPRESSED AIR SYSTEMS 9.1 INTRODUCTION Air compressors account for significant amounts of the electricity used in industries. Air compressors are used in a variety of industries to supply process requirements, to operate pneumatic tools and equipment, and to meet instrumentation needs. Only 10%–30% of energy reaches the point of end- use; the remaining 70%–90% of energy of the power of the prime mover is converted to unusable heat energy and to a lesser extent is lost in the form of friction, misuse, and noise. Figure 9-1 Losses in air compressor systems 9.2 COMPRESSOR TYPES Compressors are broadly classified as positive displacement compressors and dynamic compressors. Positive displacement compressors increase the pressure of the gas by reducing the volume. Positive displacement compressors are further sub- classified as reciprocating or rotary compressors. Dynamic compressors increase the air velocity, which is then converted to increased pressure at the outlet. Dynamic compressors are basically centrifugal compressors and are further classified as radial and axial flow types. The choice among types of compressors available is shown in Figure 9-2. They are distinctive by method of operation and have well-established niche areas of selection/application in industry. - 88 -
  • 101.
    Energy Efficiency inCompressed Air Systems Figure 9-2 Types of compressors available A simple selection help tool is shown in Figure 9-3. (Cfm stands for cubic feet output per minute, a well-accepted term in compressor systems.) Figure 9-3 Compressor selection ratios - 89 -
  • 102.
    Training Manual onEnergy Efficiency for Small and Medium Enterprises 9.3 COMPRESSED AIR SYSTEM COMPONENTS Compressed air systems consist of the following major components: intake air filters, inter-stage coolers, after-coolers, air dryers, moisture drain traps, receivers, piping network, filters, regulators, and lubricators. Intake air filters prevent dust from entering the compressor. Dust causes sticking valves, scoured cylinders, excessive wear, etc. Inter-stage coolers reduce the temperature of the air before it enters the next stage to reduce the work of compression and increase efficiency. They are normally water-cooled. After-coolers work to remove the moisture in the air by reducing the temperature in a water-cooled heat exchanger. Air dryers: The traces of moisture remaining after the application of after-coolers are removed using air dryers, as air for instruments and pneumatic equipment has to be free of any moisture. The moisture is removed using adsorbents like silica gel/activated carbon, refrigerant dryers, or heat from compression dryers. Table 9-1 Adsorbents used to dry air Power Type Dew Point (ºC) Consumption (kW/1000 m3/hr) Desiccant Regeneratives –40 20.7 (Air purging) Desiccant Regeneratives –40 18 (Blowing) Desiccant Regeneratives –40 12 (Heat of compression) Refrigerants –20 2.9 (Drying) Moisture drain traps: Moisture drain traps are used for removal of moisture in the compressed air. These traps resemble steam traps. The types of traps used include manual drain cocks, timer-based automatic drain valves, etc. Receivers: Air receivers are provided for storage and smoothening of pulsating air output, reducing variations in pressure of air from the compressor. - 90 -
  • 103.
    Energy Efficiency inCompressed Air Systems 9.4 COMPRESSOR PERFORMANCE 9.4.1 Capacity of a compressor Capacity of a compressor is the full rated volume of flow of gas compressed and delivered at conditions of total temperature, total pressure, and composition prevailing at the compressor inlet. It sometimes means actual flow rate, rather than rated volume of flow. This is also termed Free Air Delivery (FAD)—i.e., air at atmospheric conditions at any specific location. Because the altitude, barometer, and temperature may vary at different localities and at different times, it follows that this term does not mean air under identical or standard conditions. 9.4.2 Compressor efficiency definitions Adiabatic and isothermal efficiencies are computed as the isothermal or adiabatic power divided by the actual power consumption. The figure obtained indicates the overall efficiency of compressor and drive motor. Isothermal compression is close to ideal, and with inter and after coolers, the work of compression is optimized with resulting power economy. Isothermal efficiency Isothermal power Isothermal Efficiency= Actual measured input power Isothermal power (kW) = P1 x Q1 x loger/36.7 where P1 = Absolute intake pressure kg/ cm2 Q1 = Free air delivered m3/hr. r = Pressure ratio P2/P1 The calculation of isothermal power does not include the power needed to overcome friction and generally gives an efficiency that is lower than adiabatic efficiency. The reported value of efficiency is normally the isothermal efficiency. This is an important consideration when selecting compressors based on reported values of efficiency. As an easy reference, indicative specific power consumption values for various compressor types are presented in Figure 9-4. - 91 -
  • 104.
    Training Manual onEnergy Efficiency for Small and Medium Enterprises Figure 9-4 Power consumption values for compressors 9.5 SHOP FLOOR METHODS FOR ASSESSMENT AND FACTORS AFFECTING ENERGY EFFICIENCY 9.5.1 Compressor capacity assessment Due to aging of the compressors and inherent inefficiencies in the internal components, the free air delivered may be less than the design value, despite good maintenance practices. Sometimes other factors such as poor maintenance, fouled heat exchangers, and effects of altitude also tend to reduce free air delivery. In order to meet the air demand, an inefficient compressor may have to run for a longer time, thus consuming more power than is actually required. The power wastage depends on the deviation of FAD capacity. For example, a worn-out compressor valve can reduce the compressor capacity by as much as 20%. A periodic assessment of the FAD capacity of each compressor has to be carried out to check its actual capacity. If the deviations are more than 10%, corrective measures should be taken to rectify the situation. The ideal method of compressor capacity assessment is through a nozzle test wherein a calibrated nozzle is used as a load, to vent out the generated compressed air. Flow is assessed based on the air temperature, stabilization pressure, and orifice constant. 9.5.2 Simple method of capacity assessment on the shop floor 1. Isolate the compressor along with the individual receiver being tested from the main compressed air system by tightly closing the isolation valve or blanking it, thus closing the receiver outlet. 2. Open the water drain valve, drain the water fully, and empty the receiver and the pipeline. Make sure that water trap line is tightly closed once again to start the test. 3. Start the compressor and activate the stopwatch. 4. Note the time taken to attain the normal operational pressure P2 (in the receiver) from initial pressure P1. The capacity is calculated as per the formula given below: - 92 -
  • 105.
    Energy Efficiency inCompressed Air Systems Actual free air discharge P2-P1 V Q= × Nm3/Minute P0 T where P2 = Final pressure after filling (kg/cm2 a) P1 = Initial pressure (kg/cm2a) after bleeding P0 = Atmospheric pressure (kg/cm2 a) V = Storage volume in m3 which includes receiver, after-cooler, and delivery piping T = Time taken to build up pressure to P2 in minutes The above equation is relevant where the compressed air temperature is the same as the ambient air temperature, i.e., perfect isothermal compression. In case the actual compressed air temperature at discharge, t2ºC is, higher than ambient air temperature t1ºC (as is usual), the FAD is to be corrected by a factor (273 + t1) / (273 + t2). 9.5.3 Simple method of leak quantification on the shop floor 1. Shut off compressed air operated equipment (or conduct the test when no equipment is using compressed air). 2. Run the compressor to charge the system to set pressure of operation. 3. Note the subsequent time taken for “load” and “unload” cycles of the compressors. For accuracy, take ON & OFF times for 8–10 cycles continuously. Then calculate total “ON” Time (T) and total “OFF” time (t). The system leakage is calculated as: % leakage = T × 100 / (T + t) (or) System leakage (m3/minute) = Q × T / (T + t) where Q = Actual free air being supplied during trial, in cubic meters per minute (cmm) T = Time on load in minutes t = Time on unload in minutes - 93 -
  • 106.
    Training Manual onEnergy Efficiency for Small and Medium Enterprises 9.5.4 Importance of maintenance for power consumption Table 9-2 Maintenance factors affecting power consumption S. Excess Power Maintenance Factor No. Consumption (%) 1 Worn-out pistons and gland packing 3–5% 2 Worn-out valves 5–6% 3 Misaligned bearings 1–3% 4 Wrong grade oil 1% 5 Choked filter 3-5% 6 High cooling water temperature 1% 7 Loose Belts 4-6% 9.6 ENERGY EFFICIENCY OPPORTUNITIES IN COMPRESSED AIR SYSTEMS • Ensure that air intake to compressor is not warm and humid by locating compressors in a well-ventilated area or by drawing cold air from outside. Every 4ºC rise in air inlet temperature will increase power consumption by 1%. • Clean air-inlet filters regularly. Compressor efficiency will be reduced by 2% for every 250mm WC pressure drop increase across the filter. (A compressor is a breathing machine.) • Keep compressor valves in good condition by removing and inspecting them once every six months. Worn-out valves can reduce compressor efficiency by as much as 50%. • Install manometers across the filter and monitor the pressure drop as a guide to scheduled maintenance and replacement of elements. • Minimize low-load compressor operation; if air demand is less than 50% of compressor capacity, consider changing to a smaller compressor or reducing compressor speed appropriately (by reducing motor pulley size), in case of belt-driven compressors. • Consider the use of regenerative air dryers, which use the heat of compressed air to remove moisture. • Fouled inter-coolers reduce compressor efficiency and cause more water condensation in air receivers and distribution lines, resulting in increased corrosion. Periodic cleaning of inter-coolers must be ensured. - 94 -
  • 107.
    Energy Efficiency inCompressed Air Systems • Compressor free air delivery test (FAD) must be done periodically to check the present operating capacity against its design capacity, and corrective steps must be taken if required. • If more than one compressor is feeding to a common header, compressors must be operated in such a way that only one small compressor handles the load variations, while other compressors operate at full load. • The possibility of heat recovery from hot compressed air to generate hot air or water for process application must be economically analyzed, in cases of large compressors. • Consideration should be given to buying a two-stage or multi-stage compressor as it consumes less power for the same air output than a single-stage compressor. • If pressure requirements for processes are widely different (e.g. 3 bar to 7 bar), it is advisable to have two separate compressed air systems. • Reduce compressor delivery pressure, wherever possible, to save energy. • Provide extra air receivers at points of high cyclic-air demand, which permits operation without extra compressor capacity. • Retrofit with variable speed drives in big compressors (say over 100 kW) to eliminate the ‘unloaded’ running condition altogether. • Maintain the minimum possible range between load and unload pressure settings. • Automatic timer-controlled drain traps waste compressed air every time the valve opens. So frequency of drainage should be optimized. • Trans-vector nozzles are to be used for low and intermediate pressure air requirements at user points. These nozzles draw a small quantity of motive air at higher pressure and mix it with ambient air, to produce compressed air at intermediate pressure, in an efficient manner, as against routine valve control method. • Check air compressor logs regularly for abnormal readings, especially motor current cooling water flow and temperature, inter-stage and discharge pressures, and temperatures and compressor load-cycles. • Compressed air leakage of 40%–50% is not uncommon. Carry out periodic leak tests to estimate the quantity of leakage. • Install equipment interlocked solenoid cut-off valves in the air system so that air supply to a machine can be switched off when it is not in use. • Present energy prices justify liberal designs of pipeline sizes to reduce pressure drops. • Compressed air piping layout should be made preferably as a ring main to provide desired pressures for all users. • A smaller dedicated compressor can be installed at load point, located far away from the central compressor house, instead of supplying air through lengthy pipelines. - 95 -
  • 108.
    Training Manual onEnergy Efficiency for Small and Medium Enterprises • All pneumatic equipment should be properly lubricated, which will reduce friction and prevent wear of seals and other rubber parts, thus preventing energy wastage due to excessive air consumption or leakage. • Misuse of compressed air, such as for body cleaning, agitation, general floor cleaning, and other similar applications, must be discouraged in order to save compressed air and energy. • Pneumatic equipment should not be operated above the recommended operating pressure as this not only wastes energy but can also lead to excessive wear of equipment components which leads to further energy wastage. • Pneumatic transport can be replaced by a mechanical system as the former consumes about 8 times more energy than the latter. • Pneumatic tools such as drill and grinders consume about 20 times more energy than motor-driven tools. Hence, they have to be used efficiently. Wherever possible, they should be replaced with electrically operated tools. • Where possible, welding is a good practice and should be preferred over threaded connections. • On account of high pressure drop, ball or plug or gate valves are preferable to globe valves in compressed air lines. 9.7 GENERIC TIPS FOR EFFICIENT USE OF COMPRESSORS • Install a control system to coordinate multiple air compressors. • Study part–load characteristics and cycling costs to determine the most efficient mode for operating multiple air compressors. • Avoid over-sizing: match the connected load. • Avoid partial loading on modulation-controlled air compressors. (They use almost as much power at partial load as at full load.) • Turn off the back-up air compressor until it is needed. • Reduce air compressor discharge pressure to the lowest acceptable setting. (Reduction of 1 kg/cm2 air pressure (8 kg/cm2 to 7 kg/cm2) would result in 9% input power savings. This will also reduce compressed air leakage rates by 10%.) • Use the highest reasonable dryer dew point settings. • Turn off refrigerated and heated air dryers when the air compressors are off. • Use a control system to minimize heatless desiccant dryer purging. • Minimize purges, leaks, excessive pressure drops, and condensation accumulation. - 96 -
  • 109.
    Energy Efficiency inCompressed Air Systems (Compressed air leak from 1mm hole size at 7 kg/cm2 pressure would mean power loss equivalent to 0.5 kW.) • Use drain controls instead of continuous air bleeds through the drains. • Consider engine-driven or steam-driven air compression to reduce electrical demand charges. • Replace standard V-belts with high-efficiency flat belts as the old V-belts wear out. • Take air compressor intake air from the coolest (but not air-conditioned) location. (Every 5ºC reduction in intake air temperature will result in a 1% reduction in compressor power consumption.) • Use an air-cooled after-cooler to heat building makeup air in winter. • Be sure that heat exchangers are not fouled (e.g. with oil). • Be sure that air/oil separators are not fouled. • Monitor pressure drops across suction and discharge filters, and clean or replace filters promptly upon increase in pressure drop. • Use a properly sized compressed air storage receiver. Minimize disposal costs by using lubricant that is fully demulsible and an effective oil–water separator. • Consider alternatives to compressed air such as blowers for cooling, hydraulic rather than air cylinders, electric rather than air actuators, and electronic rather than pneumatic controls. • Use nozzles or Venturi-type devices rather than blowing with open compressed air lines. • Check for leaking drain valves on compressed air filter/regulator sets. Certain rubber-type valves may leak continuously after they age and crack. Replacement is the best choice. • In dusty environments, control packaging lines with high-intensity photocell units instead of standard units with continuous air purging of lenses and reflectors. • Establish a compressed air efficiency-maintenance program. Start with an energy audit and follow-up, then make a compressed air efficiency- maintenance program a part of your continuous energy management program. - 97 -
  • 110.
    10. ENERGY EFFICIENCYIN REFRIGERATION SYSTEMS 10.1 INTRODUCTION Refrigeration deals with the pumping out of heat, from a low-temperature heat source to a high-temperature heat sink, by using a low boiling temperature refrigerant. The cooling effect produced is quantified in tons of refrigeration. 1 ton of refrigeration = 3024 kCal/hr heat rejected (pumped out) 10.2 TYPES OF APPLICATIONS Depending on applications, there are several options/combinations available for use, as listed below: • Air conditioning (for human comfort/machines) using Split air conditioners Fan coil units in a larger system Air handling units in a larger system • Small capacity modular units of direct expansion type similar to domestic refrigerators, small capacity refrigeration units. • Centralized chilled water plants, with chilled water as a secondary coolant for temperature range over 5ºC typically. They can also be used for ice bank formation. • Brine plants, which use brines as low-temperature secondary coolant, for typically sub-zero temperature applications, which come as modular unit capacities as well as large centralized plant capacities. • The plant capacities up to 50 TR are usually considered as small capacity, 50–250 TR as medium capacity and over 250 TR as large capacity units. • A large industry may have a bank of such units, often with common chilled water pumps, condenser water pumps, cooling towers, as an off-site utility. • A large industry may also have two or three levels of refrigeration & air conditioning such as: Comfort air conditioning (20º–25ºC) Chilled water system (8º–10ºC) Brine system (sub-zero applications) - 98 -
  • 111.
    Energy Efficiency inRefrigeration Systems 10.3 TYPES OF REFRIGERATION PLANTS 10.3.1 Vapor compression type Heat flows naturally from a hot to a colder body. In a refrigeration system, the opposite must occur: i.e., heat flows from a cold to a hotter body. This is achieved by using a refrigerant, which absorbs heat and hence boils or evaporates at a low pressure to form a gas. This gas is then compressed to a higher pressure, such that it transfers the heat it has gained to ambient air or water and turns it back (condenses it) into a liquid. In this way heat is absorbed, or removed, from a low temperature source and transferred to a higher temperature source. Figure 10-1 Vapor compression refrigeration 10.3.2 Vapor absorption type The absorption chiller is a machine which produces chilled water by using heat such as steam, hot water, gas, oil, etc. Chilled water is produced by the principle that liquid (refrigerant), which evaporates at low temperature, absorbs heat from its surroundings when it evaporates. Pure water is used as refrigerant and lithium bromide solution is used as absorbent. Heat for the vapor absorption refrigeration system can be provided by waste heat extracted from process, diesel generator sets, etc. Absorption systems require electricity only to run the pumps. Depending on the temperature required and the power cost, it may even be economical to generate heat or steam to operate the absorption system. - 99 -
  • 112.
    Training Manual onEnergy Efficiency for Small and Medium Enterprises Figure 10-2 Vapor absorption refrigeration 10.4 PERFORMANCE ASSESSMENT Specific power consumption, kW/TR, is a useful indicator of the performance of a refrigeration system. By measuring refrigeration duty performed in TR and the kW input, kW/TR is brought out as a performance indicator and used as a reference energy performance indicator. The refrigeration TR is assessed as TR = Q ×Cp × (Ti – To) / 3024 where TR is cooling TR effect produced Q is mass flow rate of coolant in kg/hr Cp is coolant specific heat in kCal/kg/ºC Ti is inlet temperature of coolant to evaporator (chiller) in ºC To is outlet temperature of coolant from evaporator (chiller) in ºC Power consumption In a centralized chilled water system, apart from the compressor unit, power is also consumed by the chilled water (secondary) coolant pump as well as the condenser water (for heat rejection to cooling tower) pump and cooling tower fan in the cooling tower. Effectively, the overall energy consumption would be towards: • Compressor kW • Chilled water pump kW - 100 -
  • 113.
    Energy Efficiency inRefrigeration Systems • Condenser water pump kW • Cooling tower fan kW • kW/TR of refrigeration plant = sum of all above kW/TR In field performance assessment, accurate instruments for inlet and outlet chilled water temperature and condenser water temperature measurement are required, preferably with a least count of 0.1ºC. Flow measurements of chilled water can be made by an ultrasonic flow meter directly or inferred from pump duty parameters. Adequacy check of chilled water is often needed, and most units are designed for a typical 0.68 m3/hr per TR (3 gpm/TR) chilled water flow. Condenser water flow measurement can also be made by a non-contact flow meter directly or inferred from pump duty parameters. Adequacy check of condenser water is also often needed, and most units are designed for a typical 0.91 m3/hr per TR (4 gpm/TR) condenser water flow. In case of air conditioning units, the air flow at the Fan Coil Units (FCU) or the Air Handling Units (AHU) can be measured with an anemometer. Dry bulb and wet bulb temperatures are measured at the inlet and outlet of AHU or the FCU, and the refrigeration load in TR is assessed as Q×p×(hin-hout) TR= 3024 where Q is the air flow in m3/h p is density of air kg/m3 h in is enthalpy of inlet air kCal/kg h out is enthalpy of outlet air kCal/kg Use of psychometric charts can help to calculate hin and hout from dry bulb and wet bulb temperature values, which are measured during trials. Power measurements at compressors, pumps, AHU fans, and cooling tower fans can be accomplished by a portable load analyzer. Estimation of process air conditioning load is also possible, by calculating various heat loads (sensible and latent), based on inlet and outlet air parameters, air ingress factors, air flow, occupancy pattern, and type of materials stored. An indicative TR load profile for comfort air conditioning is presented as follows: • Small office cabins = 0.1 TR/m2 • Medium-size offices, i.e., = 0.06 TR/m2 10–30 person occupancy with central A/C • Large multistoried office = 0.04 TR/ m2 complexes with central A/C - 101 -
  • 114.
    Training Manual onEnergy Efficiency for Small and Medium Enterprises 10.5 OPERATIONAL FACTORS AFFECTING PERFORMANCE AND ENERGY EFFICIENCY OF REFRIGERATION PLANTS 10.5.1 Design of process heat exchangers There is a tendency with most of the process units to operate with high safety margins, which influences the compressor suction pressure/evaporator set point. For instance, a process cooling requirement of 15 ºC would need chilled water at a lower temperature, but the coolant temperature range can vary from 6ºC to perhaps 10ºC. At 10ºC chilled water temperature, the refrigerant side temperature has to be lower, perhaps –5 ºC to +5 ºC. The refrigerant temperature again sets the corresponding suction pressure of the refrigerant, which determines the inlet duty conditions for work of compression of the refrigerant compressor. Having the optimum/minimum driving force (temperature difference) can, thus, help to achieve the highest possible suction pressure at the compressor, thereby leading to lower energy requirements. This requires proper sizing of heat transfer areas of process heat exchangers and evaporators as well as rationalizing the temperature requirement to highest possible value. A 1ºC raise in evaporator temperature can help to save almost 3% on power consumption. The TR capacity of the same machine will also increase with the evaporator temperature, as given in Table 10-1. Table 10-1 Effect of variation in evaporator temperature on compressor power consumption Evaporator Refrigeration Specific Power Increase in Temperature Capacity* Consumption kW/ton (%) (ºC) (tons) 5.0 67.58 0.81 - 0.0 56.07 0.94 16.0 -5.0 45.98 1.08 33.0 -10.0 37.20 1.25 54.0 -20.0 23.12 1.67 106.0 * Condenser temperature 40ºC In rationalizing the heat transfer areas, the heat transfer coefficient on the refrigerant side can be considered to range from 1400–2800 watts/m2K. The refrigerant side heat transfer areas provided are of the order of 0.5 Sqm/TR and above in evaporators. Condensers in a refrigeration plant are critical equipment that influences the TR capacity and power consumption demands. Given a refrigerant, the condensing temperature and corresponding condenser pressure depends upon - 102 -
  • 115.
    Energy Efficiency inRefrigeration Systems the heat transfer area provided, thw effectiveness of heat exchange, and the type of cooling chosen. A lower condensing temperature and pressure, in the best of combinations, would mean that the compressor has to work between a lower pressure differential as the discharge pressure is fixed by the design and performance of the condenser. The choices of condensers in practice include air-cooled, air-cooled with water spray, and heat exchanger-cooled. Generously sized shell and tube heat exchangers as condensers, with good cooling tower operations, help to operate with low discharge pressure values, and the TR capacity of the refrigeration plant also improves. With the same refrigerant, R22, a condensing pressure of 15 kg/cm2 is achieved with a water-cooled shell and tube condenser, and 20 kg/cm2 is achieved with an air-cooled condenser, which indicates that almost 30% additional energy consumption is required by the plant if one selects the air-cooled version. One of the best options at the design stage would be to select generously sized (0.65 m2/TR and above) shell and tube condensers with water-cooling as against cheaper alternatives like air-cooled condensers or water spray atmospheric condenser units. The effect of condenser temperature on refrigeration plant energy requirements is given in Table 10-2. Table 10-2 Effect of variation in condenser temperature on compressor power consumption Specific Condensing Refrigeration Power Increase in kW/ Temperature Capacity (tons) Consumption TR (%) (ºC) (kW/TR) 26.7 31.5 1.17 - 35.0 21.4 1.27 8.5 40.0 20.0 1.41 20.5 * Reciprocating compressor using R-22 refrigerant. Evaporator temperature.-10ºC 10.5.2 Maintenance of heat exchanger surfaces After ensuring procurement, effective maintenance holds the key to optimizing power consumption. Heat transfer can also be improved by ensuring proper separation of the lubricating oil and the refrigerant, timely defrosting of coils, and increasing the velocity of the secondary coolant (air, water, etc.). However, increased velocity results in larger pressure drops in the distribution system and higher power consumption in pumps and fans. Therefore, careful analysis is required to determine the most effective and efficient option. Fouled condenser tubes force the compressor to work harder, to attain the desired capacity. For example, a 0.8mm scale build-up on condenser tubes can increase energy consumption by as much as 35%. Similarly, fouled evaporators (due to residual lubricating oil or infiltration of air) result in increased power - 103 -
  • 116.
    Training Manual onEnergy Efficiency for Small and Medium Enterprises consumption. Equally important is proper selection, sizing, and maintenance of cooling towers. A reduction of 0.55ºC temperature in water returning from the cooling tower reduces compressor power consumption by 3.0 % (see Table 10-3). Table 10-3 Effect of poor maintenance on compressor power consumption Specific Evap. Cond. Refrigeration Increase Power Condition Temp Temp Capacity* in kW/Ton Consumption (ºC) (ºC) (tons) (%) (kW/ton) Normal 7.2 40.5 17.0 0.69 - Dirty 7.2 46.1 15.6 0.84 20.4 condenser Dirty 1.7 40.5 13.8 0.82 18.3 evaporator Dirty condenser 1.7 46.1 12.7 0.96 38.7 and evaporator * 15-ton reciprocating compressor-based system. The power consumption is lower than that for systems typically available in India. However, the percentage change in power consumption is indicative of the effect of poor maintenance. 10.5.3 Multi-staging for efficiency Efficient compressor operation requires that the compression ratio be kept low, to reduce discharge pressure and temperature. For low-temperature applications involving high compression ratios, and for wide temperature requirements, it is preferable (due to equipment design limitations) and often economical to employ multi-stage reciprocating machines or centrifugal/screw compressors. Multi-staging systems are of two types, compound and cascade, and are applicable to all types of compressors. With reciprocating or rotary compressors, two-stage compressors are preferable for load temperatures from –20 to –58ºC, and with centrifugal machines for temperatures around –43ºC. In multi-stage operation, a first-stage compressor, sized to meet the cooling load, feeds into the suction of a second-stage compressor after inter- cooling of the gas. A part of the high-pressure liquid from the condenser is flashed and used for liquid sub-cooling. The second compressor, therefore, has to meet the load of the evaporator and the flash gas. A single refrigerant is used in the system, and the work of compression is shared equally by the two compressors. Therefore, two compressors with low compression ratios can in combination provide a high compression ratio. - 104 -
  • 117.
    Energy Efficiency inRefrigeration Systems For temperatures in the range of –46ºC to –101ºC, cascaded systems are preferable. In this system, two separate systems using different refrigerants are connected such that one provides the means of heat rejection to the other. The chief advantage of this system is that a low-temperature refrigerant which has a high suction temperature and low specific volume can be selected for the low-stage to meet very low temperature requirements. 10.5.4 Matching capacity to system load During partial-load operation, the evaporator temperature rises and the condenser temperature falls, effectively increasing the COP. But at the same time, deviation from the design operation point and the fact that mechanical losses form a greater proportion of the total power negate the effect of improved COP, resulting in lower partial-load efficiency. Therefore, consideration of partial-load operation is important, because most refrigeration applications have varying loads. The load may vary due to variations in temperature and process cooling needs. Matching refrigeration capacity to the load is a difficult exercise, requiring knowledge of compressor performance and variations in ambient conditions, and detailed knowledge of the cooling load. 10.5.5 Capacity control and energy efficiency The capacity of compressors is controlled in a number of ways. Capacity control of reciprocating compressors through cylinder unloading results in incremental (step-by-step) modulation as against continuous capacity modulation of centrifugal through vane control and screw compressors through sliding valves. Therefore, temperature control requires careful system design. Usually, when using reciprocating compressors in applications with widely varying loads, it is desirable to control the compressor by monitoring the return water (or other secondary coolant) temperature rather than the temperature of the water leaving the chiller. This prevents excessive on–off cycling or unnecessary loading/unloading of the compressor. However, if load fluctuations are not high, the temperature of the water leaving the chiller should be monitored. This has the advantage of preventing operation at very low water temperatures, especially when flow reduces at low loads. The leaving water temperature should be monitored for centrifugal and screw chillers. Capacity regulation through speed control is the most efficient option. However, when employing speed control for reciprocating compressors, it should be ensured that the lubrication system is not affected. In the case of centrifugal compressors, it is usually desirable to restrict speed control to about 50% of the capacity to prevent surging. Below 50%, vane control or hot gas bypass can be used for capacity modulation. The efficiency of screw compressors operating at partial load is generally higher than either centrifugal compressors or reciprocating compressors, which may make them attractive in situations where partial-load operation is common. Screw compressor performance can be optimized by changing the volume ratio. In some cases, this may result in higher full-load efficiencies as - 105 -
  • 118.
    Training Manual onEnergy Efficiency for Small and Medium Enterprises compared to reciprocating and centrifugal compressors. Also, the ability of screw compressors to tolerate oil and liquid refrigerant slugs makes them preferred in some situations. 10.5.6 Multi-level refrigeration for plant needs The selection of refrigeration systems also depends on the range of temperatures required in the plant. For diverse applications requiring a wide range of temperatures, it is generally more economical to provide several packaged units (several units distributed throughout the plant) instead of one large central plant. Another advantage would be the flexibility and reliability accorded. The selection of packaged units could also be made depending on the distance at which cooling loads need to be met. Packaged units at load centers reduce distribution losses in the system. Despite the advantages of packaged units, central plants generally have lower power consumption since at reduced loads power consumption can be reduced significantly due to the large condenser and evaporator surfaces. Many industries use a bank of compressors at a central location to meet the load. Usually the chillers feed into a common header from which branch lines are taken to different locations in the plant. In such situations, operation at partial-load requires extreme care. For efficient operation, the cooling load and the load on each chiller must be monitored closely. It is more efficient to operate a single chiller at full load than to operate two chillers at partial- load. The distribution system should be designed such that individual chillers can feed all branch lines. Isolation valves must be provided to ensure that chilled water (or other coolant) does not flow through chillers that are not in operation. Valves should also be provided on branch lines to isolate sections where cooling is not required. This reduces pressure drops in the system and reduces power consumption in the pumping system. Individual compressors should be loaded to their full capacity before operating a second compressor. In some cases it is economical to provide a separate smaller-capacity chiller, which can be operated on an on–off control to meet peak demands, with larger chillers meeting the base load. Flow control is also commonly used to meet varying demands. In such cases the savings in pumping at reduced flow should be weighed against the reduced heat transfer in coils due to reduced velocity. In some cases, operation at normal flow rates, with subsequent longer periods of no-load (or shutoff) operation of the compressor, may result in larger savings. 10.5.7 Chilled water storage Depending on the nature of the load, it is economical to provide a chilled water storage facility with very good cold insulation. Also, the storage facility can be fully filled to meet the process requirements so that chillers need not be operated continuously. This system is usually economical if small variations in temperature are acceptable. This system has the added advantage of allowing the chillers to be operated at periods of low electricity demand to reduce peak demand charges. Low tariffs offered by some electric utilities for operation - 106 -
  • 119.
    Energy Efficiency inRefrigeration Systems at night can also be taken advantage of by using a storage facility. An added benefit is that lower ambient temperature at night lowers condenser temperature and thereby increases the COP. If temperature variations cannot be tolerated, it may not be economical to provide a storage facility since the secondary coolant would have to be stored at a temperature much lower than required to provide for heat gain. The additional cost of cooling to a lower temperature may offset the benefits. The solutions are case-specific. For example, in some cases it may be possible to employ large heat exchangers, at a lower cost burden than low-temperature chiller operation, to take advantage of the storage facility even when temperature variations are not acceptable. Ice bank systems which store ice rather than water are often economical. 10.6 GOOD PRACTICES FOR ENERGY EFFICIENCY In refrigeration plants and systems, adoption of the following good practices improves energy efficiency significantly: 10.6.1 Operation and maintenance-related measures • Establish a chiller efficiency-maintenance program. Start with an energy audit and follow-up; then make a chiller efficiency-maintenance program a part of your continuous energy management program. • Chillers often represent a plant’s single largest electric load. Fouled tubes, leaking refrigerant, changes in water temperature, and a myriad of other variables can increase operating costs by 8%–10%. Operating a chiller at its peak performance saves energy as well as maintenance costs. • Chiller efficiencies have improved significantly during the past ten years, mostly as a result of new refrigerants and microprocessor controls, as well as improved compressor and motor design. However, high-tech chillers have narrower tolerances, and service and upkeep are more crucial than ever for keeping them operating at peak performance. • Chiller performance varies significantly with operating conditions. Full- load performance is not a good indicator of overall performance, because chiller plants rarely operate at full load. Instead, partial-load performance is critical to good overall chiller plant performance. A good reference is ASHRAE Standard 90.1-2001, which lists minimum chiller efficiency requirements. • The daily log is still the first step in maintaining an efficiently run chiller plant in terms of operating conditions, including temperature, pressure, fluid level, and flow rate. Although microprocessor controls are recording more of these statistics, there is no substitute for a written log detailing findings from daily inspection of controls in the chiller room. • Heat transfer has the greatest single effect on chiller performance, and maintaining good heat transfer is fundamental to maintaining efficiency. Chiller efficiency declines rapidly when tubes become fouled. Contaminants, - 107 -
  • 120.
    Training Manual onEnergy Efficiency for Small and Medium Enterprises such as minerals, scale, mud, algae and other impurities, increase thermal resistance and reduce overall performance. These contaminants accumulate on the water side of heat transfer surfaces in both closed- and open-loop systems. Fouling occurs gradually over time, depending on the quality and temperature of the water used. • The compressor’s approach temperature, the difference between the temperature of the fluid leaving the heat exchanger, and the saturation temperature of the refrigerant being cooled or heated are good indicators of heat transfer efficiency. An increasing approach is a prime indicator that heat transfer efficiency is decreasing. An accurate log sheet will reveal when temperatures start to vary from efficient levels. • Condenser tubes should be brush-cleaned, rather than chemically cleaned, at least annually, with an automatic rotary-cleaning machine to keep them free of contaminants. • Condenser water using open cooling sources, such as atmospheric cooling towers, require water treatment to prevent fouling. Erosive conditions—for example, sand flowing through the tubes at high velocity—may pit tubes, decreasing tube effectiveness. Untreated water can damage tubes, piping, and other materials. • A cooling tower blowdown is the most effective way to remove solids and contaminants. When a sensor detects high water conductivity, an automatic valve dumps some water and its load of dissolved and suspended solids. A visual inspection also is a good (although less accurate) indicator of water quality. Inspect chilled water loops once a year for general water quality and evidence of corrosion. • Lowering the temperature of the water entering the condenser can improve the chiller’s efficiency. • Flow rate must be regulated closely, because too low a flow rate reduces chiller efficiency, leading to laminar flow. The minimum velocity is typically around 3 ft/second. However, too high a flow rate leads to vibration, noise, and tube erosion. The maximum recommended flow rate is typically around 12 ft/second. • The amount of cooling that any chiller can provide depends on how much refrigerant it moves through the compressor per unit time. It’s important to maintain the proper level of refrigerant. Leaks, as well as air and moisture, decrease efficiency and system reliability. Low refrigerant charge, usually resulting from leaks, causes the compressor to work harder and achieve less cooling. • Air and moisture are two non-condensables that can leak into low- pressure chillers. Non-condensables can reduce chiller efficiency by as much as 4% at 60% loads and 7% at 100% loads. Air insulates tubes, preventing exchange and elevating condensing temperatures, which also makes the compressor work harder. Moisture promotes acid formation, which can damage motor windings and bearings. Installing purge units on low-pressure chillers minimizes the effect of non-condensables. Positive - 108 -
  • 121.
    Energy Efficiency inRefrigeration Systems pressure chillers using HFC-134a, HFC-410a, and HCFC-22 do not require purge units because non-condensables cannot enter them. • Once a year, test compressor lube oil for a spectrometric chemical analysis that will provide details about moisture content, metals, acids, and other contaminants that affect performance. Oil should be replaced only if necessary. High moisture levels can indicate a purge unit problem, which has a significant effect on efficiency. Test samples from low-pressure chillers more frequently, using a schedule based on purge run hours. Replace oil filters when they exhibit a high pressure drop and when the oil charge is replaced. • For efficient starter and motor operation, check the safety and sensor calibrations on microprocessor controls. Consult the manufacturer’s guidelines. Check chiller electrical connections, wiring, and switch gear for hot spots and worn contacts. To prevent insulation faults, test motor windings for resistance to ground and winding-to-winding. Check the shaft seal on open drive motors for possible refrigerant leaks, and clean motor cooling air vents to maximize cooling. • A chiller motor is typically the largest single electrical load in a building. Constant-speed compressors match capacity to load through inlet vanes, throttling the gas allowed into the compressor impellers. This is not the most efficient way to modulate chiller capacity. Under the right operating conditions, variable speed drives offer significant energy savings. Variable speed drives also act as “soft starters” to reduce the motor’s inrush current to almost that of the full-load running amps. This reduction is important for chillers operating on emergency power generators. Variable speed drives also reduce the mechanical shock of starting large-horsepower motors, increasing chiller reliability and life. 10.6.2 Other generic opportunities for energy efficiency • The evolution of compressor technology has progressed from reciprocating to rotary, to twin rotary, to scroll, to screw, to centrifugal machines, in terms of efficiency. Need-based replacement for renovation and modernization for energy efficiency is a good opportunity. • Select most efficient compressors with lowest I kW/TR (integrated kW/TR accounting for part load performance). • Rooftop coating adoption, with reflective materials and under-deck insulation, will reduce U factor (heat transfer coefficient, which should be as low as possible) and heat ingress. • Maintain optimum wall area (70%) to window area (30%) ratio for minimizing solar heat gain. • Adopt energy-efficient low-wattage lighting systems to reduce cooling load. • Optimize thermostat settings for energy economy. • Adopt false ceilings in air-conditioned spaces to reduce the area to be conditioned. • Adopt double-glazed glass panes in windows to reduce solar heat gains. - 109 -
  • 122.
    Training Manual onEnergy Efficiency for Small and Medium Enterprises • Adopt sun film for heat solar gain reduction. • Adopt good filter maintenance practices for better AHU performance. • Regular cooling coil cleaning and ultraviolet light application will reduce bacterial effects. • Adopt energy-efficient water-cooled condensers in place of air-cooled condensers. • Adopt energy-efficient AHU fans. • Adopt heat recovery wheels in AHUs. • Adopt grooved copper tubes for better heat exchange. • Adopt super slit fins for better heat exchange. • Adopt heat recovery condensers. • Adopt variable frequency drives for pumps and fans for power savings. • Adopt cooling towers with 5 ºF approach, in place of conventional 7 ºF approach units, to optimize condenser performance. • Use soft water for condensers to avoid condenser scaling effects. • Use FRP blades in cooling tower fans, for power savings. • Adopt two-way valves for AHUs, to achieve better operational control. • Adopt intelligent building automation and controls. • Adopt chilled water storage and ice bank storage, as applicable, for peak demand management and energy savings. • Adopt automatic PF controllers for PF improvement. • Adopt VAR systems, especially where waste heat steam is available at low cost, as an eco-friendly and cost-effective alternative. • Adopt eco-friendly refrigerants. - 110 -
  • 123.
    11. GREEN BUILDINGCONCEPTS AND GOOD BUILDING PRACTICES 11.1 INTRODUCTION In current times of rapid infrastructure growth and a looming energy crisis, there is a strong need to address and incorporate good practices for efficient energy and resource use while planning for buildings, be it for residential purposes or for commercial applications. Green buildings would squarely address ecological and environmental impacts in a holistic manner and at the same time offer tremendous economic benefits to the occupants. A Green building is one which incorporates several green features, such as energy-efficient and eco-friendly equipment, recycled and environment-friendly building materials, quality indoor air for human safety and comfort, use of renewable energy, effective controls and building management systems, efficient use of water, non-toxic and recycled materials, effective use of existing landscapes, and adoption of cost-effective and environment-friendly technologies. 11.2 TYPICAL FEATURES OF GREEN BUILDINGS • Adoption of erosion control techniques like temporary seeding, permanent seeding, and mulching • Occupants encouraged to use mass transportation like bus or rail; use of bicycles and use of cleaner fuels for automobiles • Reduction of building footprints to minimize their impact on the environment • Reduction of impervious areas to prevent storm water run-off • Installation of high-efficiency irrigation methods and selection of vegetation which has low water consumption • Use of low water plumbing installations • Harvesting of site energy • Use of CFC-free HVAC equipment • Adoption of energy-efficient equipment for air-conditioning and lighting systems • Use of on-site renewable energy • Measurement and verification plan to ensure energy and water savings • Adoption of controls and building management systems • Segregation, collection, and disposal of waste streams at source • Use of salvaged or refurbished materials from other sites • Recycling of construction debris to other sites • Use of building materials having a high recycled content - 111 -
  • 124.
    Training Manual onEnergy Efficiency for Small and Medium Enterprises • Use of rapidly renewable materials (material which could be replenished within a life cycle of 10 years) • Declaration of the site as a non-smoking area, or provision of designated areas for smoking • Maintenance of indoor environmental quality, to avoid ‘sick building’ syndrome • Use of low VOC (volatile organic compound) paints, sealants, and adhesives. 11.3 BENEFITS OF GREEN BUILDINGS Green buildings have tremendous benefits, both tangible and intangible. The most tangible benefit is in reduction of operating energy and water costs right from day one, and during the entire life cycle of the building. Green buildings offer a range of benefits, including the following: • 30% to 40% reduction in operation cost • Green corporate image • Health and safety of building occupants • Enhanced occupant comfort • Improved productivity of occupants • Incorporation of best operational practices from day one • Incorporation of latest techniques and technologies. 11.4 GOOD PRACTICES IN THE BUILDING SECTOR This section outlines some good practices criteria related to them, and technologies and strategies available for realizing them. Practice 1: Plan for minimum energy requirements Criteria: Establish the minimum level of energy efficiency for the base building and systems. Practice 2: Design to meet building energy efficiency and performance as required by ASHRAE/IESNA 90.1-1999 or the local energy code, whichever is the more stringent. Technologies and strategies: • Design the building envelope and building systems to maximize energy performance. • Use a computer simulation model to assess the energy performance and identify the most cost-effective energy efficiency measures. • Quantify energy performance as compared to a baseline building. • Have an energy audit performed for the facility regularly. - 112 -
  • 125.
    Green Building Conceptsand Good Building Practices Practice 3: Optimize energy performance Criteria: Achieve increasing levels of energy performance above the prerequisite standard to reduce environmental impacts associated with excessive energy use. Practice 4: Reduce design energy cost compared to the energy cost budget, for regulated energy components, described in the requirements of ASHRAE/IESNA Standard 90.1-1999, as demonstrated by a whole building simulation using the Energy Cost Budget Method. Regulate energy components include HVAC systems, building envelope, service hot water systems, lighting and other regulated systems as defined by ASHRAE. It is often possible to reduce design energy cost by 10%–60%. Technologies and strategies: • Have an energy audit conducted for the building/facility. Design the building envelope and building systems to maximize energy performance. • Use a computer simulation model to assess the energy performance and identify the most cost-effective energy efficiency measures. Quantify energy performance as compared to a baseline building. • North light roofing, transparent roof sheets, ventilation design, chimney effect through tower design, aerated concrete blocks/hollow bricks, high ceiling, roof cooling salts. Practice 5: Plan for increasing levels of renewable technology use Criteria: Encourage and recognize increasing levels of self-supply through renewable technologies to reduce environmental impacts associated with fossil fuel energy use. Practice 6: • Supply a net fraction of the building’s total energy use (as expressed as a fraction of annual energy cost) through the use of on-site renewable energy systems. • Target the achievement of renewables share of total energy cost at between 5% and 20%. Technologies and strategies: • Assess the project for renewable energy potential including solar, wind, geothermal, biomass, hydro, and bio-gas strategies. • When applying these strategies, take advantage of net information and Institutions local and international. • Solar PV, CFL Solar hot water systems, solar cookers, bio-gas plants (rural segment), vermin composting. Practice 7: Plan for minimizing CFC Refrigerants in HVAC equipment Criteria: Reduce ozone depletion. - 113 -
  • 126.
    Training Manual onEnergy Efficiency for Small and Medium Enterprises Practice 8: • Zero use of CFC-based refrigerants in new building HVAC base building systems. • When reusing existing base building HVAC equipment, complete a comprehensive CFC phase out conversion. Technologies and strategies: • When reusing existing HVAC systems, conduct an inventory to identify equipment that uses CFC refrigerants and adopt a replacement schedule for these refrigerants. • For new buildings, specify new HVAC equipment that uses no CFC refrigerants, e.g. VAR or R134A in vapor compression systems. • Eco-friendly refrigeration systems, VAR (Central A/c) chillers. Practice 9: Plan for minimizing ozone depletion Criteria: Reduce ozone depletion and support early compliance with the Montreal Protocol. Practice 10: Install base building level HVAC and refrigeration equipment and fire suppression systems that do not contain HCFCs or Halons. Technologies and strategies for adoption: • When reusing buildings, replace inventory of refrigerants and fire suppression chemicals in existing building systems with those that contain HCFCs or halons. • For new buildings, specify refrigeration and fire suppression systems that use no HCFCs or halons. Practice 11: Plan for easy accounting of energy and water consumption Criteria: Provide for the ongoing accountability and optimization of building energy and water consumption performance over time. Practice 12: Plan with long-term continuous measurement of performance: • Lighting systems and controls • Constant and variable motor loads • Variable frequency drive (VFD) operation • Chiller efficiency at variable loads (kW/ton) • Cooling load • Air and water economizer and heat recovery cycles • Air distribution static pressures and ventilation air volumes • Boiler efficiencies • Building-specific process energy efficiency systems and equipment • Indoor water risers and outdoor irrigation systems - 114 -
  • 127.
    Green Building Conceptsand Good Building Practices Technologies and strategies: • Through building energy audit, model the energy and water systems to predict savings. • Design the building with equipment to measure energy and water performance. • Draft a Measurement and Verification Plan to apply during building operation that compares predicted savings to those actually achieved in the field. Practice 13: Plan for water-efficient landscaping Criteria: Limit or eliminate the use of potable water for landscape irrigation. Practice 14: • Use high efficiency irrigation technology, or • Use captured rain or recycled site water, to reduce potable water consumption for irrigation over conventional means. Technologies and strategies: • Perform a soil/climate analysis to determine appropriate landscape types. • Design the landscape with indigenous plants to reduce or eliminate irrigation requirements. • Use high-efficiency irrigation systems and consider reuse of storm water for irrigation. • Adopt ISO:14000 certification for large facilities. • Use pervious paver blocks, roof cover with gardens, rainwater harvesting. Practice 15: Plan for maximum wastewater reuse and less dependence on municipal water source Criteria: Reduce the generation of wastewater and potable water demand, while increasing the local aquifer recharge. Practice 16: • Reduce the use of municipally provided potable water for building sewage conveyance, or • Treat all wastewater on-site for re-use application. Technologies and strategies: • Estimate the wastewater volume generated in the building and specify high-efficiency fixtures and dry fixtures such as composting toilets and waterless urinals to reduce these volumes. • Consider reusing storm water for sewage conveyance or on-site wastewater treatment systems (mechanical or natural). • Biological root zone treatment. • Recycled water for gardening. • Sewage water for mechanical (filter press drum) type cleaning systems, etc. - 115 -
  • 128.
    Training Manual onEnergy Efficiency for Small and Medium Enterprises Practice 17: Plan for maximizing water use efficiency Criteria: Maximize water efficiency within buildings to reduce the burden on municipal water supply and wastewater systems. Practice 18: • Employ strategies that in the aggregate use less water than the water-use baseline calculated for the building (not including irrigation). • Reduce potable water use by at least 10%. Technologies and strategies: • Estimate the potable and non-potable water needs for the building. • Use high-efficiency fixtures, dry fixtures such as composting toilets and waterless urinals, and occupant sensors to reduce the potable water demand. • Consider reuse of storm water for non-potable applications such as toilet and urinal flushing, mechanical systems, and custodial uses. Practice 19: Plan for storage and collection of recyclables while building Criteria: Facilitate the reduction of waste generated by building occupants that is hauled to and disposed of in landfills. Practice 20: Provide an easily accessible area that serves the entire building and is dedicated to the separation, collection, and storage of materials for recycling including (at a minimum) paper, glass, plastics, and metals. Technologies and strategies: • Designate an area for recyclable collection and storage that is appropriately sized and located in a convenient area. • Identify local waste handlers and buyers for glass, plastic, office paper, newspaper, cardboard, and organic wastes. • Instruct occupants on building recycling procedures. • Consider employing cardboard balers, aluminum can crushers, recycling chutes, and other waste management technologies to further enhance the recycling program. • Recycle wood, glass, aluminum and ceramic tiles, furniture made of bagasse-based completed wood, etc. Practice 21: Plan for building life extension and re-use Criteria: • Extend the life cycle of existing building stock. • Conserve resources. • Retain cultural resources. • Reduce waste. - 116 -
  • 129.
    Green Building Conceptsand Good Building Practices • Reduce environmental impacts of new buildings as they relate to materials manufacturing and transport. Practice 22: • Reuse large portions of existing structures during renovation or redevelopment projects. • Identify opportunities to incorporate salvage materials such as beams and posts, flooring, paneling doors, frames, cabinets, furniture, bricks and decorative items. Technologies and strategies: • Consider reuse of existing buildings, including structure, shell, and non- shell elements. • Remove elements that pose contamination risk to building occupants and upgrade outdated components such as windows, mechanical systems, and plumbing fixtures. Practice 23: Plan for increasing ventilation effectiveness Criteria: Provide for the effective delivery and mixing of fresh air to support the health, safety, and comfort of building occupants. Practice 24: • For mechanically ventilated buildings, design ventilation systems that result in an air change effectiveness (E) greater than or equal to 0.9 as determined by ASHRAE 129-1997. • For naturally ventilated spaces, demonstrate a distribution and laminar flow pattern that involves not less than 90% of the room or zone area in the direction of air flow. Technologies and strategies: • Design the HVAC system and building envelope to optimize air change effectiveness. • Air change effectiveness can be optimized using a variety of ventilation strategies including displacement ventilation, low-velocity ventilation, and operable windows. • The air change effectiveness of the building after construction should be regularly tested. • CO2 monitoring; chimney type ducting for intake/exhaust. Practice 25: Plan for minimum indoor air quality requirement Criteria: Establish minimum indoor air quality (IAQ) performance to prevent the development of indoor air quality problems in buildings, maintaining the health and wellbeing of the occupants. Practice 26: Meet the minimum requirements of voluntary consensus standard ASHRAE 62- 1999, Ventilation for Acceptable Indoor Air Quality and Approved Addenda. - 117 -
  • 130.
    Training Manual onEnergy Efficiency for Small and Medium Enterprises Technologies and strategies • Design the HVAC system to meet the ventilation requirements of the reference standard. • Identify potential IAQ problems on the site and locate air intakes away from contaminant sources like low volatile organic matter paints, carpets, adhesives, and sealants. Practice 27: Plan for increased use of local/regional materials Criteria: Increase demand for building products that are manufactured locally, thereby reducing the environmental impacts resulting from their transportation and supporting the local economy. Practice 28: Specify at least 20%–50% of building materials that are manufactured in the local economy. Technologies and strategies: • Establish a project goal for locally sourced materials and identify materials and material suppliers who can achieve this goal. • During construction, ensure that the specified local materials are installed and quantify the total percentage of local materials installed. • Use compressed earth blocks, wood/straw boards, fly ash cement, hollow bricks. Practice 29: Plan for efficient and safe wiring practices Criteria: Quality assurance of electrical wiring material, wiring accessories, grounding, leakage protection, overload protection devices and metering to ensure a safe and energy-efficient distribution infrastructure. Practice 30: Adopt well-established standard material and engineering practices. Technologies and strategies: MCCBs/MCBs, CVTs, UPS, electronicb, CFLs, remote controls for lights and fans, electronic regulators, earth leakage protection relays, and occupancy sensors are some of the devices and technologies applicable in this context. 11.5 SOME OTHER GENERIC PRACTICES THAT CAN BE ADOPTED • Use of fly-ash-based cement • Use of fly-ash-based Aerocon blocks • Declaration of building as “non-smoking” • CO2 censor installation • Regular checks on AHU filters • Use of composite wood in preference to hardwoods like teak - 118 -
  • 131.
    Green Building Conceptsand Good Building Practices • Daylight view for 90% of occupied areas • Minimum 25% open space set apart from built-up area • Site location selected close to bus and rail lines • Better access to community transport rather than individual transportation • Extensive roof garden coverage • Rain water harvesting adoption • Drip irrigation adoption • Adoption of fast-growing plantations • Use of low-U-value glazed glass • Adoption of daylight dimmer controls. - 119 -
  • 132.
    12. CLEAN DEVELOPMENTMECHANISM 12.1 INTRODUCTION The Clean Development Mechanism (CDM) was instituted in 2001, under the Kyoto Protocol, to enable developed countries to meet their greenhouse gas (GHG) reduction targets at lower cost through projects in developing countries. A CDM project is a development project, driven by market forces, that reduces GHGs. In a CDM project, an investor from an industrialized country supplies capital or technology, based on the future values of certified emission reduction units (CERs), also known as carbon credits, which measure the reduction of GHGs in the developing country. The procedure starts with the industrialized country keeping a regularly updated inventory of its emissions. The country may choose to allocate its national target (set by the Kyoto Protocol) across a number of domestic emitters, in much the same way that resources such as fishing rights or logging rights are allocated. A domestic emitter can meet its allocated target through mitigation activities within the country, or it can make use of the two Kyoto Protocol project-based flexibility mechanisms. The CDM allows the emitter to invest in a project in a developing country or buy CERs from someone who has invested in a project. Under the CDM, all parties benefit: the host country is assisted in achieving sustainable development; the owner of the project receives financial and technological assistance; and the emitter in the industrialized country receives carbon credits. 12.2 OBJECTIVES OF CDM The CDM has three stated objectives: • To assist parties not included in Annex I (i.e., developing countries) in achieving sustainable development. • To contribute to the ultimate objective of the convention (i.e., stabilize GHG concentrations in the atmosphere at a level that would prevent dangerous anthropogenic interference with the climate system). • To assist parties included in Annex I (developed countries) in achieving compliance with their quantified emission limitation and reduction commitments under article 3 of the Kyoto Protocol. 12.3 CDM AS A SUSTAINABLE DEVELOPMENT STRATEGY The Clean Development Mechanism is designed as an element of the sustainable development strategy allowing industrialized countries investing in “clean” projects in developing countries also to gain emission credits. These - 120 -
  • 133.
    Clean Development Mechanism creditsare given in the form of Certified Emission Reductions (CERs), which, like all the other Kyoto accounting units, are expressed in tons of carbon dioxide equivalent. The financing country can use these units to offset its own emission of greenhouse gases during a given period, or sell them to a country. It can also bank them for use during a subsequent period. Since these investments are viewed in a positive light, they also add to the reputation of project developers and investors. At the same time, the recipient country gains from an increase in investment (which may be from private or public sources) in sustainable development. 12.4 METHODOLOGIES The Marrakech Accords stipulate that an emission reduction project activity under the CDM must, among other things: • use an approved methodology to define the baseline emissions (i.e., the emission that would have occurred in the absence of the project), from which reductions are calculated; • use an approved monitoring methodology to monitor actual emissions and collect other information needed to calculate the emission reductions achieved; and • be reviewed by an accredited “designated operational entity” which confirms that the proposed baseline and monitoring methodologies are appropriate and that other eligibility requirements are met. 12.5 STAKEHOLDERS AND ROLES The implementation of CDM projects involves a number of stakeholder participants and organizations: • Host Government DNA • Annex I DNA • Local Stakeholders • Project Participants • Designated Operating Entity • Executive Board (and Panels) • Meeting of parties to the Kyoto Protocol • Accredited NGOs Conference of parties serving as meeting of parties (CoP/MoP): The Conference of Parties Serving as Meeting of Parties (CoP/MoP) to the Kyoto Protocol is the authority and provides guidance to CDM. The CoP/MoP takes decision on recommendations by the Executive Board (EB) and designates Operating Entities (OE). The CoP/MoP also reviews the EB reports as well as the distribution of Operating Entities and CDM project activities. - 121 -
  • 134.
    Training Manual onEnergy Efficiency for Small and Medium Enterprises Executive board: The Executive Board supervises the CDM under authority of the MoP of the Kyoto Protocol. The EB develops the modalities and procedures for the CDM, as well as the rules and procedures; approves new methodologies; simplifies modalities and procedures for small-scale CDM projects; accredits and designates OEs; develops and maintains a CDM registry; makes information relating to CDM projects publicly available; and reports to the MoP. Operational entities (OEs): OEs are accredited and designated by the Executive Board based on the accreditation standards. The OE validates proposed CDM project activities or verifies and certifies emission reductions. Designated National Authority (DNA): A Designated National Authority (DNA) for CDM should be specified by all the parties to Kyoto Protocol who participate in CDM project activities. While the purpose of the DNAs in Annex I countries is to ensure meeting their commitments specified in Annex B to the Kyoto Protocol and provide written approval of voluntary participation in each CDM project activity, the DNAs in Non-Annex I countries which are host parties have the additional responsibility of providing host country approval and confirming that the project activity assists the party in achieving sustainable development. Project participants: Project participants can either be a party participating in a CDM or public or private entities authorized by a party to participate in CDM project activities. Project participants usually initiate and complete measures, operations, or actions that aim at reducing GHGs and decide on allocation of CERs. Other stakeholders, parties, and accredited NGOs: Stakeholders are the public, including individuals, groups, or communities who are affected or likely to be affected by the proposed CDM activity or actions. In the context of CDM, parties will be parties to the Kyoto Protocol. NGOs that have been accredited by UNFCCC can also make stakeholder comments on a CDM project activity. 12.6 CDM APPLICATIONS IN INDUSTRIAL ENERGY SYSTEMS Renewable energy • Wind power • Solar • Biomass power • Hydro power Energy efficiency measures • Boiler and steam efficiency • Pumps and pumping system • Efficient cooling systems - 122 -
  • 135.
    Clean Development Mechanism • Back pressure turbines Co-generation in industries having both steam and power requirements Power sector • Induction of new technologies which are efficient (e.g. thermal) • Reduction in technical T&D losses Fuel switching • From fossil fuel to green fuels like biomass Waste management • Capturing of landfill methane emissions to generate power • Utilization of waste and waste water emissions for generation of energy - 123 -
  • 136.
    Annex SME energy efficiency opportunities assessment checklist Estimated Estimated Energy Potential for Consumption Savings /hr (or any Hours of S. Enconomic (Order of Applicability relevant Operation Nos. No. Opportunity magnitude of energy /Day savings margin indicator) indicated in by Existing brackets) Equipment 1. Soft Starters Applicable/ (3% of operating Energy Savers Not Applicable kW) 2. Variable Applicable/ (3–5 % of Speed Drives Not Applicable operating kW (Hydraulic/eddy current type) 3. Maximum Applicable/ (Reduction of Demand Not Applicable demand charges) controller 4. Capacitor and Applicable/ (1% on energy auto PF controls: Not Applicable consumption in terms of distribution loss reduction) 5. Electronic timers Applicable/ (Direct savings for machineries Not Applicable -depends on the and lighting excess hours of operation above prescribed time of operation) 6. Variable Applicable/ (5–15% of frequency drive Not Applicable operating kW (Electronic) 7. Permanent Applicable/ (10–15% magnet motor for Not Applicable on average variable speed operating kW) applications (Continued on next page) - 124 -
  • 137.
    Annex ( ... Continued) Lighting energy (15–20% on Applicable/ 8. savers (voltage operating lighting Not Applicable controller) kW) Efficient lamps (30–50% of Applicable/ 9. (T5, CFL, métal existing lighting Not Applicable halide, HPSV) kW) Transparent (Avoids at least roofing sheets to Applicable/ 25% of existing 10. reduce lighting Not Applicable Shop Floor Day load Lighting) (Improvement in Energy-efficient Applicable/ 11. existing efficiency water pumps Not Applicable up to 75%) (Being small FRP blades for Applicable/ fans reduction of 12. cooling tower Not Applicable 5-7% on existing fans fan kW drawl) (Improves spray Efficient spray in mist form Applicable/ 13. nozzles in cooling and completely Not Applicable towers eliminates need for CT-ID fan) (3–5% Savings Compressed Applicable/ in overall 14. air ON/OFF Not Applicable existing kWh controller consumption) (8% reduction in Compressed motor input kW air generation Applicable/ for every 1 kg/ 15. pressure Not Applicable cm2 reduction reduction in discharge pressure) (Direct saving- Leakage based Compressed Applicable/ on Trial (or 16. air leakage Not Applicable estimated) varies reduction between 10–40%) (Continued on next page) - 125 -
  • 138.
    Training Manual onEnergy Efficiency for Small and Medium Enterprises ( ... Continued) (15% reduction Trans-vector in compressed nozzles for end Applicable/ air end use for 17. use compressed Not Applicable a particular air cleaning cleaning applications application) (Depending on ON/OFF cycles compressor Compressor capacity can be speed reduction Applicable/ 18. optimized by based on load Not Applicable speed reduction– and unload cycles by pulley modification or VFD) (Normal existing kW/TR (anywhere between 1–2) Vapor absorption Applicable/ will reduce to a 19. chiller Not Applicable meager 0.1 kW/ TR. Feasible only if waste heat is used for VAR Identification of faulty, leaking traps can save Applicable/ 20. Steam traps direct steam loss Not Applicable through them (10–40% on case to case basis) (Up to 70% recovery is possible–this is direct savings Condensate Applicable/ 21. as heat input recovery Not Applicable to the boiler OR Hot Water requirement for the process) (Continued on next page) - 126 -
  • 139.
    Annex ( ... Continued) (Flue gas temperature can be reduced from existing value Air pre-heaters to 170ºC in case for waste heat Applicable/ 22. of oil fired and recovery in Bbiler Not Applicable 130ºC in case exhaust gas of Coal fired. Minimum ΔT of flue gas should be 40–50ºC) (Flue gas temperature can be reduced from existing value Air pre-heaters to 170ºC in case for waste heat Applicable/ of oil fired and 23. recovery in Not Applicable 130ºC in case of furnace exhaust Coal fired. Here gas ΔT of flue gas will be huge and WHR potential also huge) (5–7% of existing surface heat loss Ceramic for temperatures insulation Applicable/ below 200ºC and 24. for heat loss Not Applicable up to 10% for reduction from temperatures furnace surfaces between 300–500ºC) - 127 -