Download as PDF, PPTX

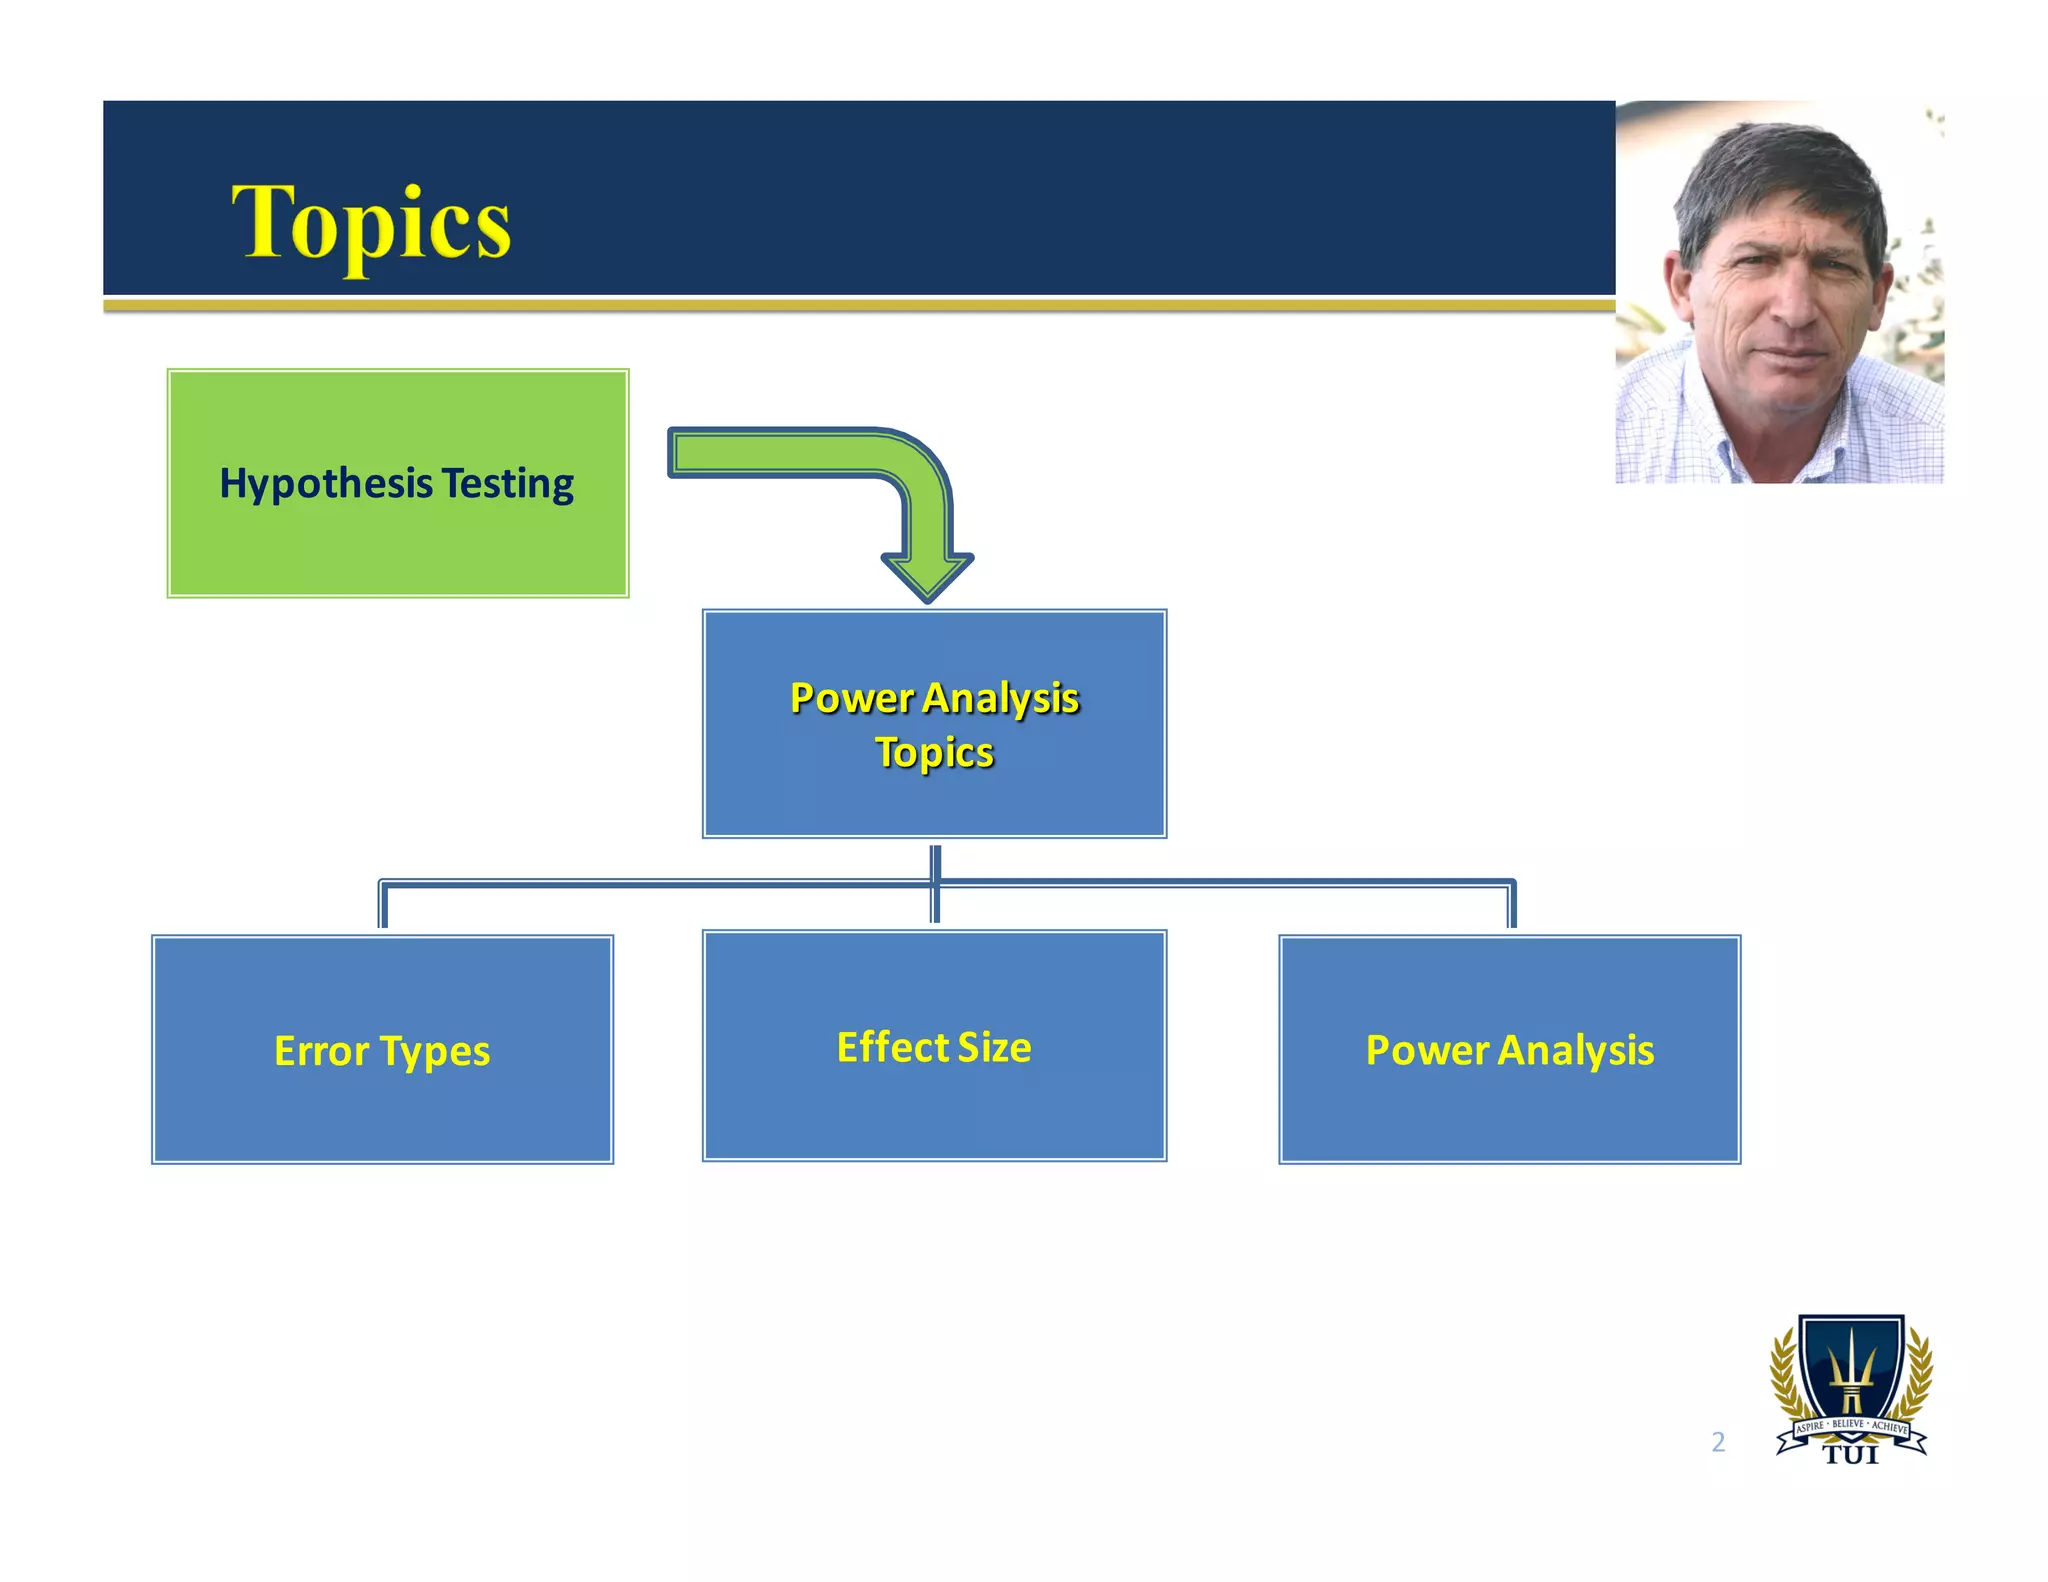
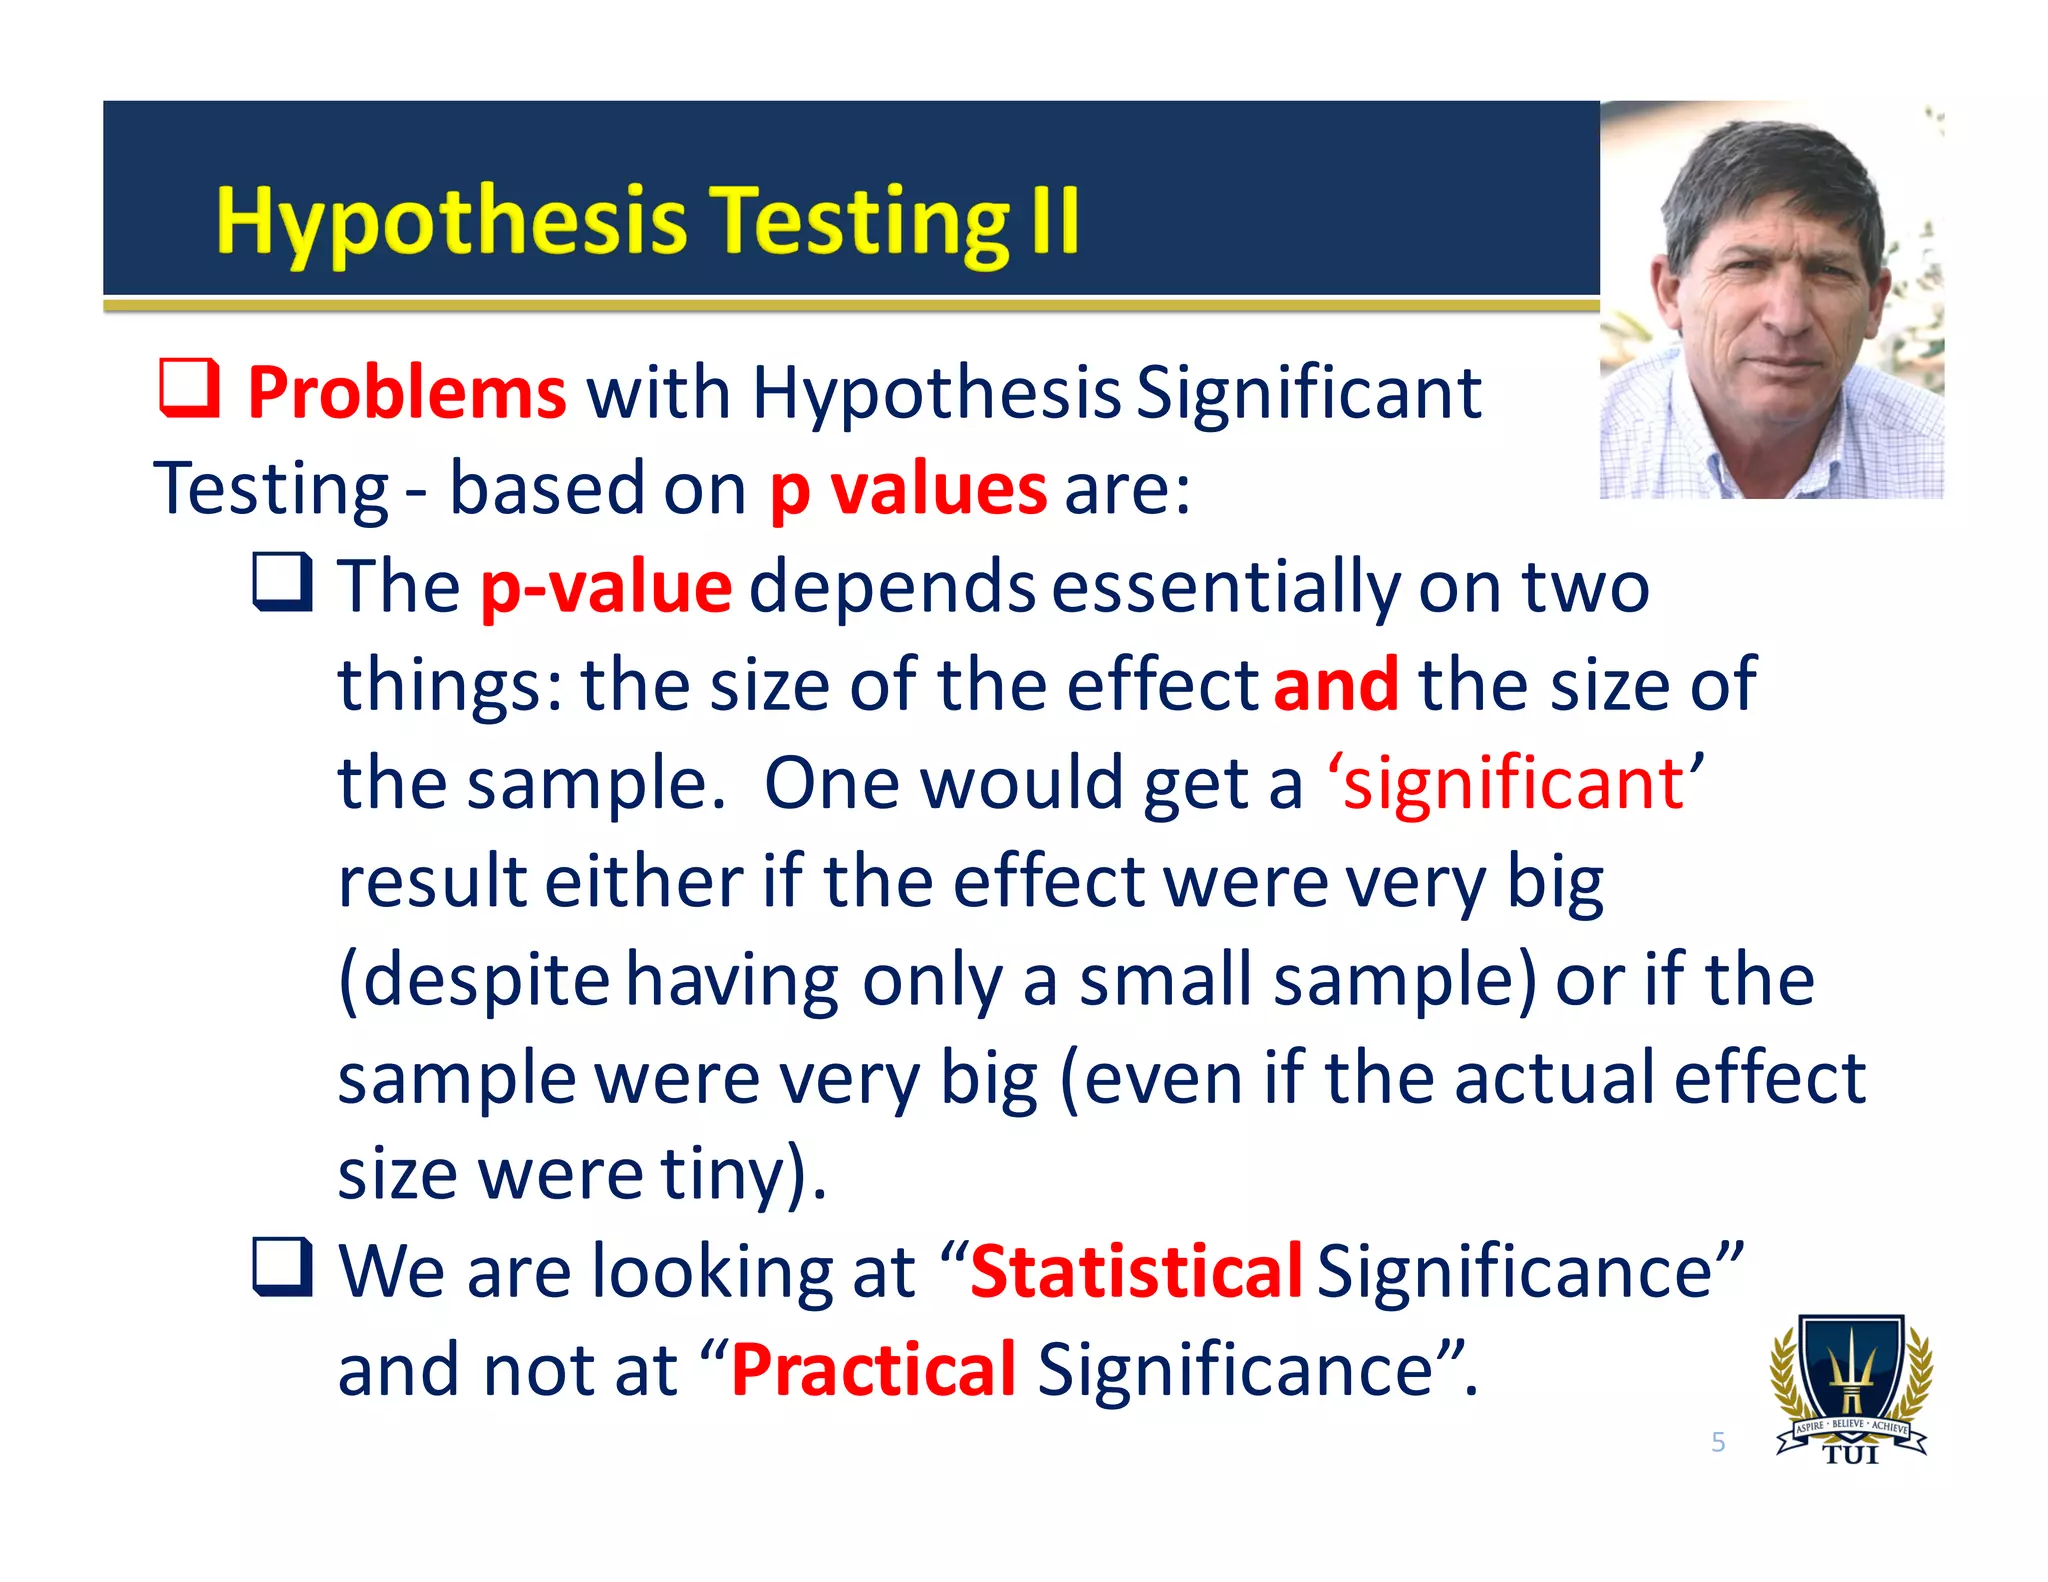
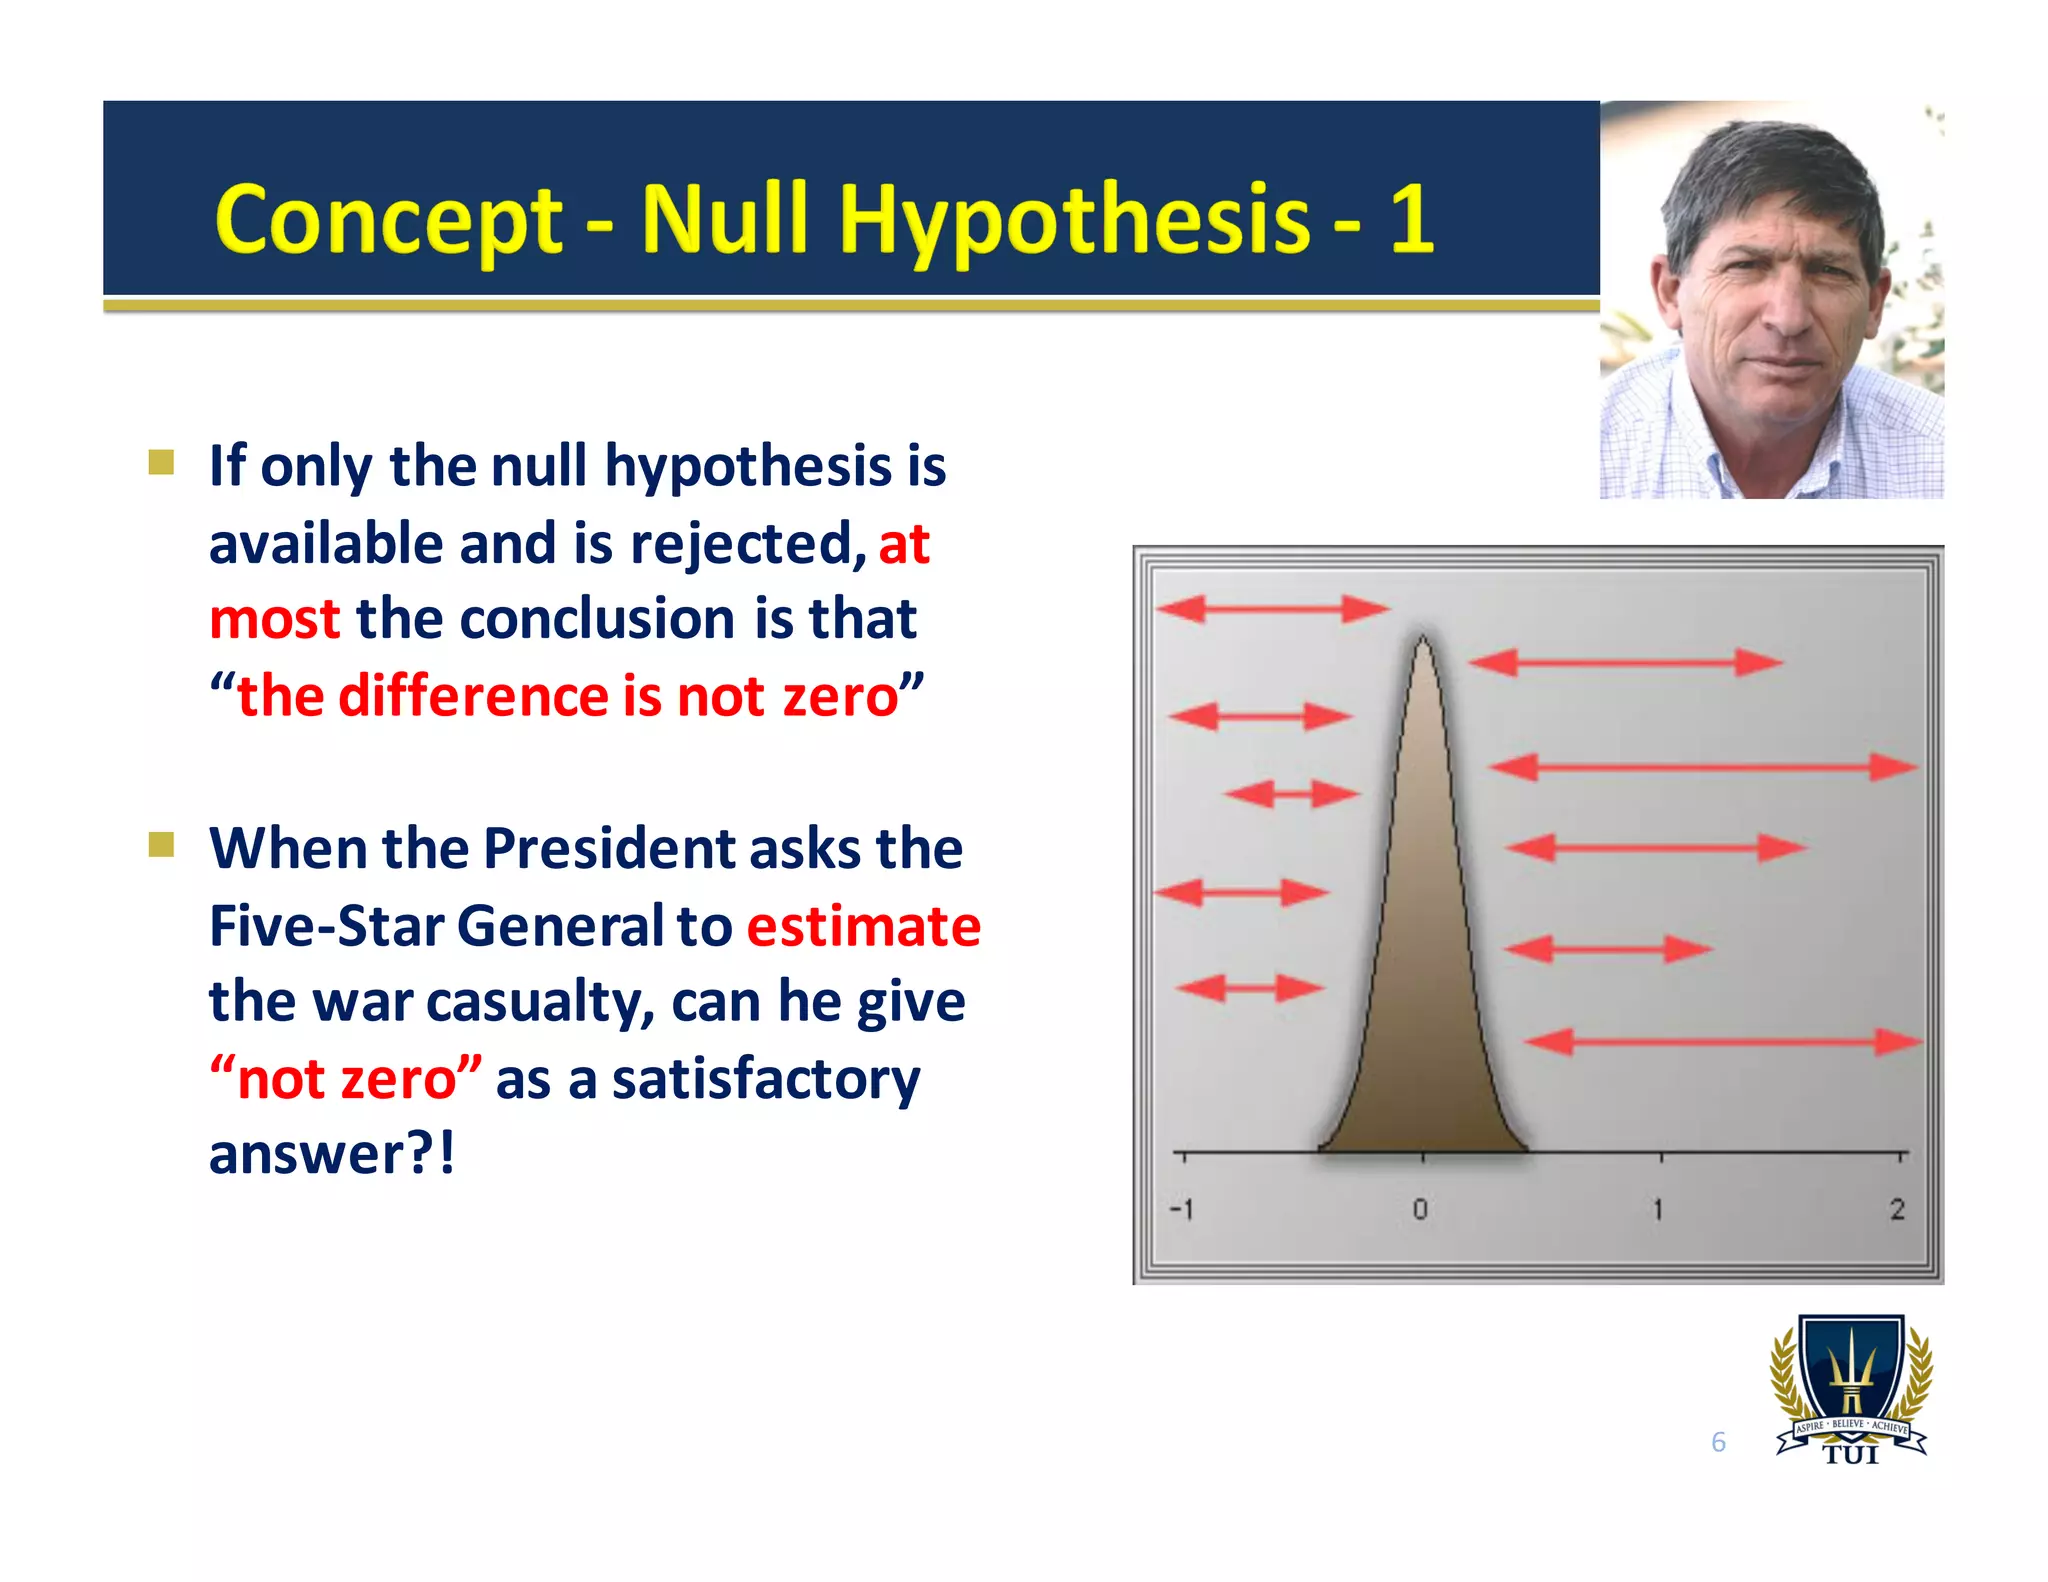
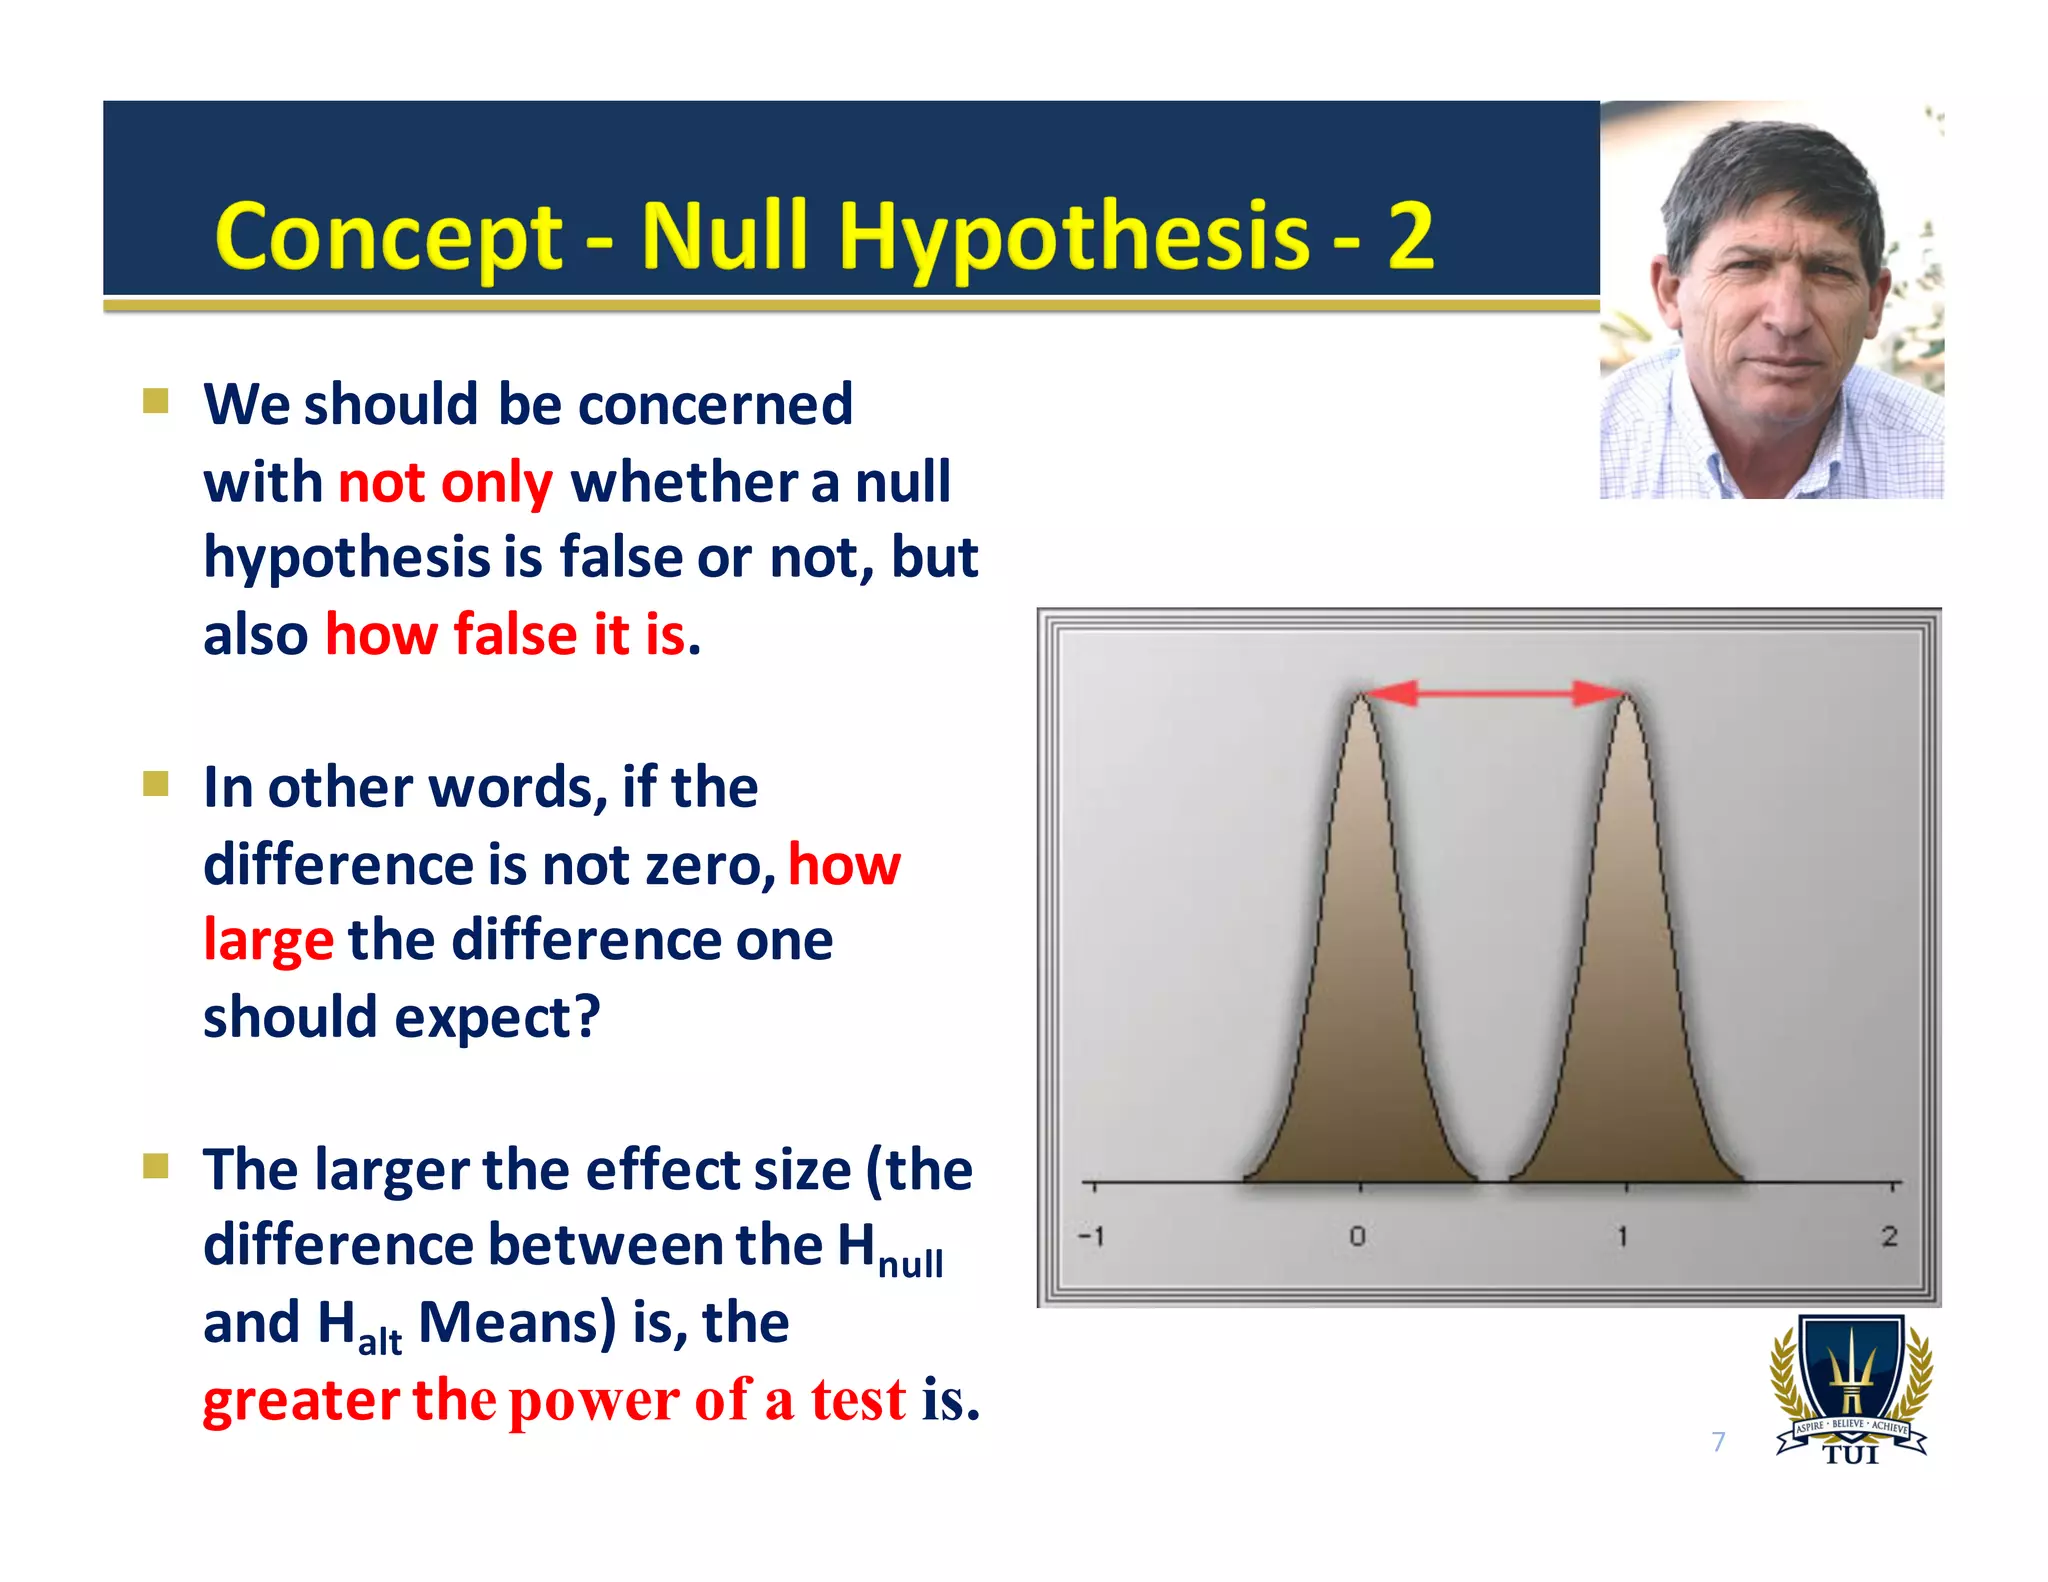
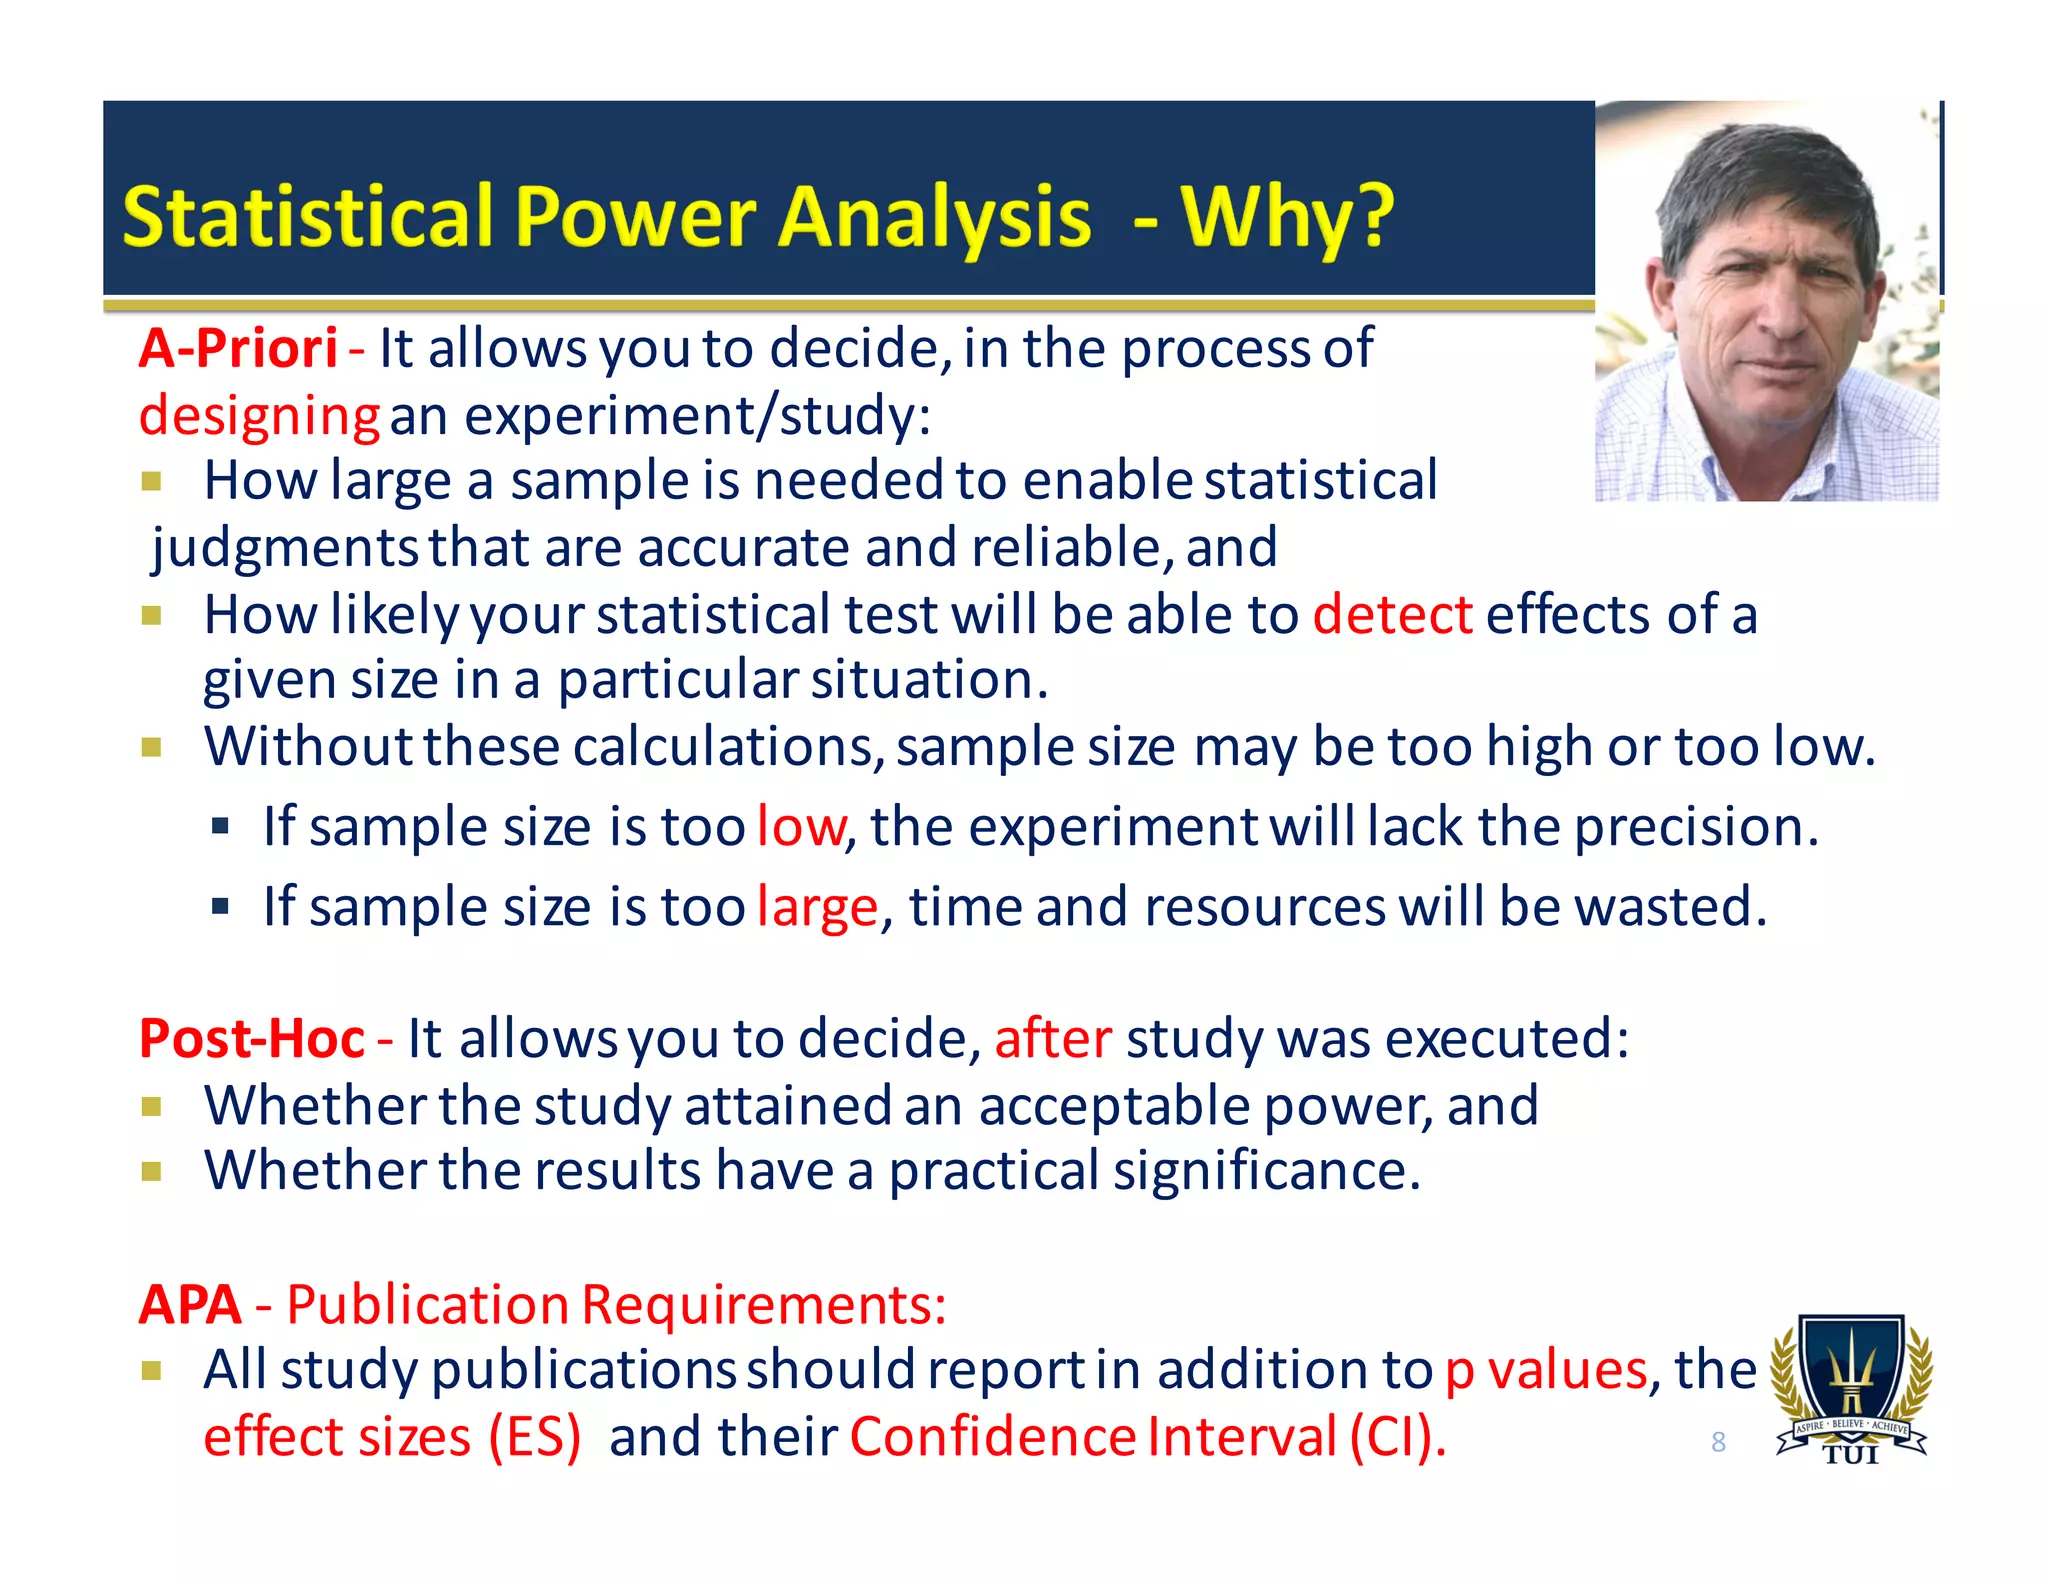
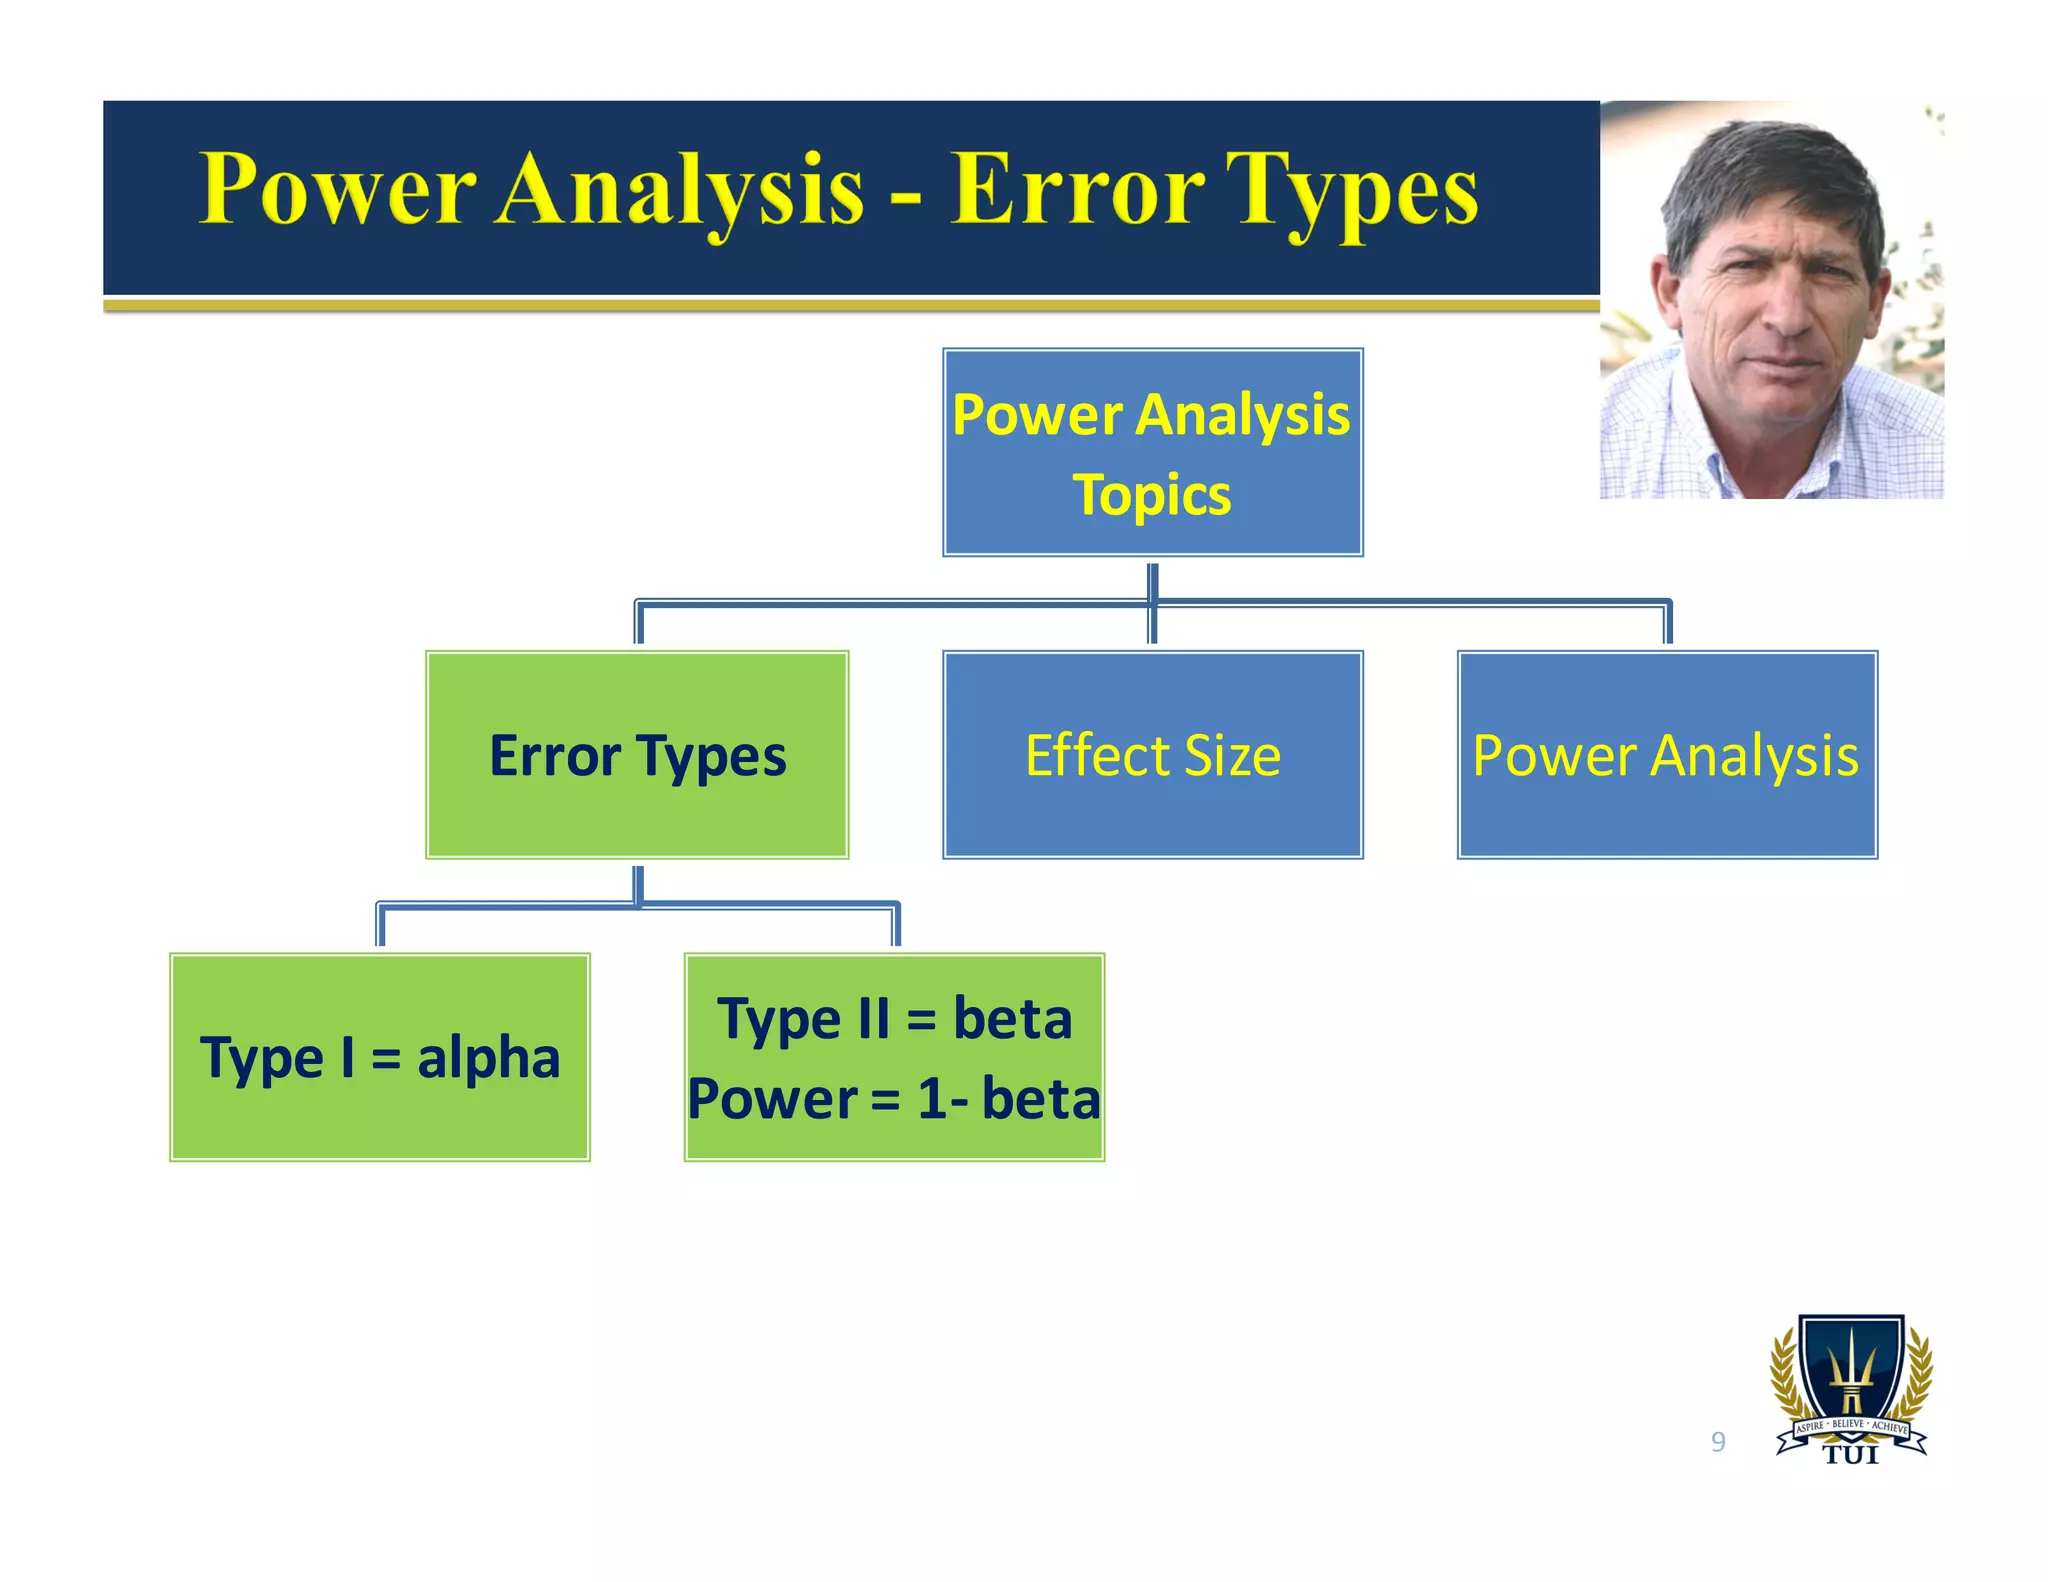
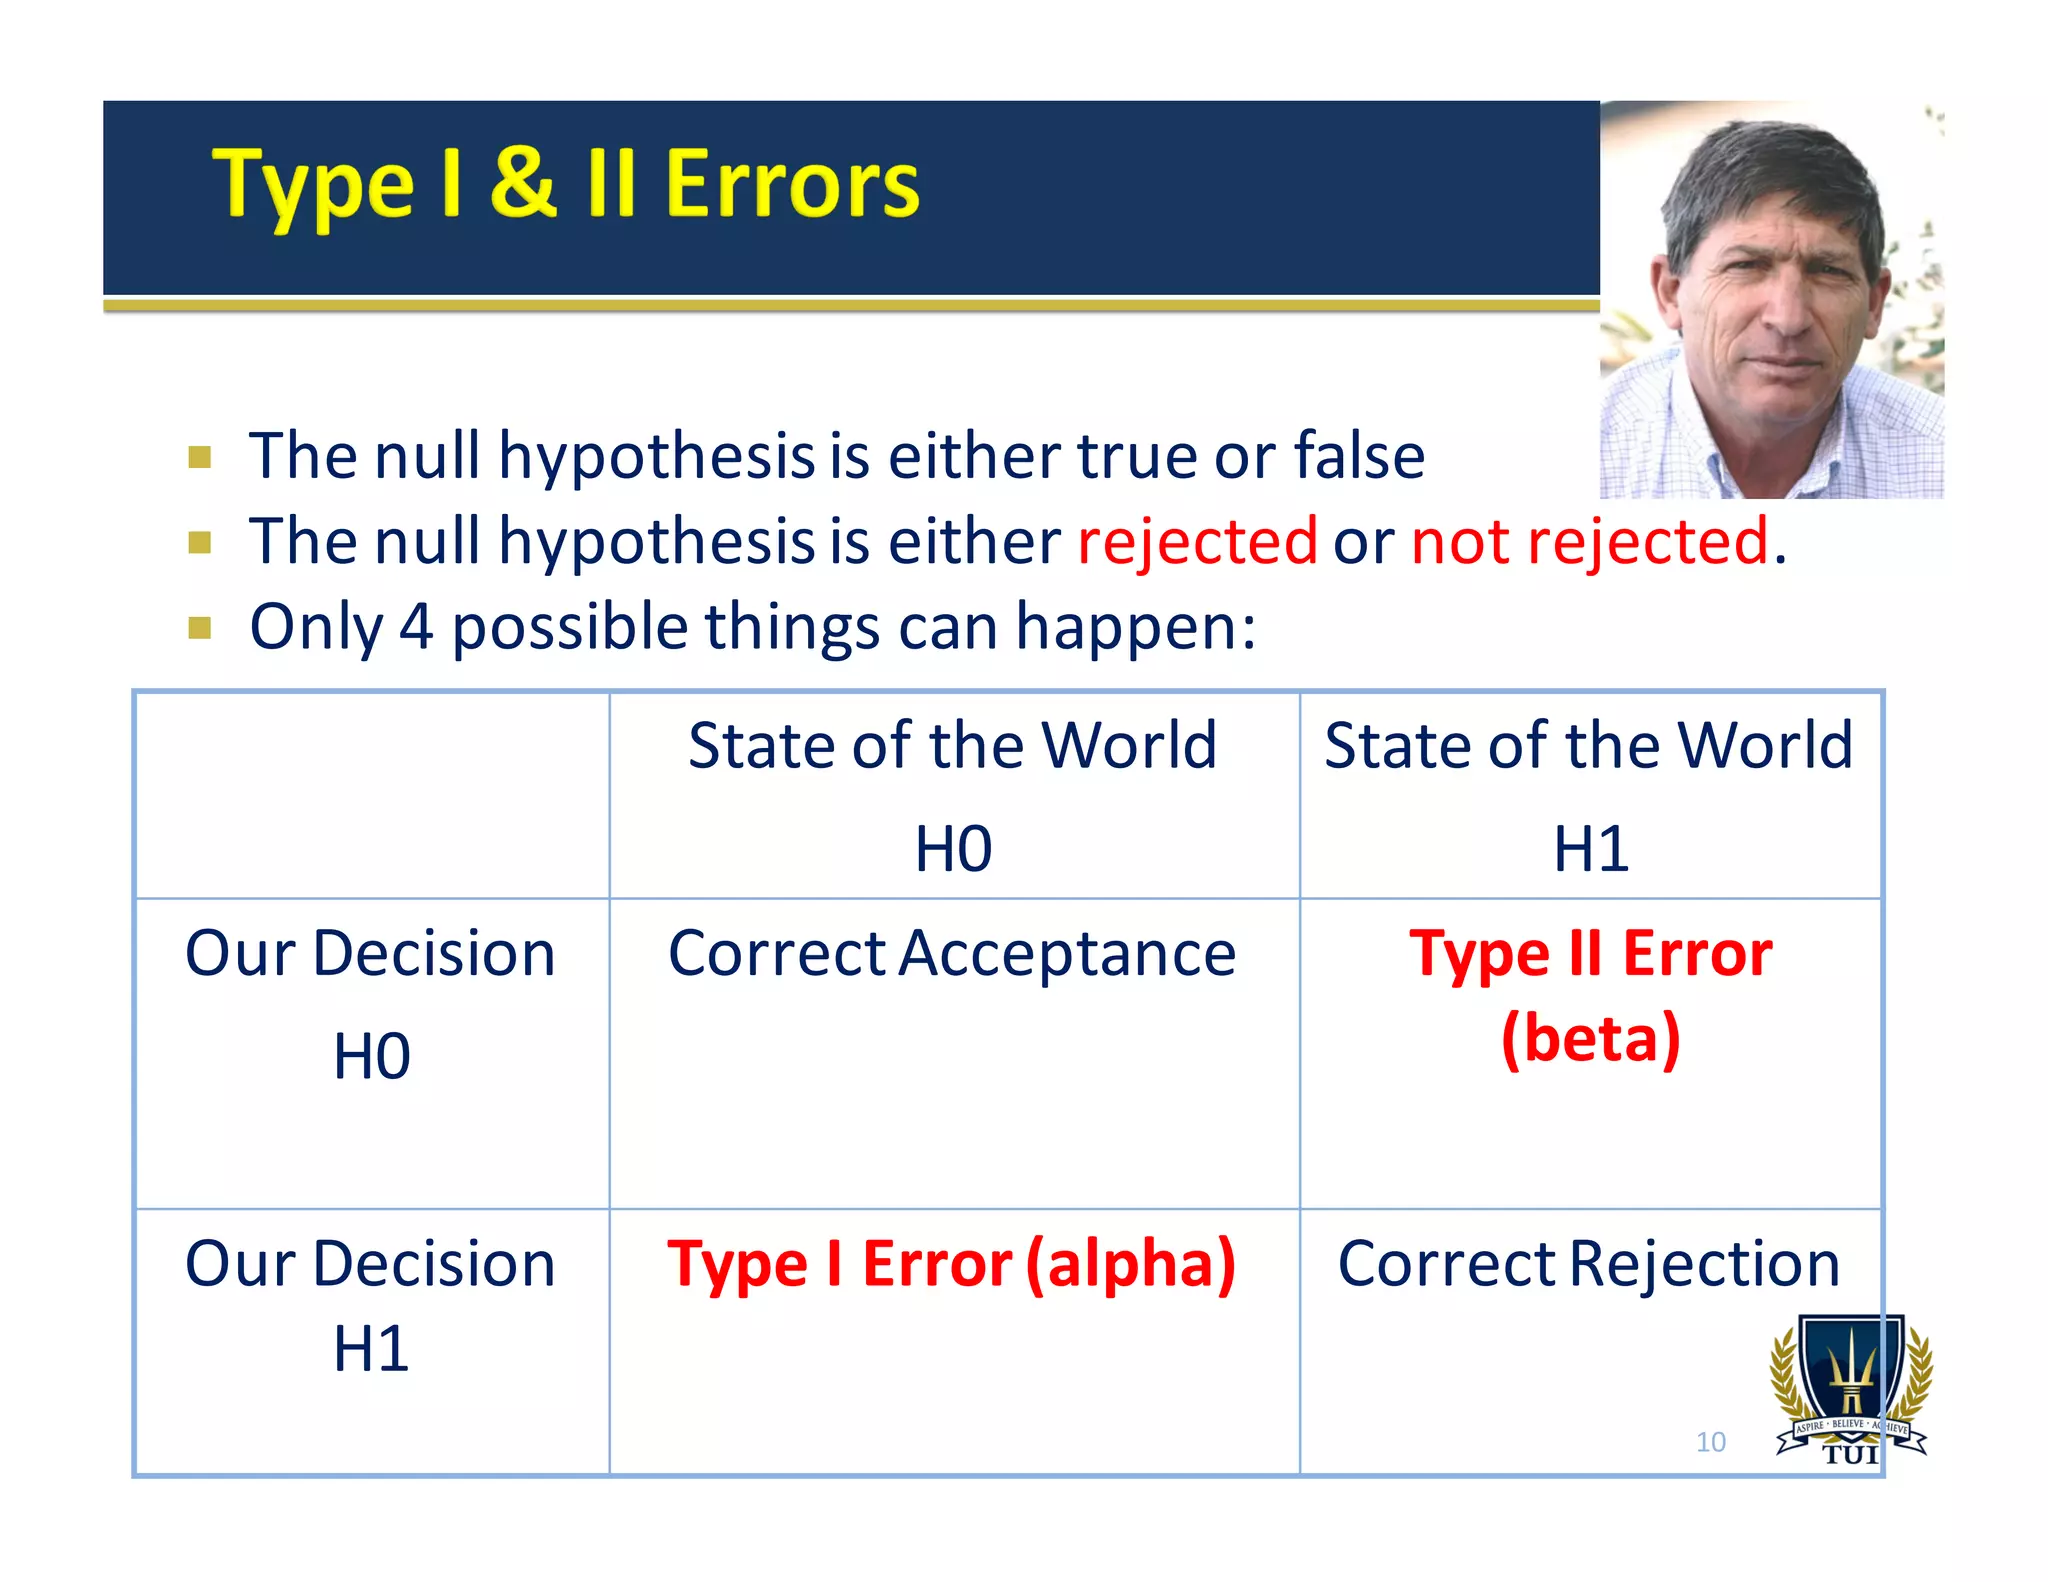
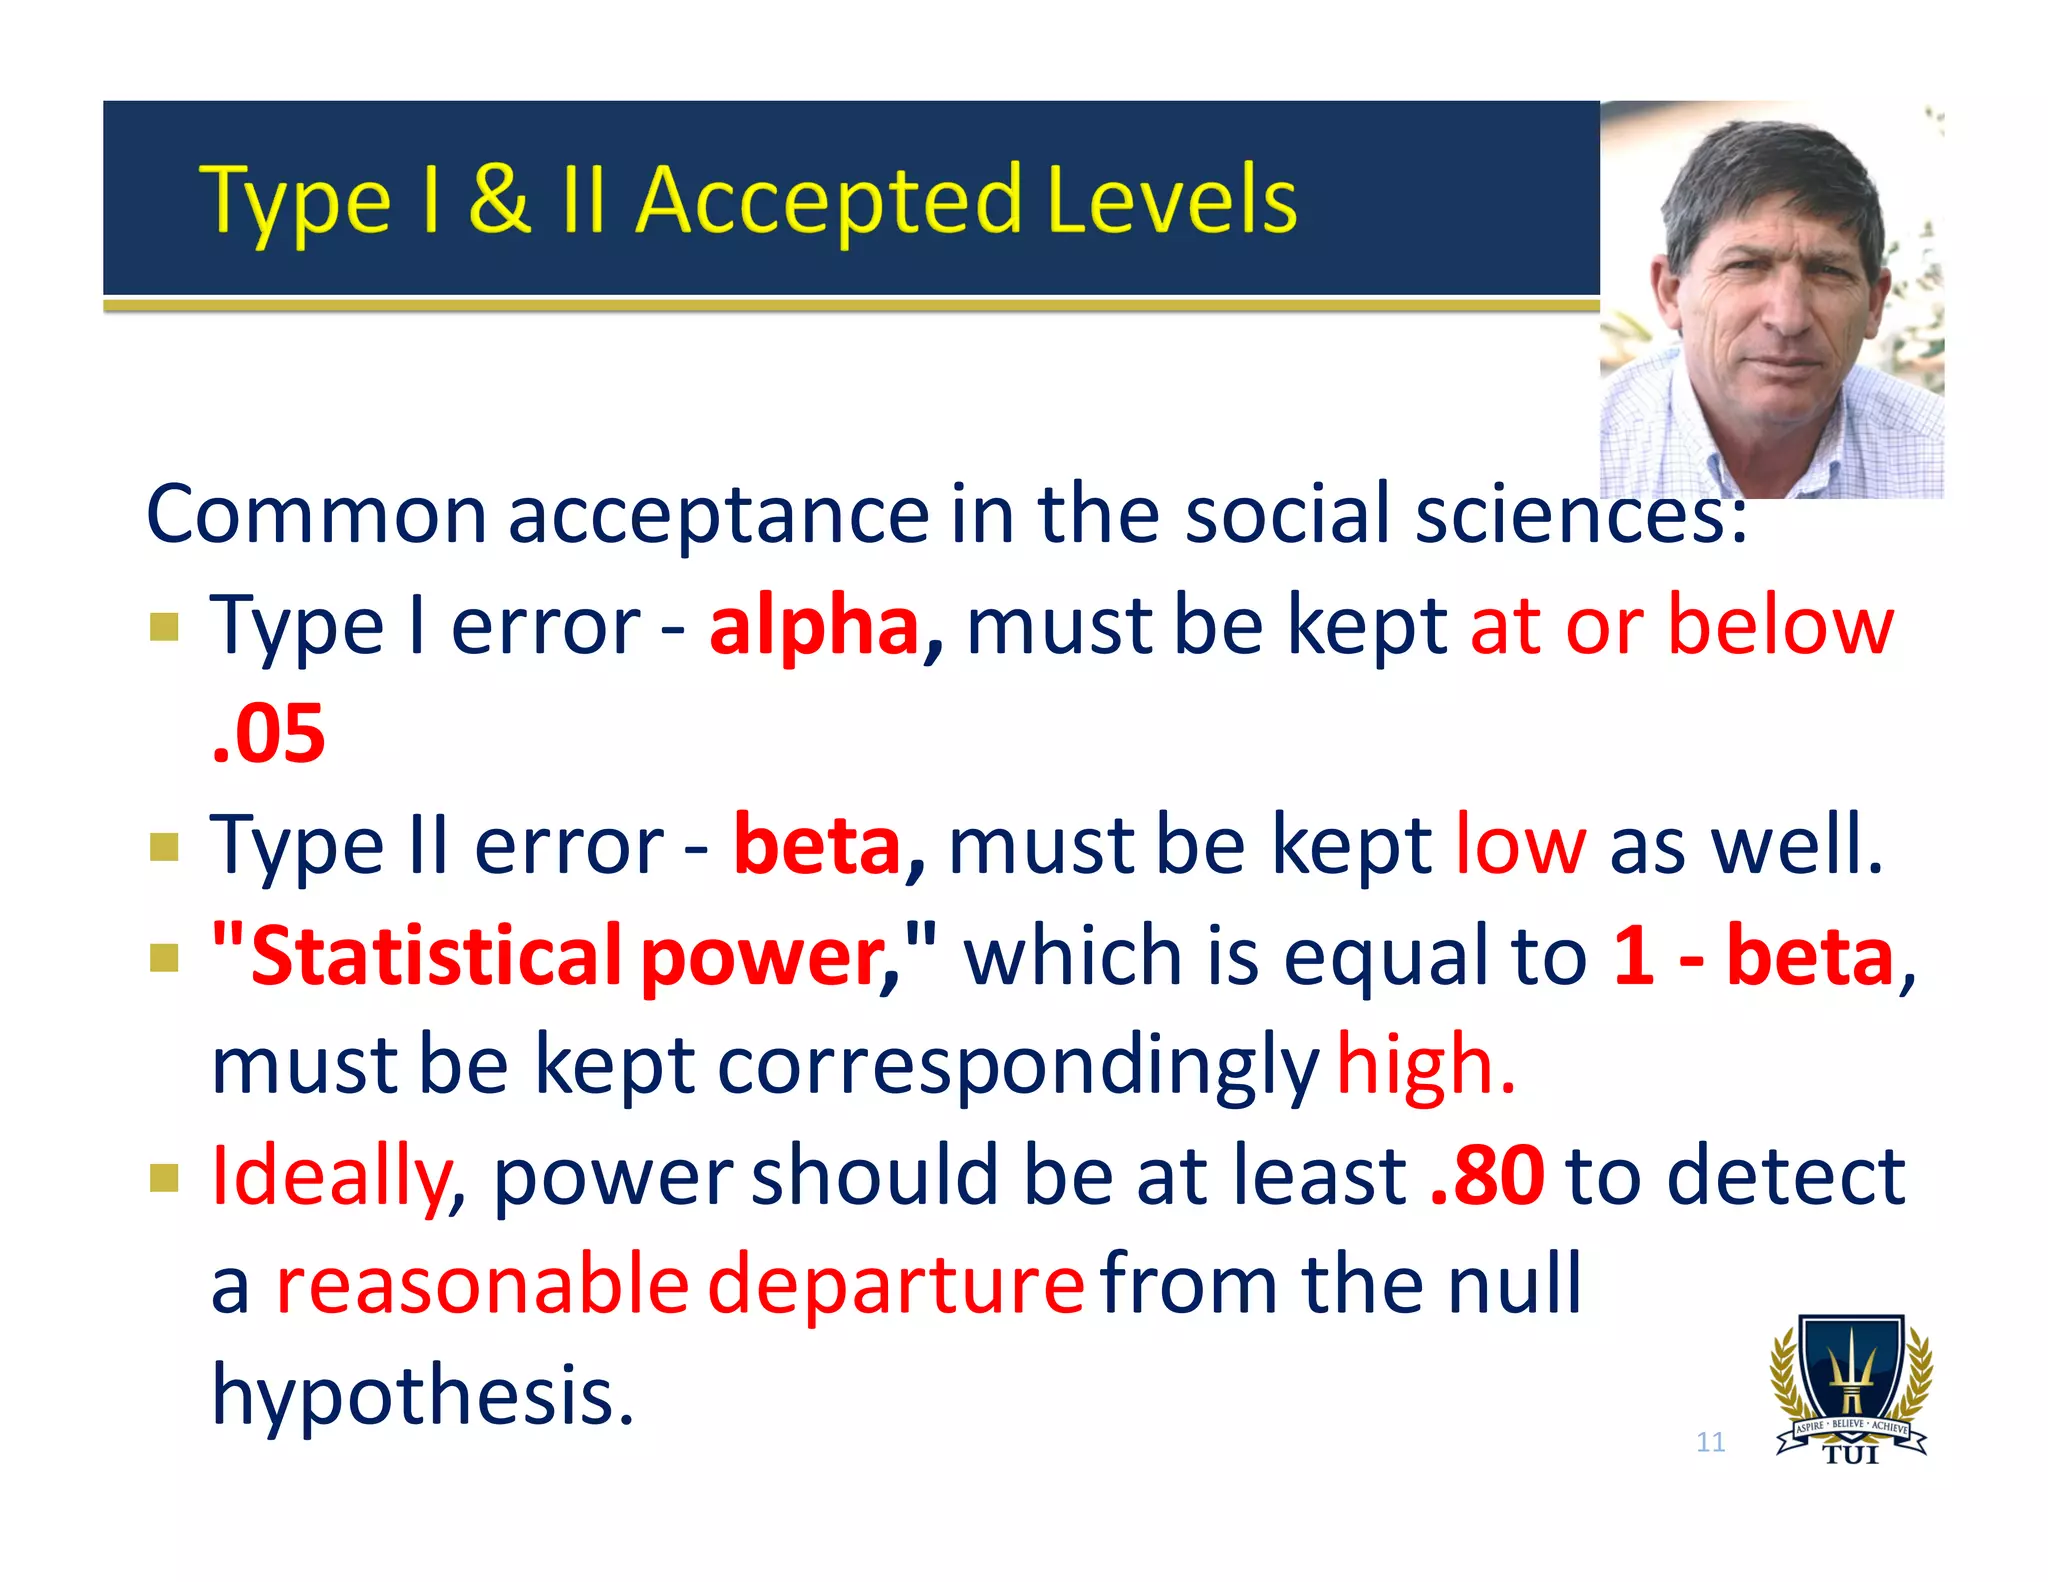
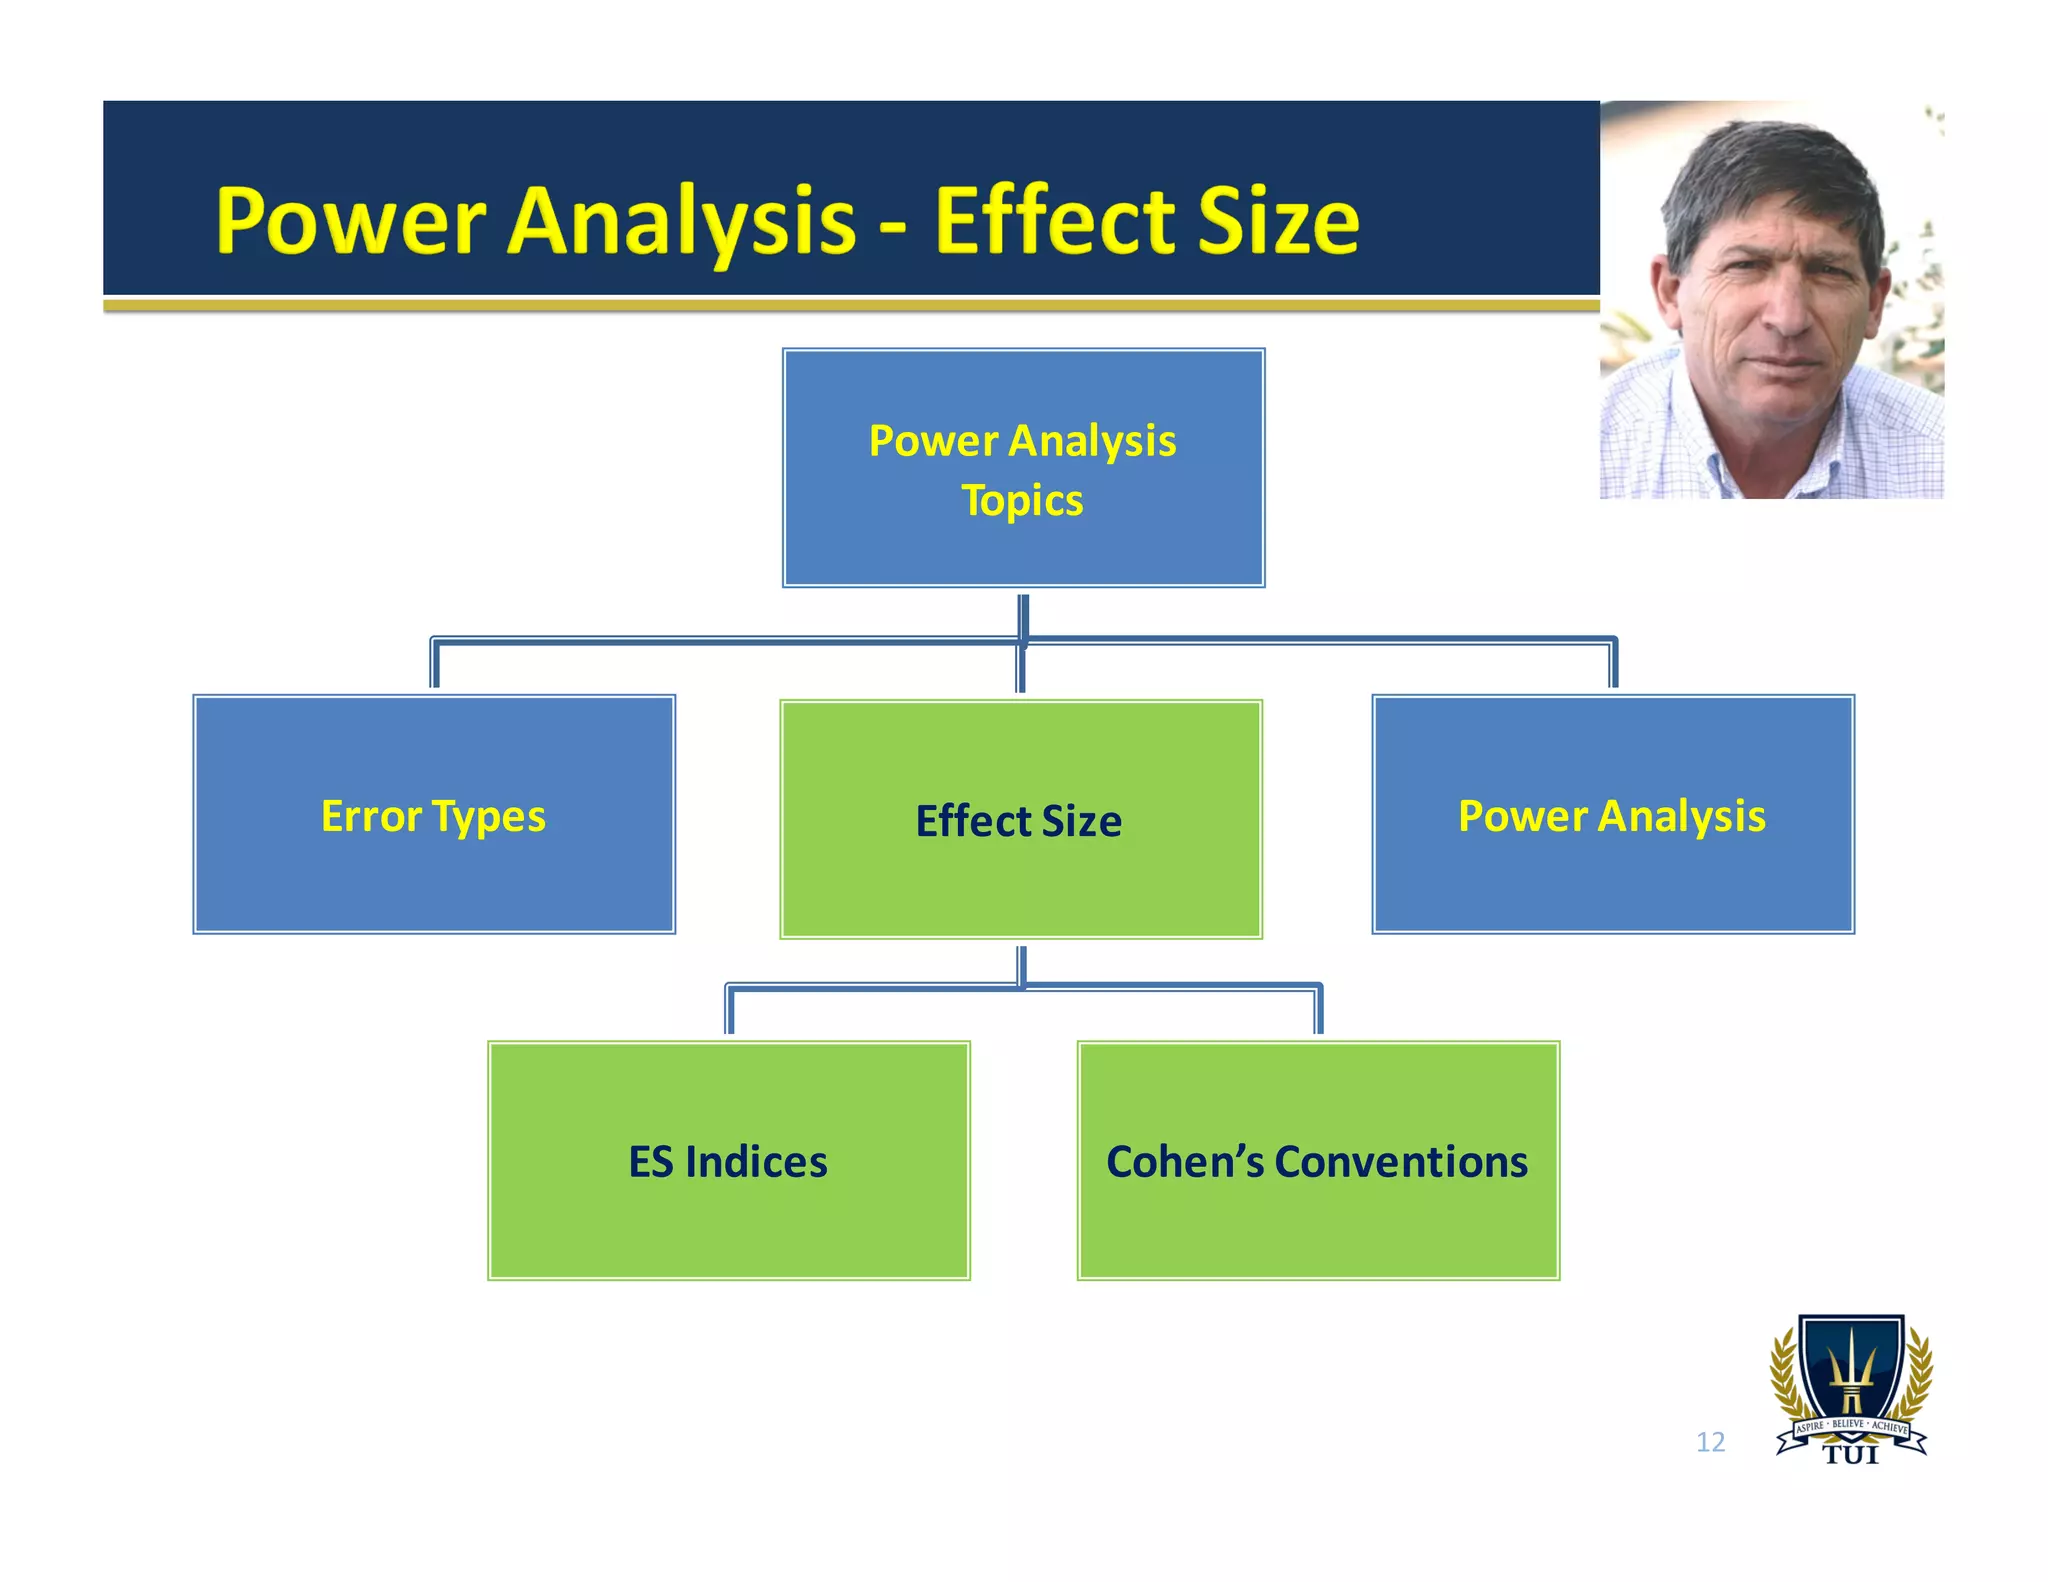
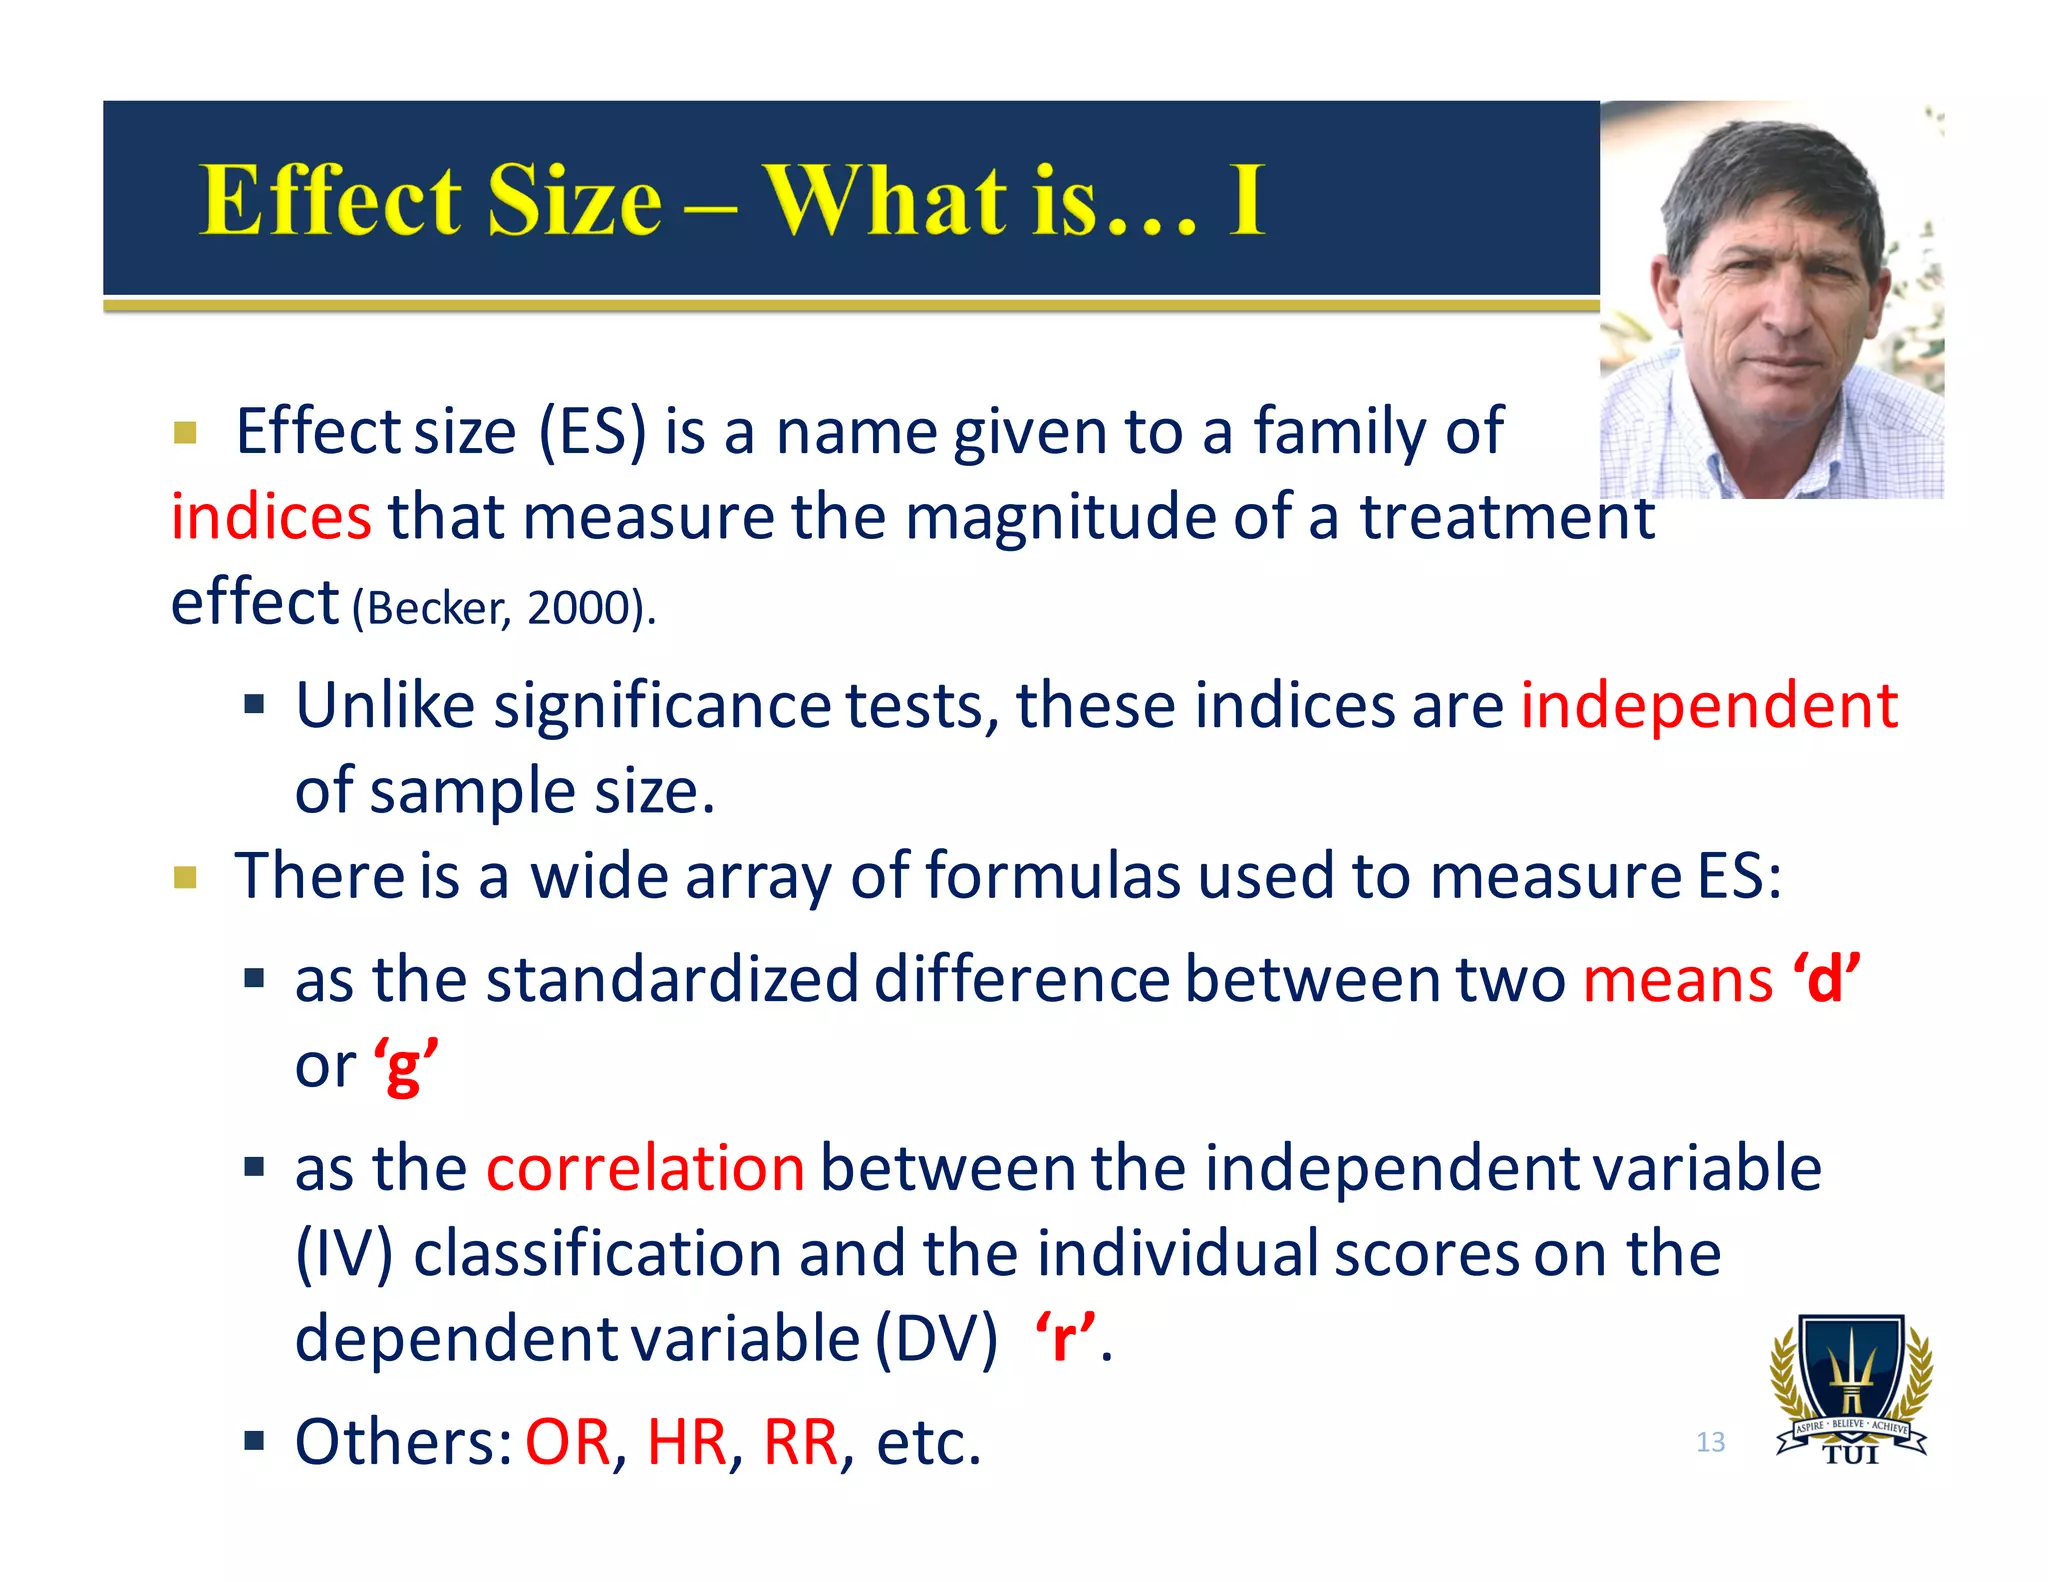
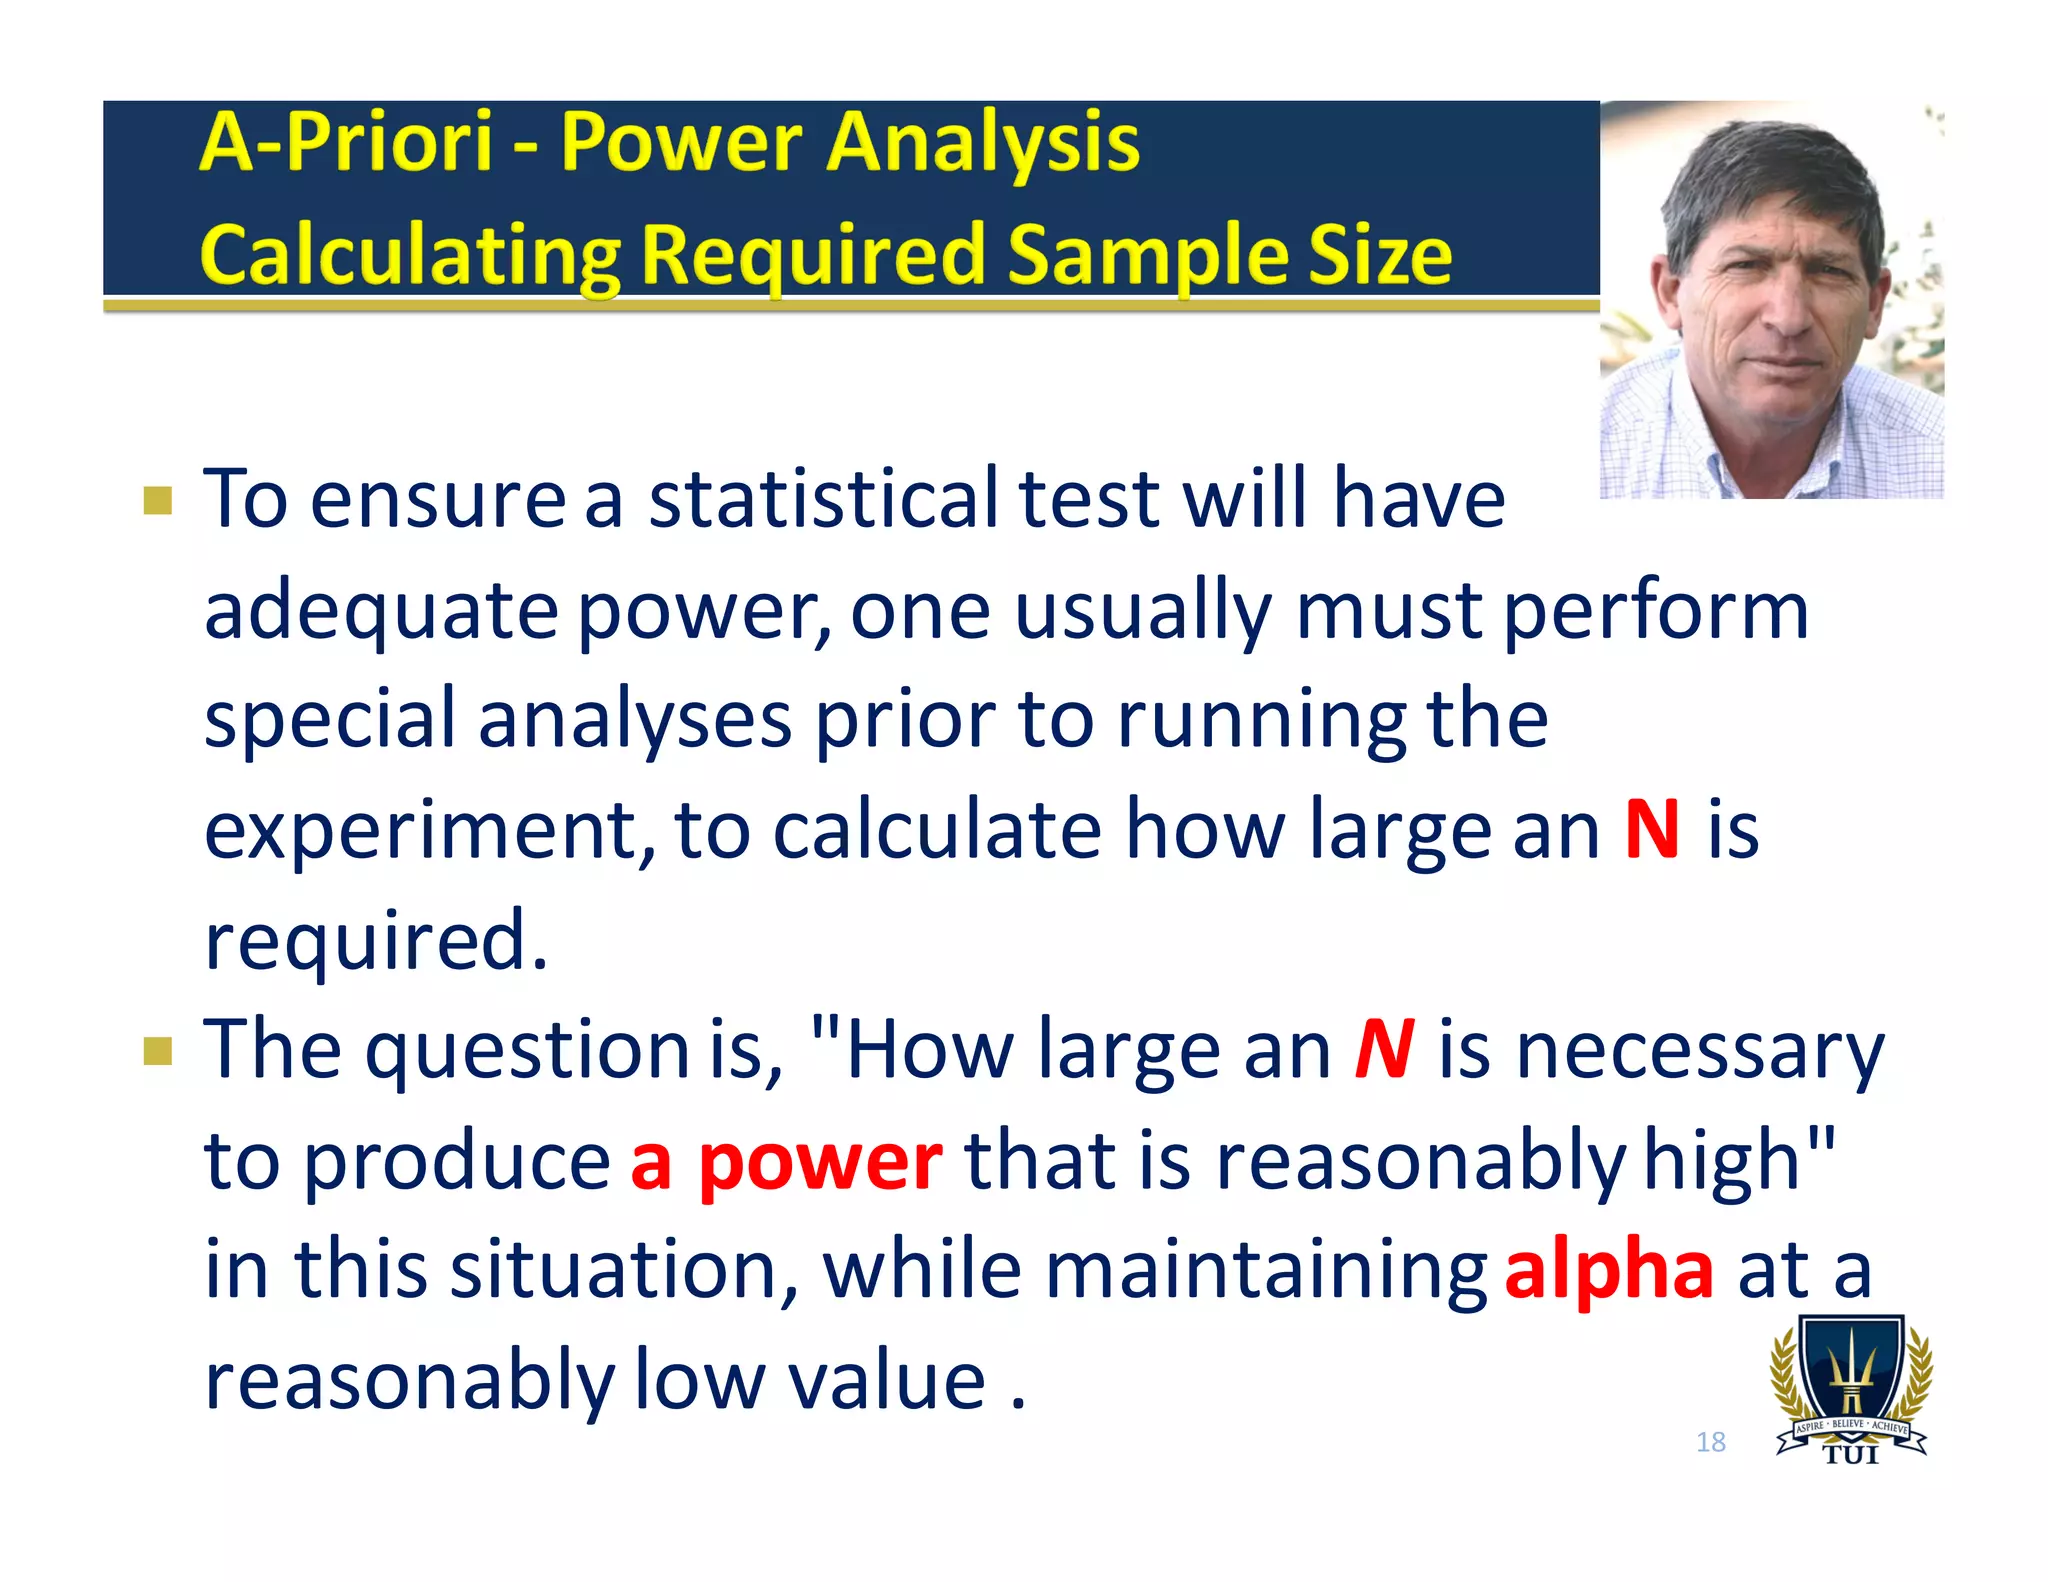
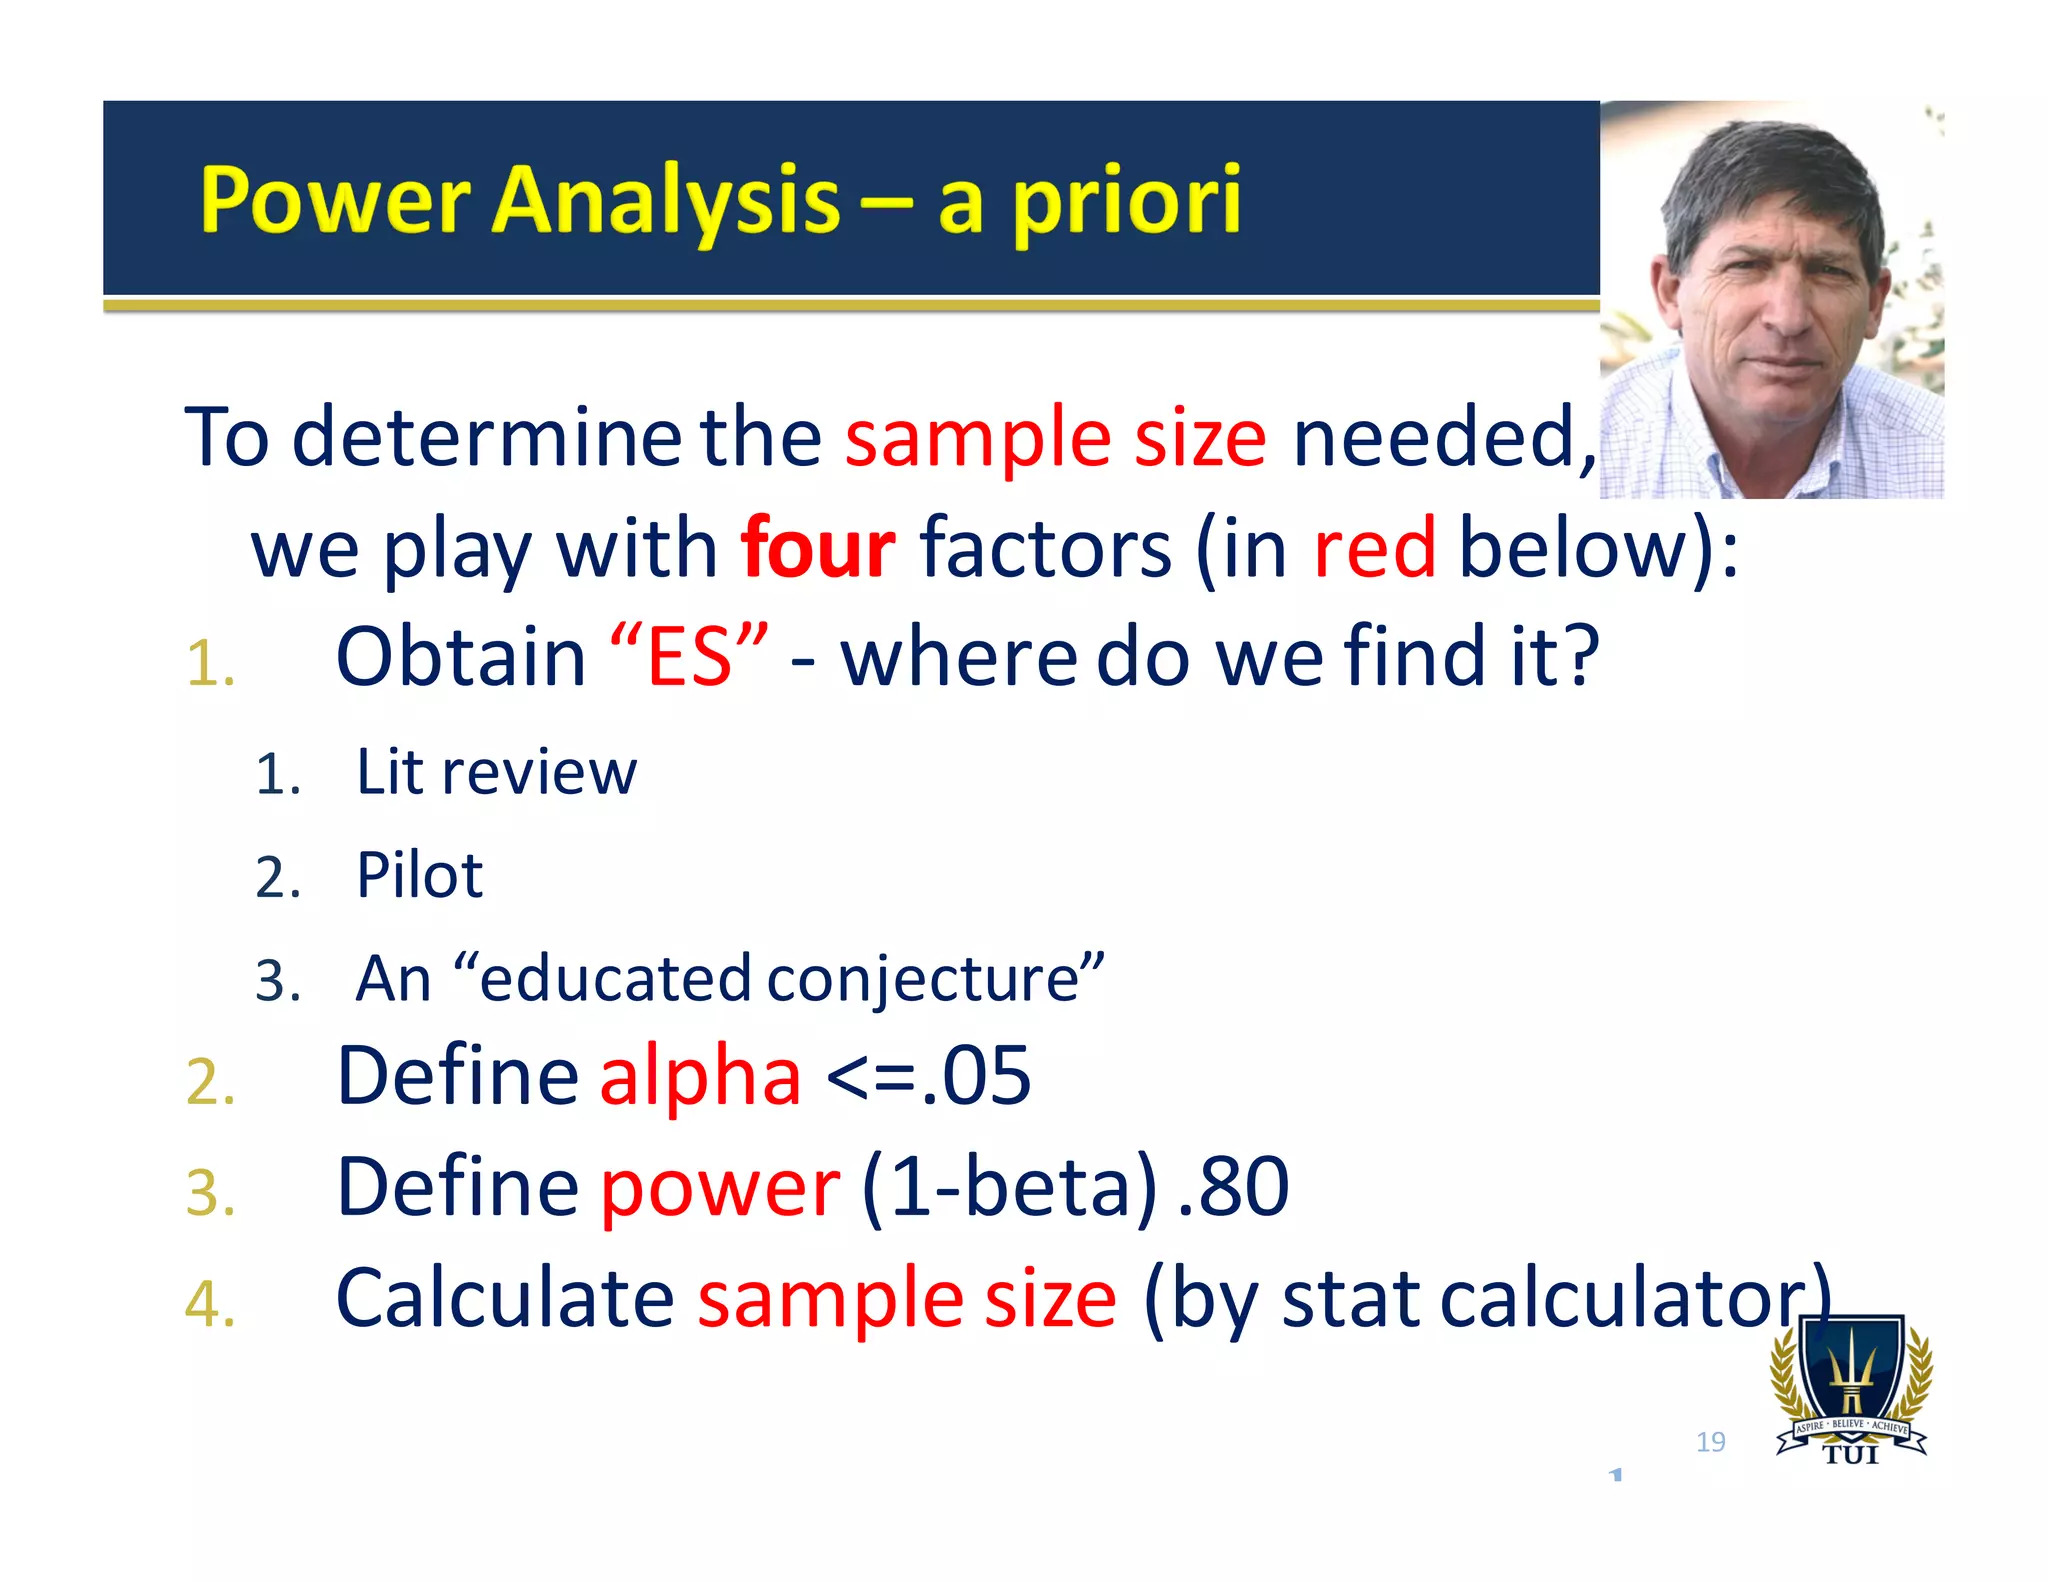
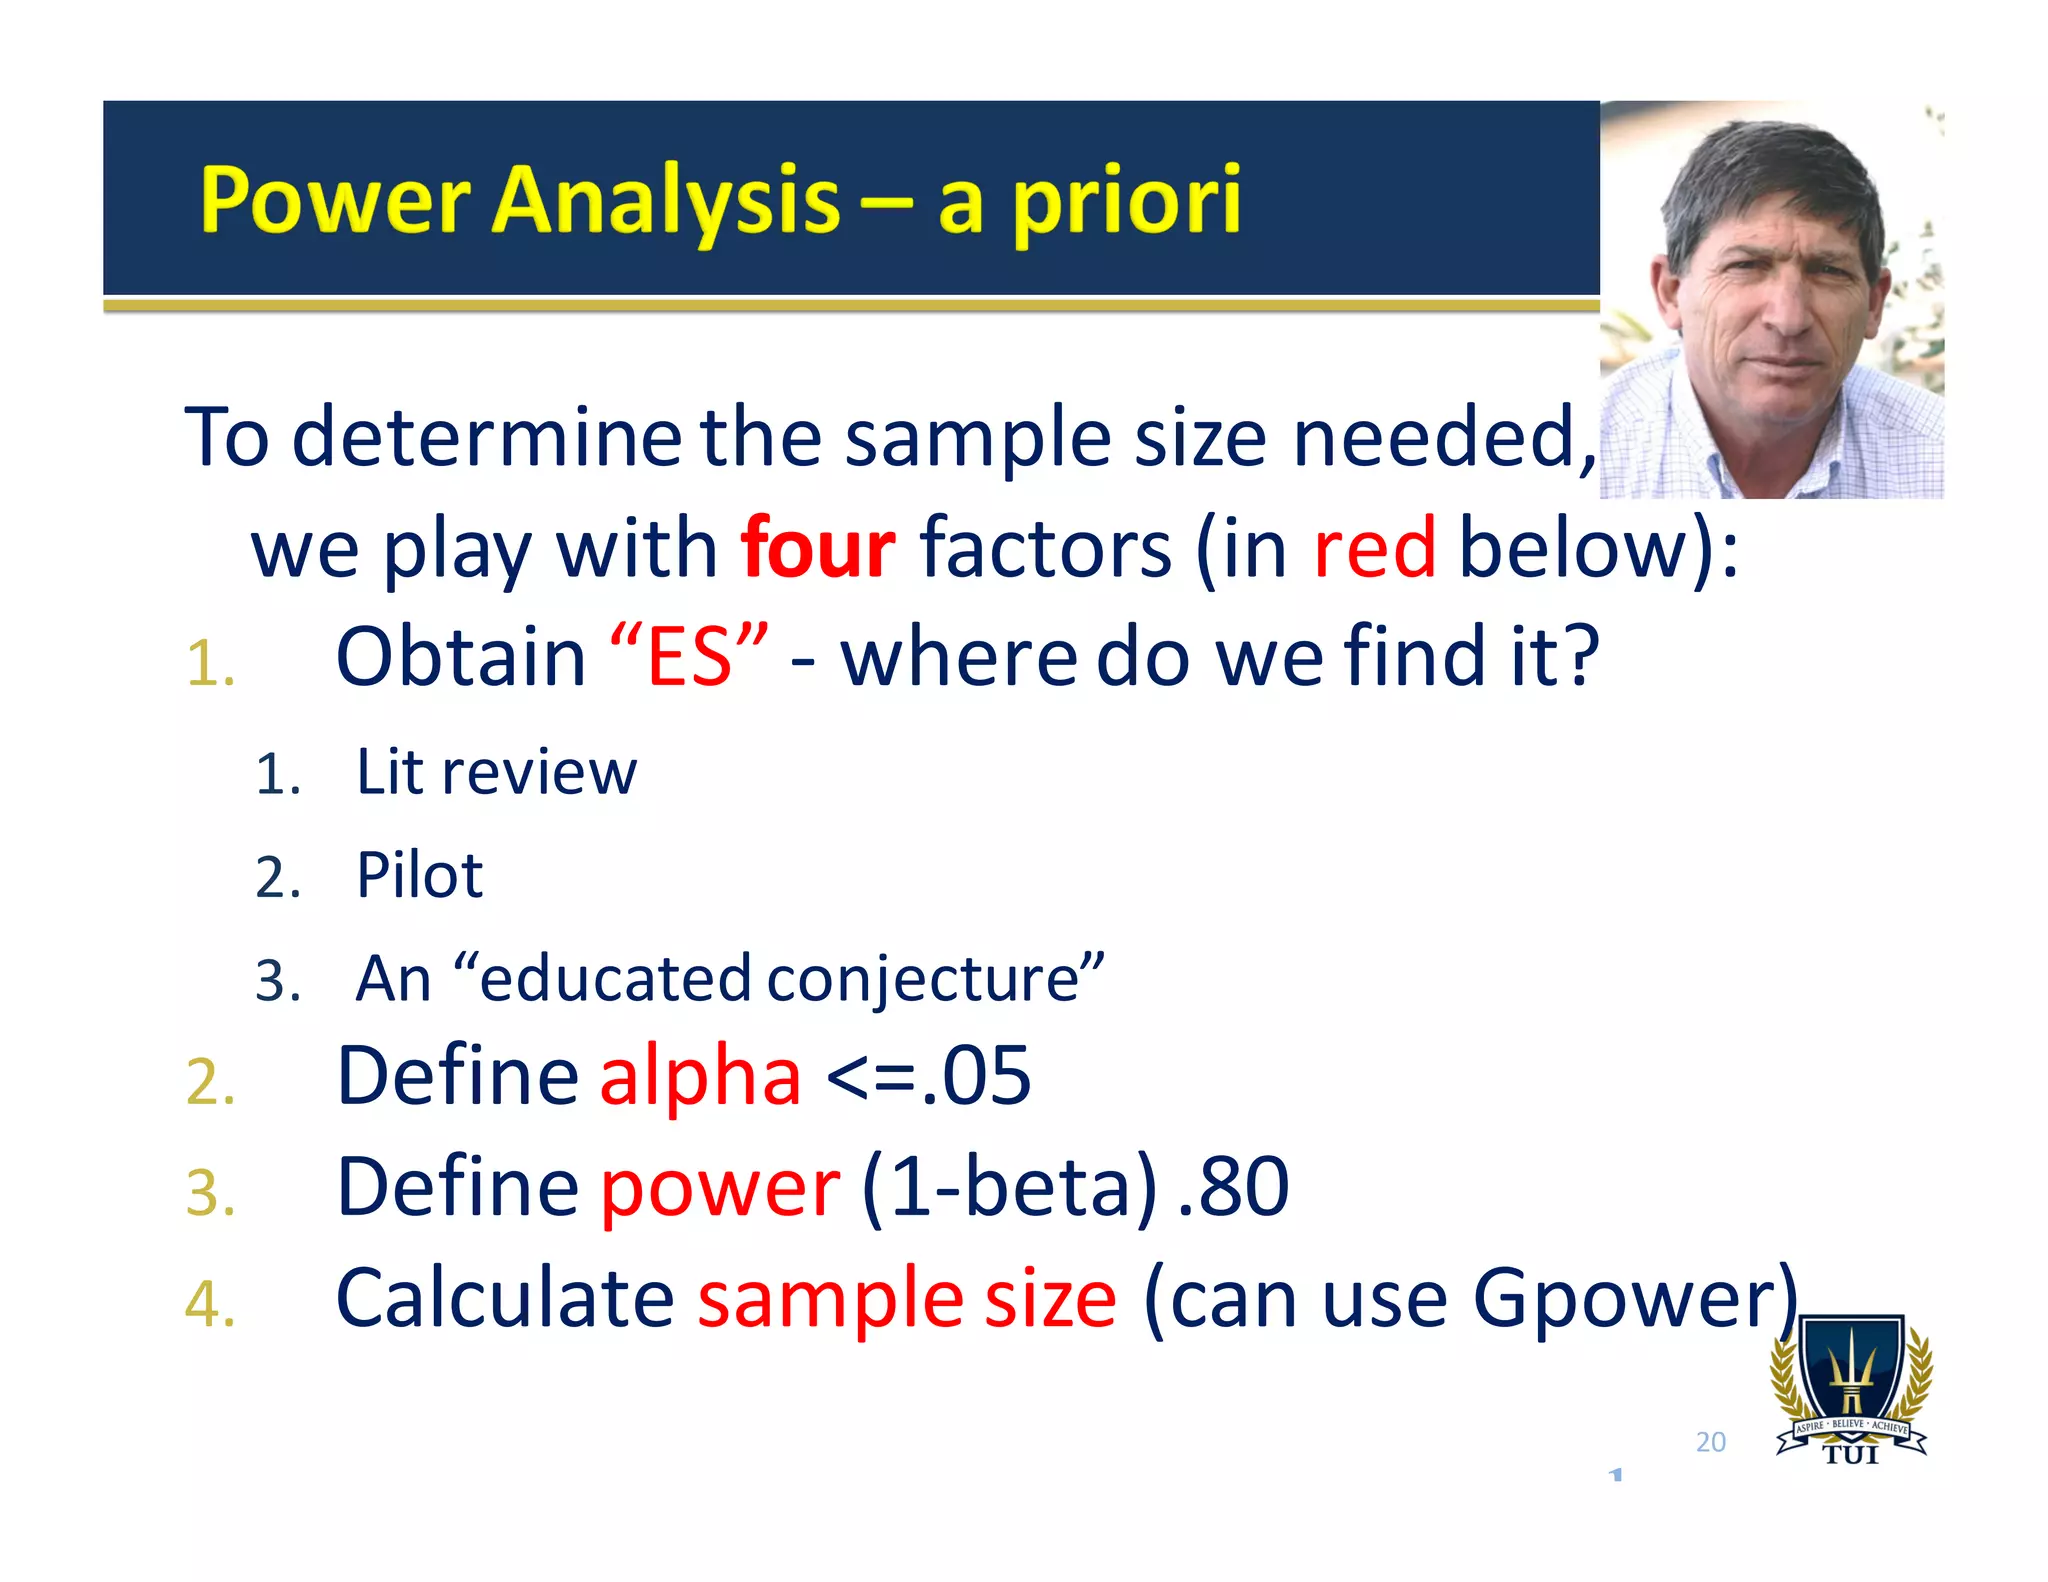
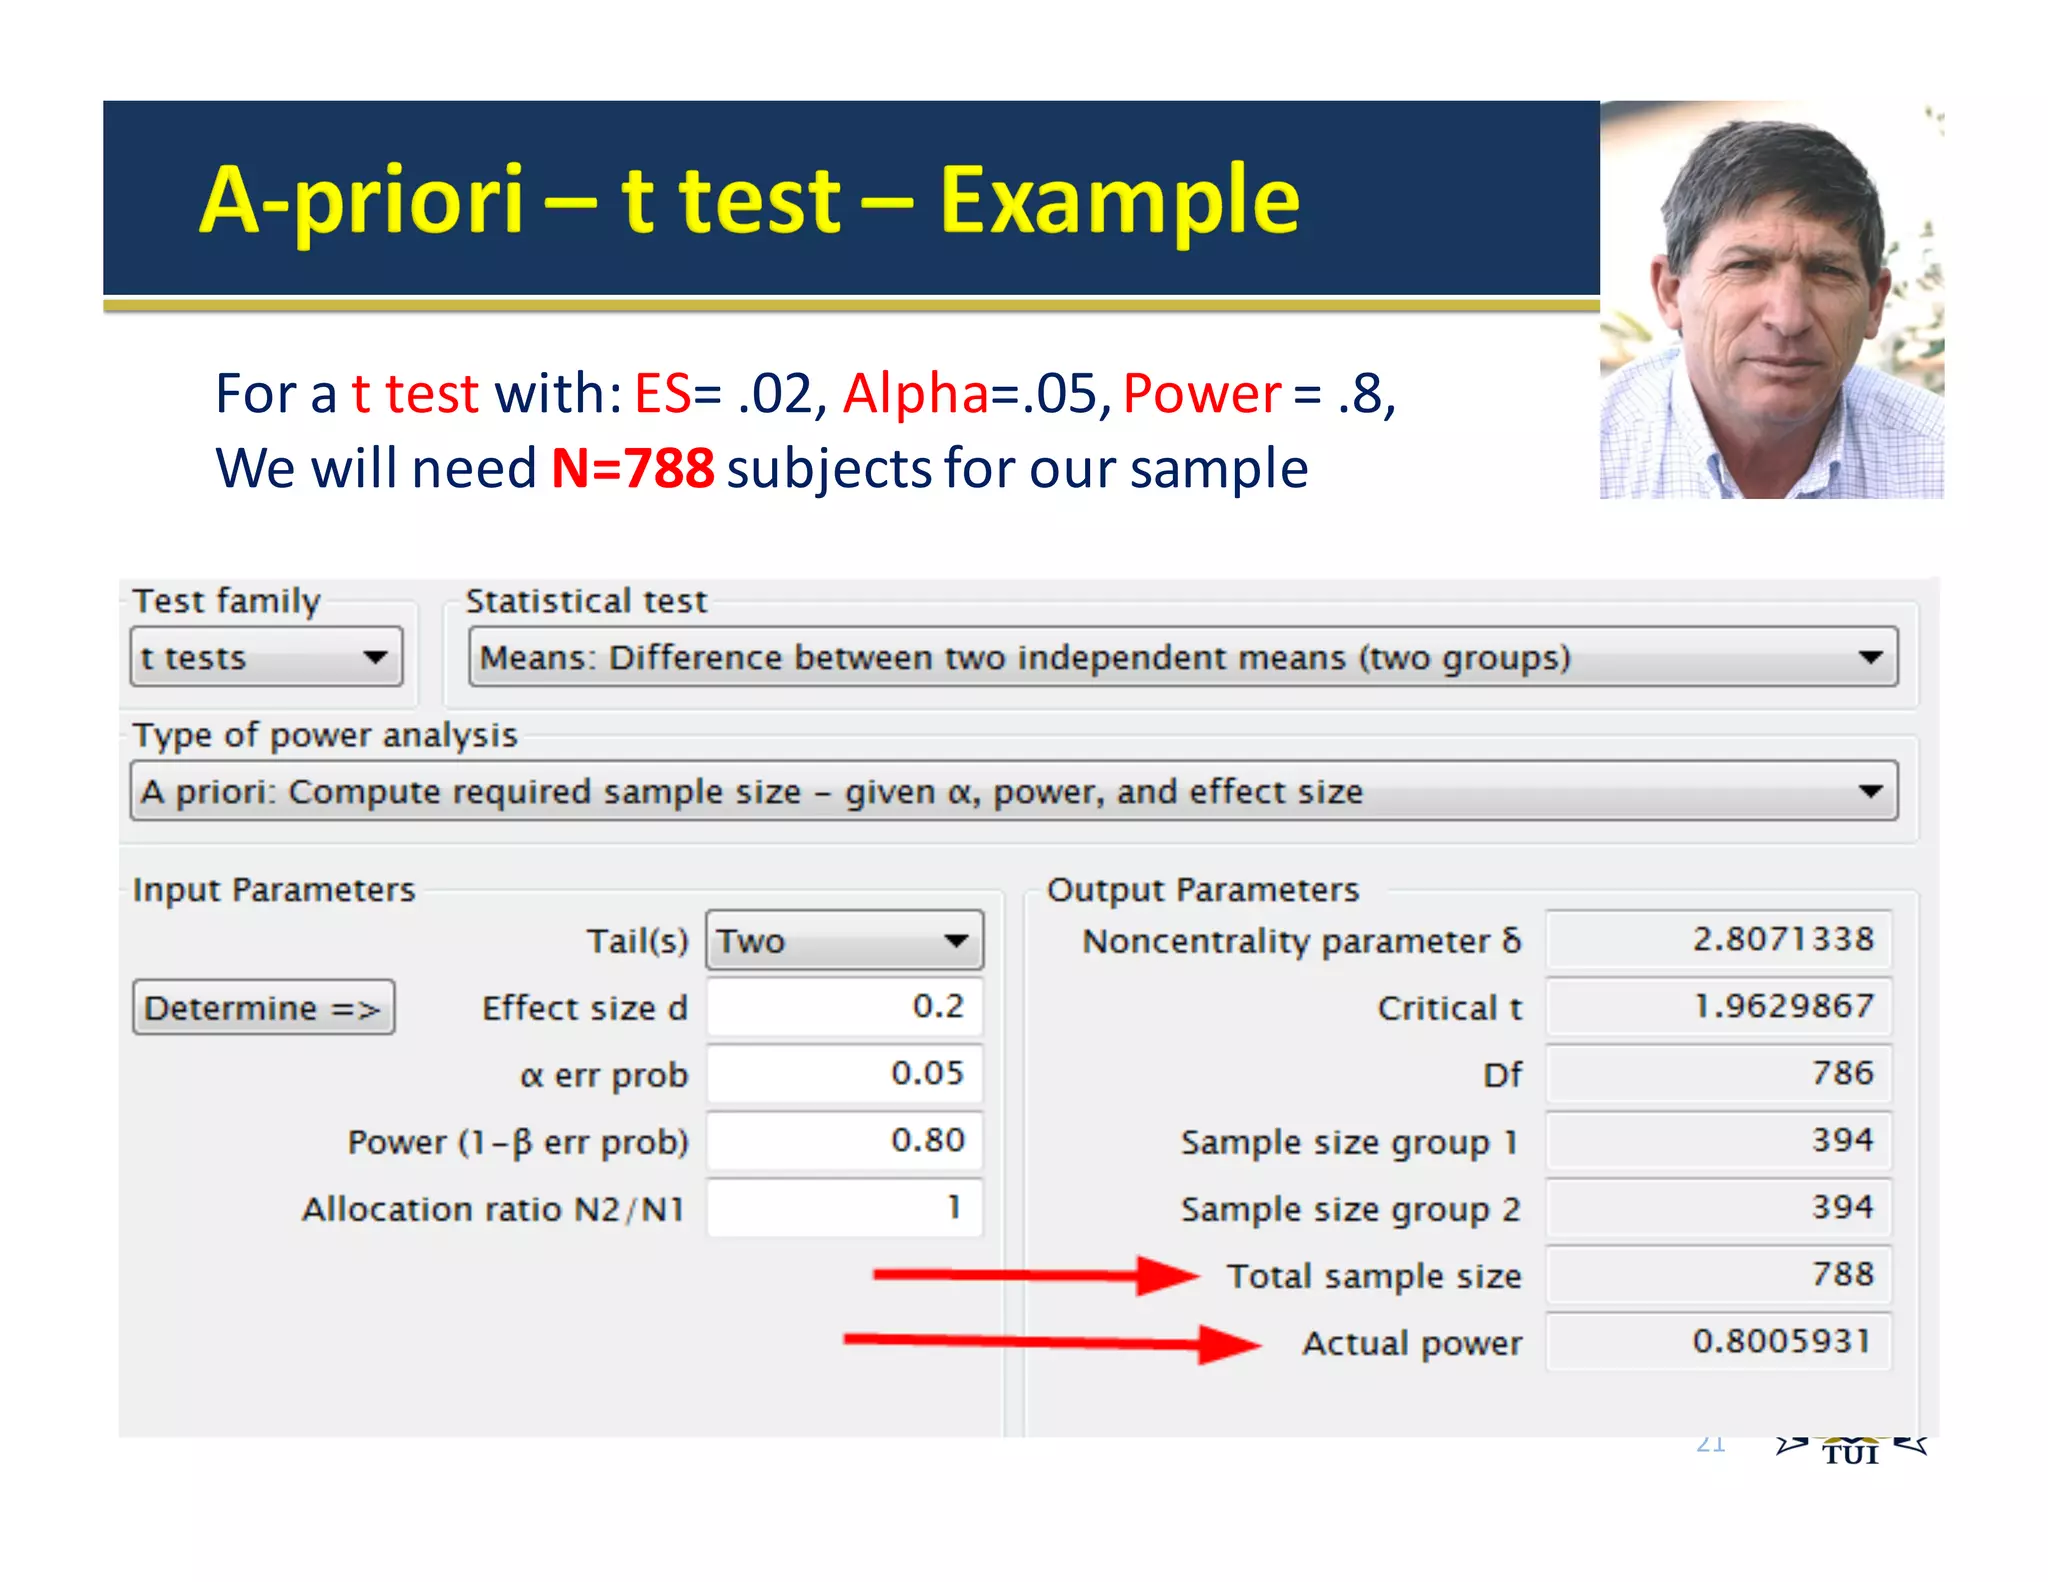


The document discusses the importance of power analysis in hypothesis testing, emphasizing its role in determining the necessary sample size and the significance of the effect size. It highlights that statistical significance (p-values) alone do not provide a complete picture of the results, and both a-priori and post-hoc analyses are essential for validating study results. Additionally, it points to the need for proper calculations to avoid Type I and II errors and underlines the concept of practical significance in research findings.


