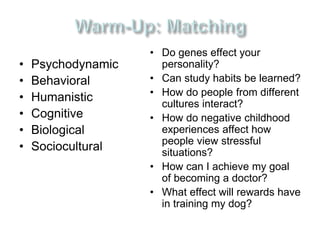
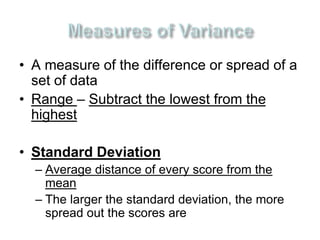
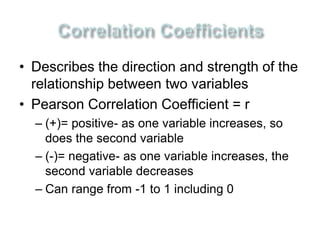
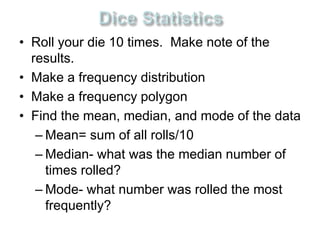
Introductory Psychology: Research DesignBrian Piper
lecture 3 from a college level introduction to psychology course taught Fall 2011 by Brian J. Piper, Ph.D. (psy391@gmail.com) at Willamette University, includes correlation and experiments
If you find this useful, don't forget to hit 'love.'
• Feist, J. & Feist, G. (2009). Theories of personality (7th ed.). USA: McGraw−Hill Companies
• Tria, D. & Limpingco. (2007). Personality (3rd ed.). Quezon City, Philippines: Ken Inc.
• Daniel, V. Object relations theory. Retrieved as of 2016 from https://www.sonoma.edu/users/d/daniels/objectrelations.html
Other references:
• Cervone, D. & Pervine, L. (2013). Personality: Theory and research (12th ed.). USA: John Wiley & Sons, Inc.
• Cloninger, S. (2004). Theories of personality: Understanding persons (4th ed.). New Jersey: Pearson Education, Inc.
• Ryckman, R. (2008).Theories of personality (9th ed.). USA: Thomson Wadsworth
All About Psychology >>
Psychology Super-Notes >> Research Methodology >> Research Methods in Psychology in Behavioral Sciences >> Hypothesis Formulation in Psychological Research
USECON: Usability, User Experience & User Interface Design (Fact Sheet) USECON
USECON bietet Ihnen Know-How, Loesungen und Beratung im strategischen Experience Management. Mit Hauptsitz in Wien sind wir ein international agierendes Unternehmen, das sich auf Beratungsleistungen für saemtliche Taetigkeiten im Rahmen der benutzerorientierten Gestaltung von interaktiven Systemen spezialisiert hat.
3 Us zum Erfolg – Usability, User Experience & User Interface Design
Usability: die einfache Benutzbarkeit komplexer Systeme und Technologien
User Experience: das ganzheitliche Erlebnis der Benutzer
User Interface Design:Analyse, Interaktionsstrategien, Konzeption, Prototyping, Grafikdesign
Experience Management
Experience Management ist für uns die Analyse, die Planung und das Design von benutzerzentrierten Erlebnissen. Um diese Erlebnisse zu kreieren, bieten wir benutzerfreundliche Loesungen für alle Systeme und Umgebungen – von Web und Software bis hin zu mobilen Anwendungen und Sprachsystemen, Automaten, Werbemitteln, Styleguides oder Erlebnisraeumen. Im Fokus steht der Mensch mit all seinen Beduerfnissen, Erwartungen und Verhaltensweisen in unterschiedlichen Kontexten und Situationen.
Wir unterstuetzen Sie im Bereich des Experience Managements und begleiten Sie durch den gesamten Prozess Ihres Projekts oder stehen Ihnen bei einzelnen Projektphasen zur Seite
Parque Nacional Sierra de Guadarrama; "Diagnóstico" de situación vertiente de...majsm
Presentación realizada por Miguel Ángel Jara en Navacerrada en las II Jornadas Parque Nacional Sierra de Guadarrama.
Incluye Visión 2031 Parque Nacional Sierra de Guadarrama, así como el pensamiento vecinal en 1934 y ahora. Es fundamental trabajar pensando en el medio plazo.
El gran área Metropolitana de Madrid cuenta con el enorme privilegio de disponer de un Parque Nacional muy próximo, que lo hace singular respecto al resto espacios integrados en la Red de Parques Nacionales. A finales del Siglo XIX la Institución Libre de Enseñanza salió de las aulas para estudio del medio natural en la Sierra de Guadarrama, ahora es el momento de venir, conocer, valorar, disfrutar y proteger la Sierra de Guadarrama.
En Adesgam, nos gustaría contribuir activamente, junto con el resto de agentes públicos y privados del ámbito territorial del Parque Nacional de la Sierra de Guadarrama, y del empuje de toda la sociedad madrileña, a que la primera generación nacida en la mayor concentración urbana de España que alcance la mayoría de edad en 2031, a la vez que el Parque Nacional, sea una generación que conozca, valore, disfrute y proteja la Sierra de Guadarrama, en definitiva, la generación mejor formada en valores y sensibilidad ambiental de España. Una generación dispuesta a difundir esos valores a sus hijos y por supuesto por todo lugar y país al que vaya.
Para ello, contamos con el privilegio de disponer de un Parque Nacional a la puerta del área metropolitana madrileña, donde el camino para la consecución del objetivo anteriormente señalado, debe producir el desarrollo socioeconómico responsable de los municipios del área de influencia socioeconómica y limítrofes
2. • Psychodynamic
• Behavioral
• Humanistic
• Cognitive
• Biological
• Sociocultural
• Do genes effect your
personality?
• Can study habits be learned?
• How do people from different
cultures interact?
• How do negative childhood
experiences affect how
people view stressful
situations?
• How can I achieve my goal
of becoming a doctor?
• What effect will rewards have
in training my dog?
3. Hindsight Bias
Hindsight Bias is the “I-knew-it-all-along”
phenomenon.
After learning the outcome of an event,
many people believe they could have
predicted that very outcome. We only knew
the dot.com stocks would plummet after
they actually did plummet.
4. Overconfidence
Sometimes we think we
know more than we
actually know.
Anagram
WREAT WATER
ETYRN ENTRY
GRABE BARGE
How long do you think it
would take to unscramble
these anagrams?
People said it would take
about 10 seconds, yet on
average they took about 3
minutes (Goranson, 1978).
5. Critical Thinking
Critical thinking does
not accept arguments
and conclusions blindly.
It examines
assumptions, discerns
hidden values,
evaluates evidence and
assesses conclusions.
The Amazing Randi
Courtesy of the James Randi Education Foundation
6. Scientific Method
Psychologists, like all scientists, use the
scientific method to construct theories that
organize, summarize and simplify
observations.
7. Hypothesis
A Hypothesis is a testable prediction, that
describes the relationship between two
variables.
They are often prompted by a theory, to
enable us to accept, reject or revise the
theory.
8. • Observe in a natural setting without
interfering
• Example: Rosenhan’s Mental Hospital Study
(1973)
– Pseudopatients checked themselves into
mental institutions and faked schizophrenia
– Demonstrated that normal people cannot
be distinguished from the mentally ill
– “If they are here, they must be crazy”
– People who are treated in a certain way
over time may begin to behave that way
9. • Involve an intensive investigation of one or
more participants
– Results cannot prove or disprove
anything, but can be used to generate
new hypotheses
– Used by Freud
• Anna O.
10. • Information is obtained by asking many
individuals a fixed set of questions
– Can include both interviews and
questionnaires
• Interviews allow for modification
• Questionnaires take less time and reduce
the possibility the researcher will influence
the participant
11. How Surveys are conducted
• Establish your population.
• Population: all people with the
characteristics a researcher wants to
study.
• Example: all high school seniors in the
U.S., all retired teachers in Rhode Island
12. How Surveys are Conducted
cont.
• Most populations are too large to study.
Therefore, samples are drawn from the
populations.
• Sample: a limited number of cases drawn
from the larger population.
13. How Surveys are Conducted
cont.
• representative sample: sample that
accurately reflects the characteristics of
the population
• The most common way to gather a
representative sample is by random, or
chance.
14. • Studying the same group of people
at regular intervals over a period of
years to assess how certain
characteristics change or remain the
same during development
– Minnesota Twin Family Study
• Twins reared apart study- twin similarities are a
result of genes
• Able to estimate the heritability of
traits
15. Cross-Sectional Study
• A research technique that compares
individuals from different age groups
at one time
• Study a number of subjects from different
age groups and then compare the results
• Cheaper, easier than longitudinal studies, but
group differences may be due to factors other
than development.
17. Correlation
• This is the measure of a relationship
between two variables or sets of data.
• When one trait or behavior accompanies
another, we say the two correlate.
• CORRELATION DOES NOT EQUAL
CAUSATION!
• Can be positive or negative
• Example: vaccines and autism
– The majority of autistic children are diagnosed between the ages
of 18 months and 3 years old.
– Children receive many immunizations in this same period of
time.
18. Correlation
When one trait or behavior accompanies
another, we say the two correlate.
Correlation
coefficient
Indicates strength
of relationship
(0.00 to 1.00)
r = +0.37
Indicates direction
of relationship
(positive or negative)
Correlation Coefficient is a
statistical measure of the
relationship between two
variables.
19. Scatterplots
Perfect positive
correlation (+1.00)
Scatterplot is a graph comprised of points that are
generated by values of two variables. The slope of
the points depicts the direction, while the amount
of scatter depicts the strength of the relationship.
20. Scatterplots
Perfect negative No relationship (0.00)
correlation (-1.00)
The Scatterplot on the left shows a negative correlation,
while the one on the right shows no relationship between
the two variables.
21. Correlations
•Range from -1.00 to +1.00
–The greater distance from 0, the stronger
the correlation
•Positive correlations indicate that as one
variable increases, the other increases
too
•Negative correlations indicate that as
one variable increases, the other
decreases
22.
23.
24. • One young woman died in fear in a most
peculiar way: When she was born on
Friday the 13th, the midwife who delivered
her and two other babies announced that
all three were hexed and would die before
their 23rd birthday. The other two did die
young. As the third woman approached
her 23rd birthday, she checked into a
hospitals and informed the staff of her
fears. The staff noted that she dealt with
her anxiety by extreme hyperventilation
(deep breathing). Shortly after her
birthday, she hyperventilated to death.
25. • A situation in which a researcher’s
expectations influence that person’s own
behavior, and thereby influence the
participant’s behavior
– We consciously or unconsciously tip off
people to what are expectations are; people
pick up on those cues and act as expected.
27. Independent Variable
An Independent Variable is a factor
manipulated by the experimenter. The
effect of the independent variable is the
focus of the study.
28. Dependent Variable
A Dependent Variable is a factor that
may change in response to an
independent variable. In psychology, it
is usually a behavior or a mental process.
29. Experimental Group
• The participants in an experiment
who are exposed to the independent
variable
• Also called the experimental condition
• The group being studied and compared to the
control group
30. Control Group
• The participants in an experiment
who are not exposed to the
independent variable
• Results are compared to those of the
experimental group
• Also called the control condition
31. • Enables the investigator to control the
situation and decrease the possibility that
outside variables will influence the results
– Hypothesis
– Variables (Independent and Dependent)-
If/then
– Experimental Group and Control Group
– Results must be replicated
32. • Methods of conduct or standards for
proper behavior
– Informed consent
– Protection from harm
– Confidentiality
– Debriefing
33. • Single-Blind Experiment- participants
are unaware of which participants received
the treatment
• Double-Blind Experiment- neither the
experimenter nor the participants know
which patient received which treatment
– Drug evaluation studies
34. • 1960- Would participants administer painful
shocks to others merely because an authority
figure had instructed them to do so?
– 2000 male participants
– Told they were participating in a study on
learning
– Each time the learner made a mistake, the
“teacher” was ordered to push a button to
deliver an electric shock
– Shocks were false, but they did not realize
this because the learners displayed distress
and pain
35. • 65% of the volunteers pushed the shock
button until they reached maximum
severity
• Implied that ordinary individuals could
easily inflict pain on others if such
issues were ordered by an authority
figure.
• Ethical issues?
• Replication?
– Has been replicated with young, liberal
college students
37. • A change in the participant’s illness or
behavior that results from a belief that the
treatment will have an effect, rather than
the actual treatment
•
38.
39. • What type of correlation did we find
between height and shoe size?
• What would a graph of a negative
correlation look like? No correlation?
• What intervening variables might have
been at work affecting our results?
40. • The branch of mathematics concerned
with summarizing and making meaningful
inferences from collections of data
41. • The listing and summarizing of data in a
practical and efficient way, such as
through graphs and averages
45. • A measure of the difference or spread of a
set of data
• Range – Subtract the lowest from the
highest
• Standard Deviation
– Average distance of every score from the
mean
– The larger the standard deviation, the more
spread out the scores are
46.
47. • Describes the direction and strength of the
relationship between two variables
• Pearson Correlation Coefficient = r
– (+)= positive- as one variable increases, so
does the second variable
– (-)= negative- as one variable increases, the
second variable decreases
– Can range from -1 to 1 including 0
48. • Roll your die 10 times. Make note of the
results.
• Make a frequency distribution
• Make a frequency polygon
• Find the mean, median, and mode of the data
– Mean= sum of all rolls/10
– Median- what was the median number of
times rolled?
– Mode- what number was rolled the most
frequently?
Editor's Notes
OBJECTIVE 1| Describe hindsight bias and explain how it can make research findings seem like mere common sense.
“Anything seems commonplace, once explained.” Dr. Watson to Sherlock Holmes.
Two phenomena – hindsight bias and judgmental overconfidence – illustrate why we cannot rely solely on intuition and common sense.
OBJECTIVE 2| Describe how overconfidence contaminates our everyday judgments.
OBJECTIVE 4| Describe how psychological theories guide scientific research.
OBJECTIVE 8| Describe positive and negative correlations and explain how correlational measures can aid the process of prediction.
OBJECTIVE 14| Explain the difference between an independent variable and a dependent variable.