This document provides an overview of key concepts in psychology including:
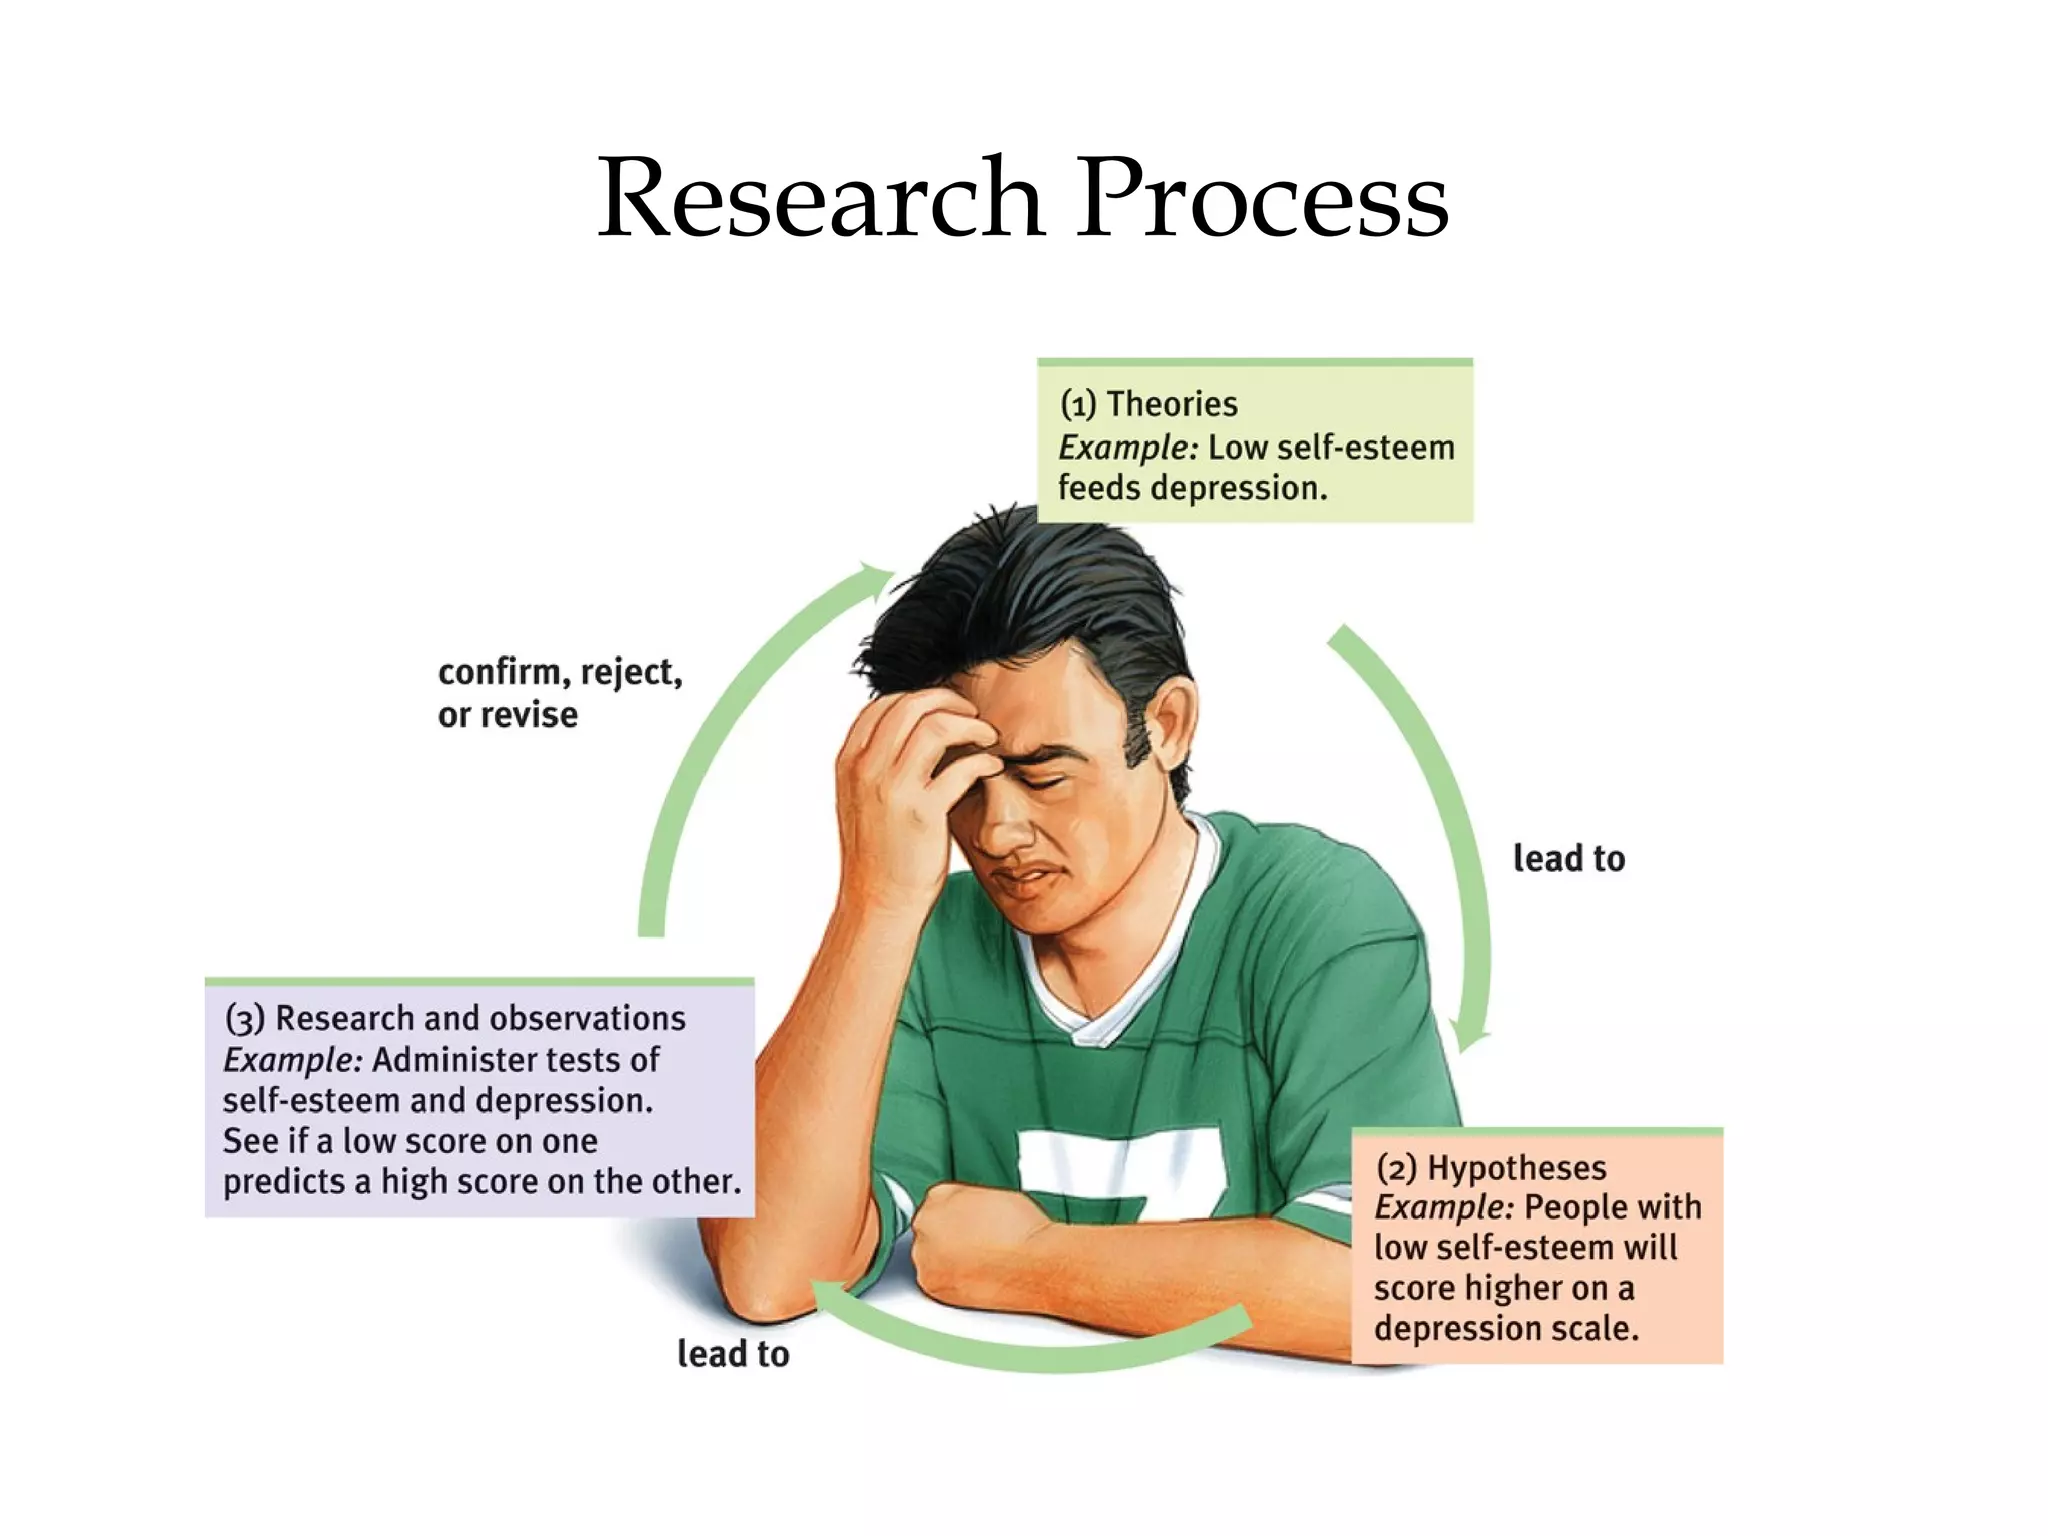
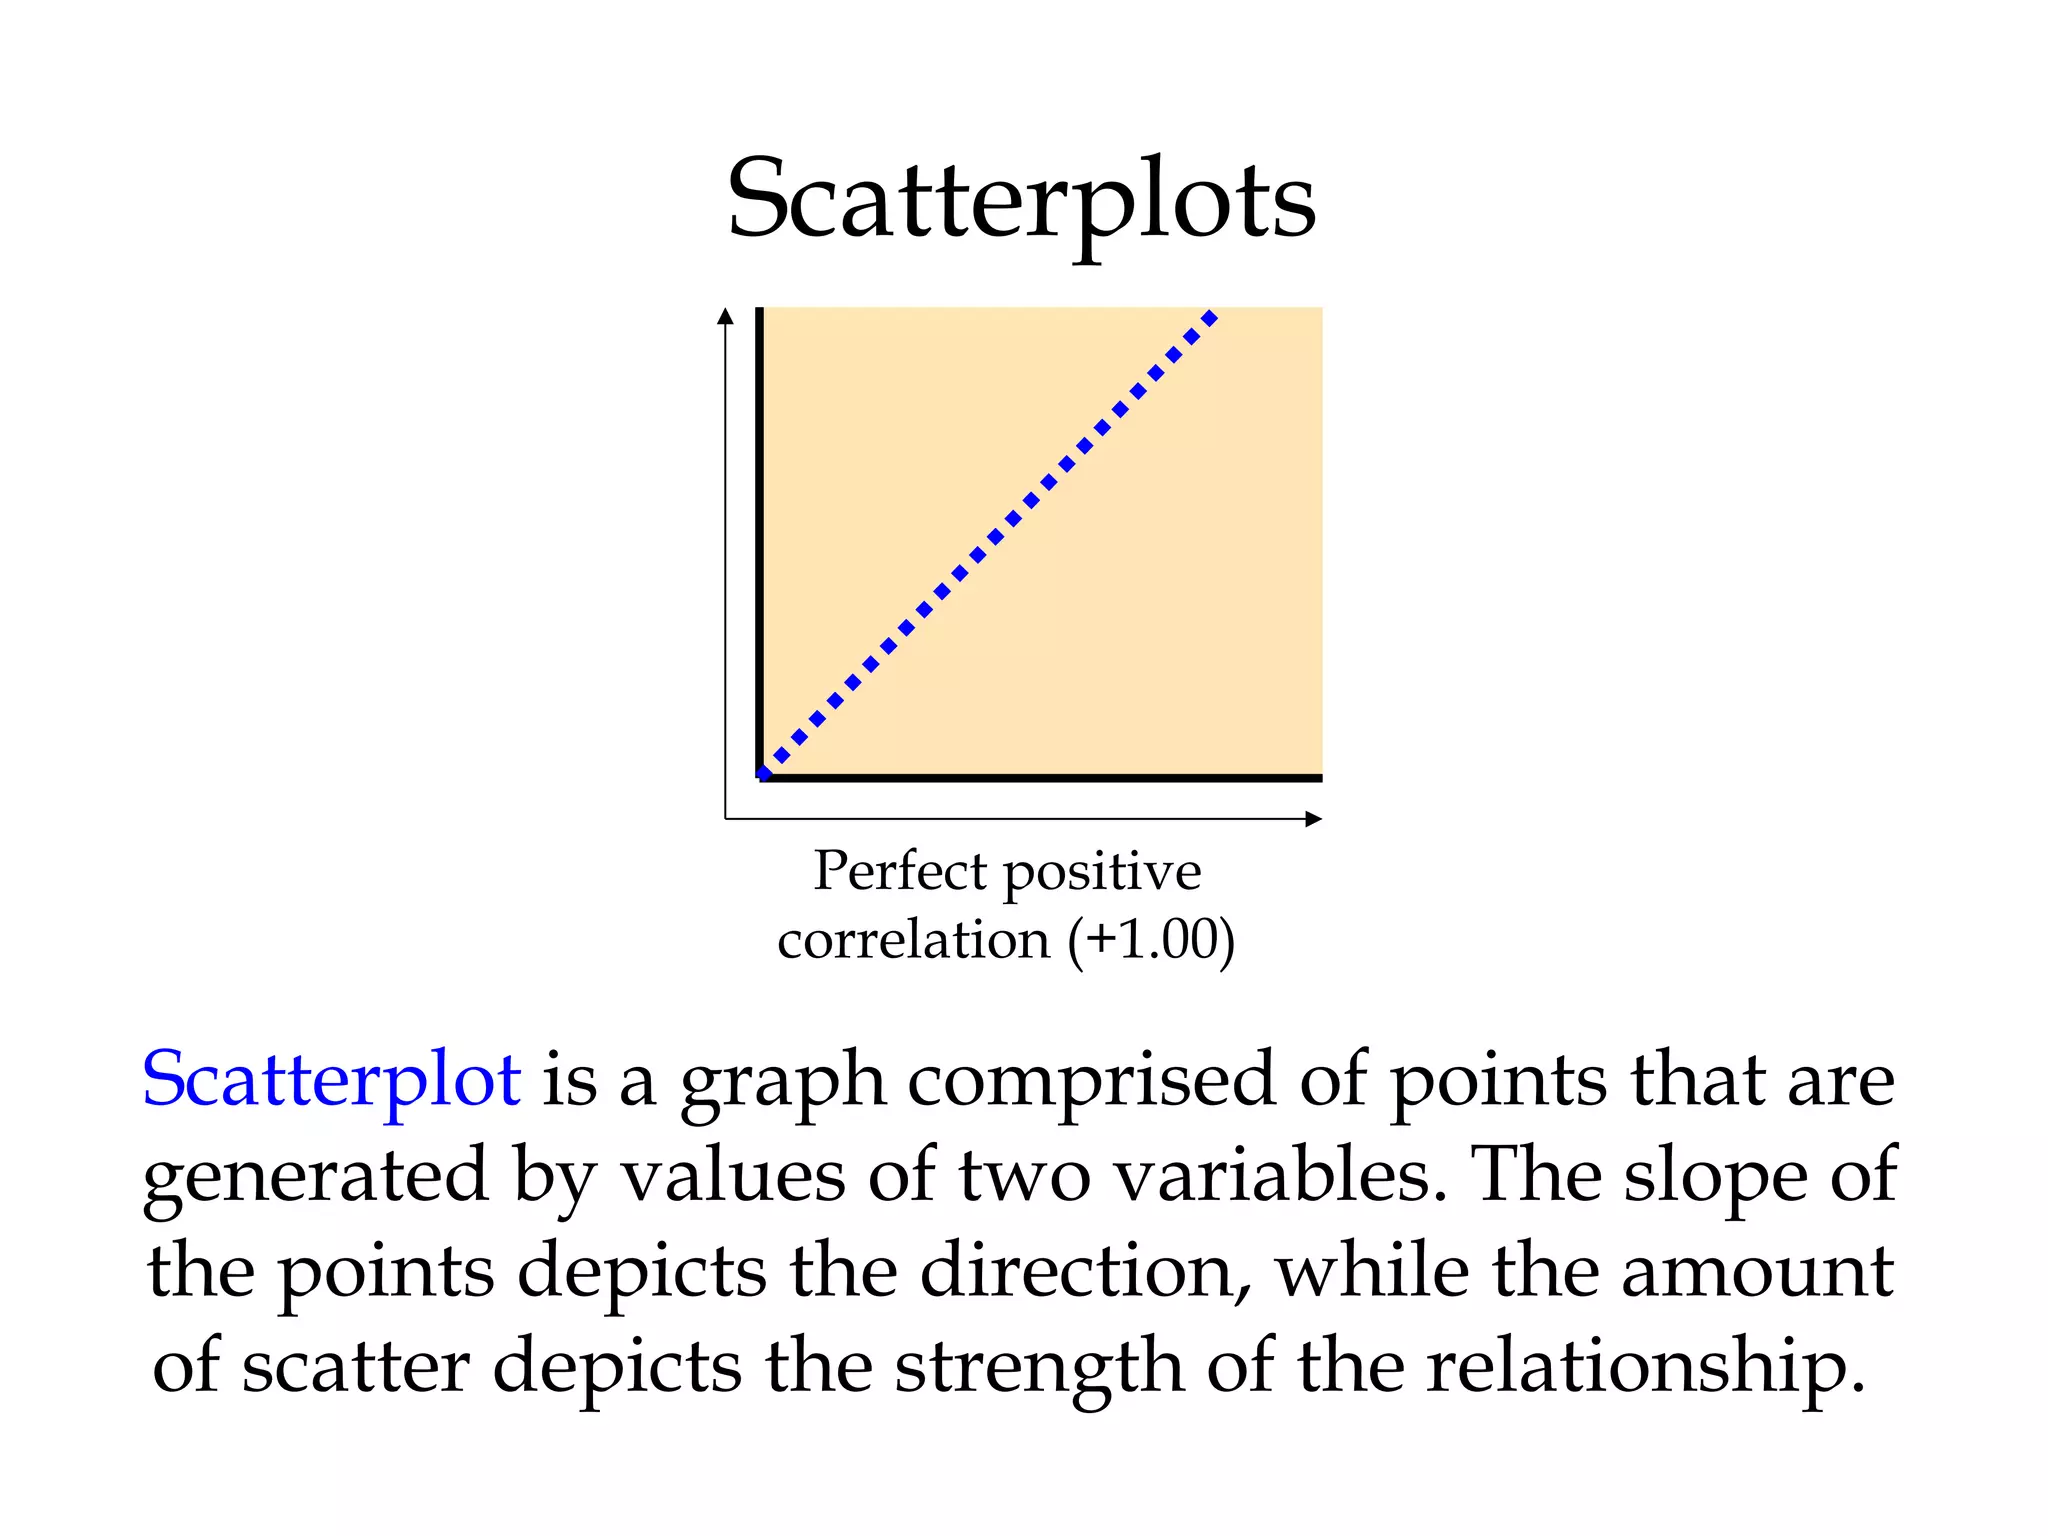
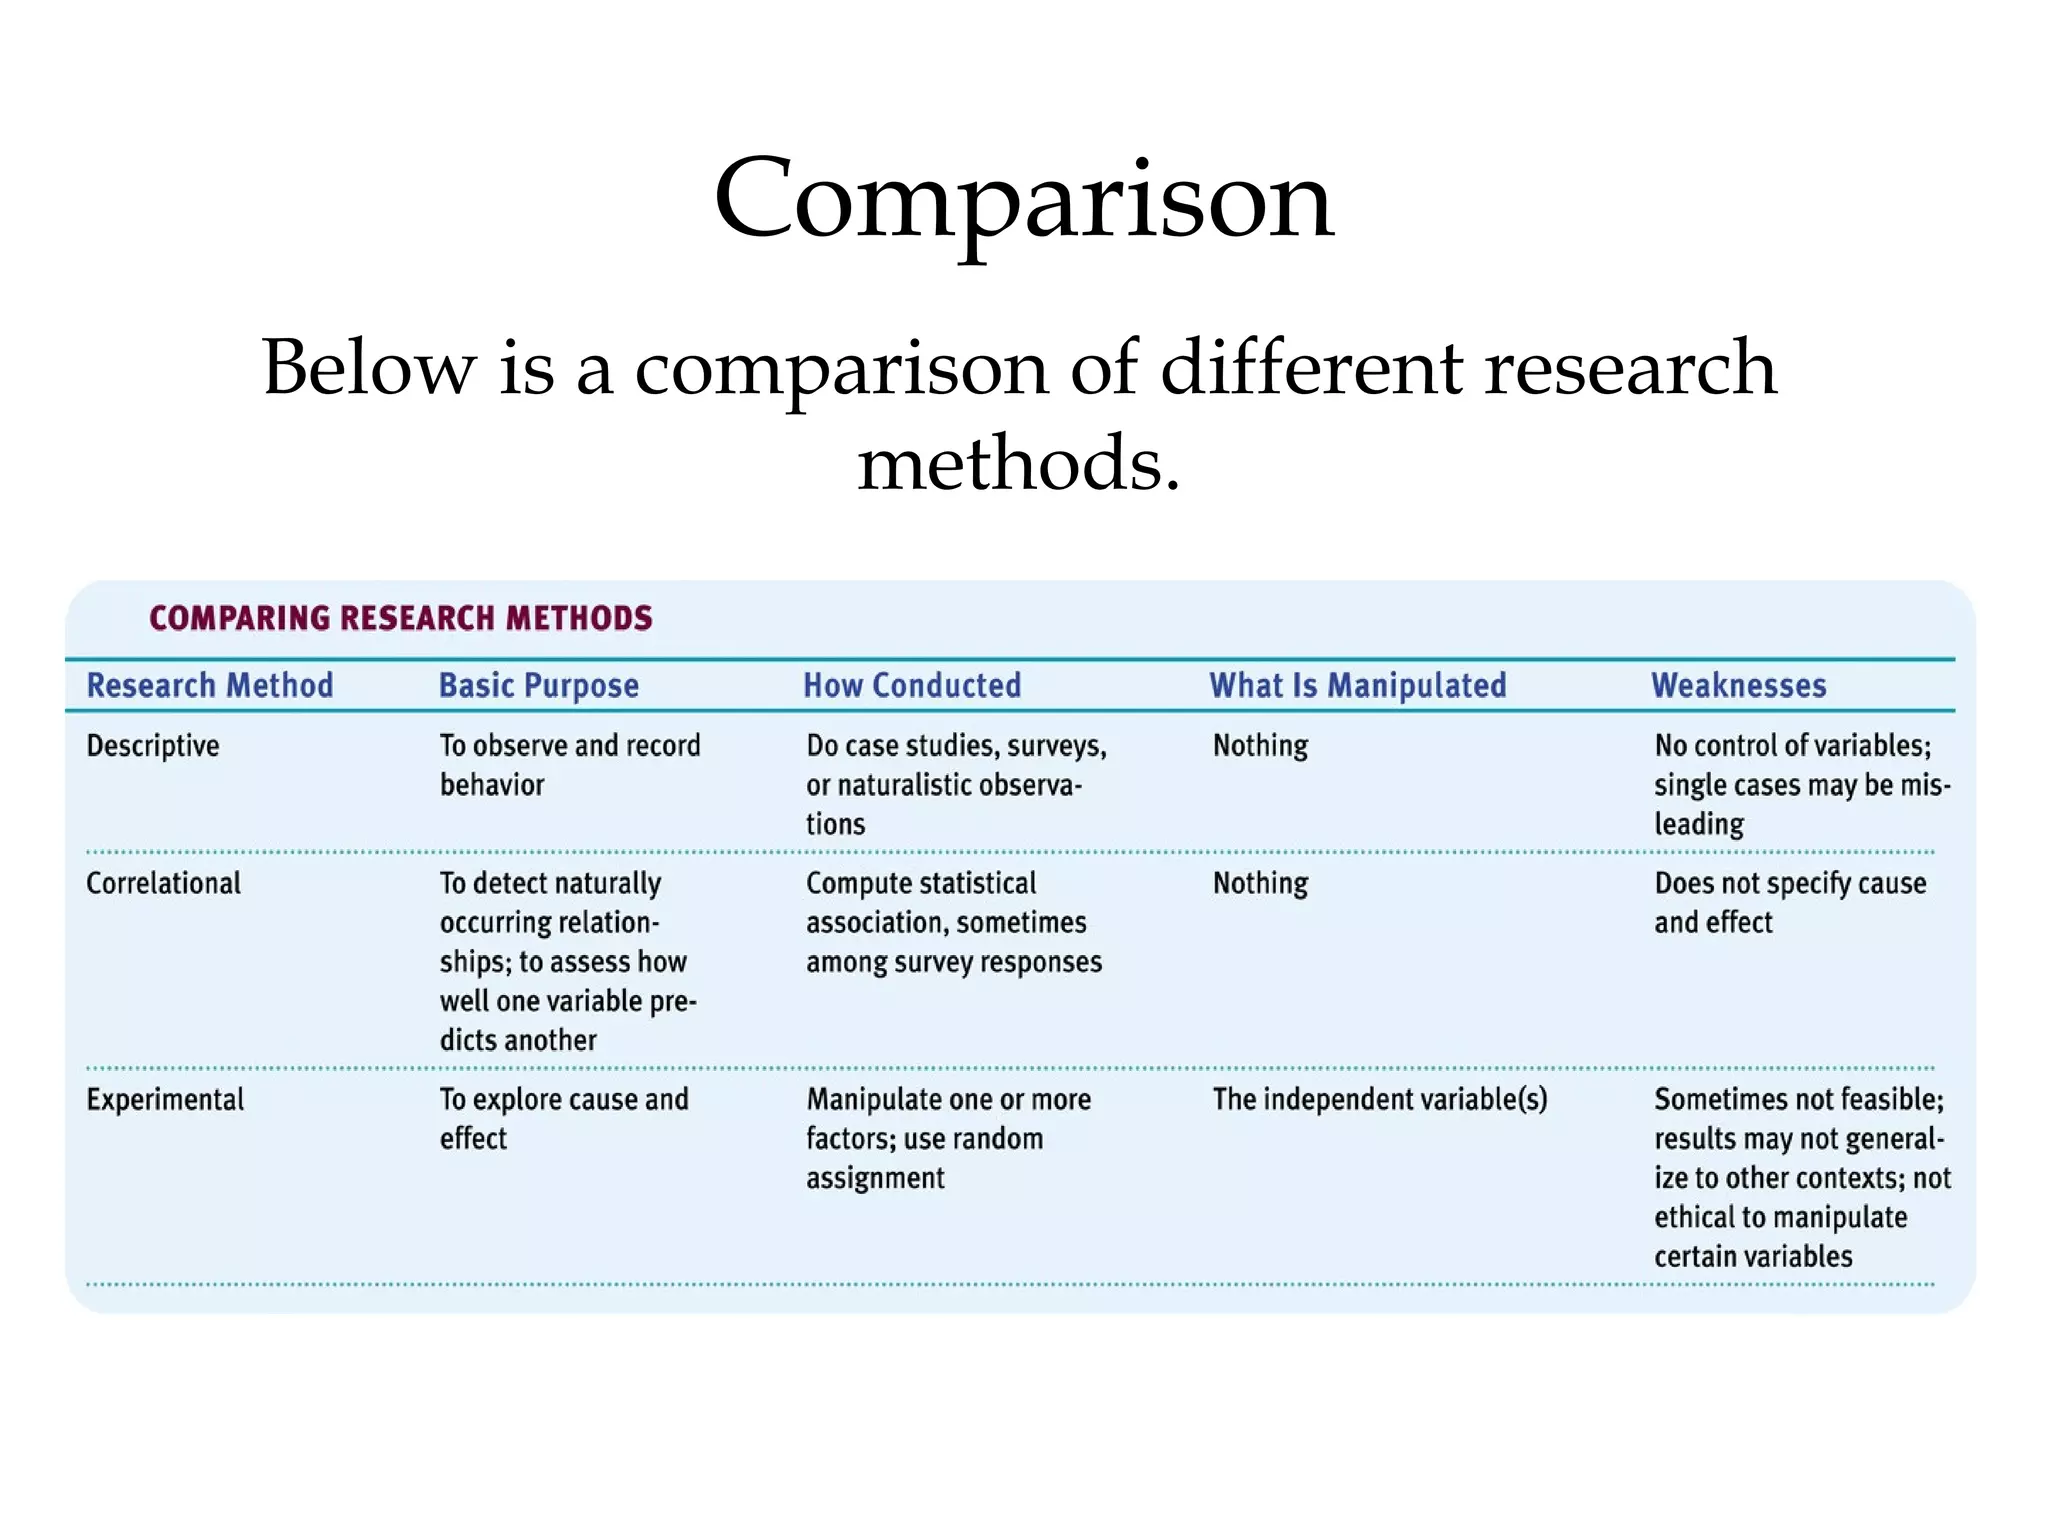
- The scientific method and how psychologists ask and answer questions through description, correlation, and experimentation.
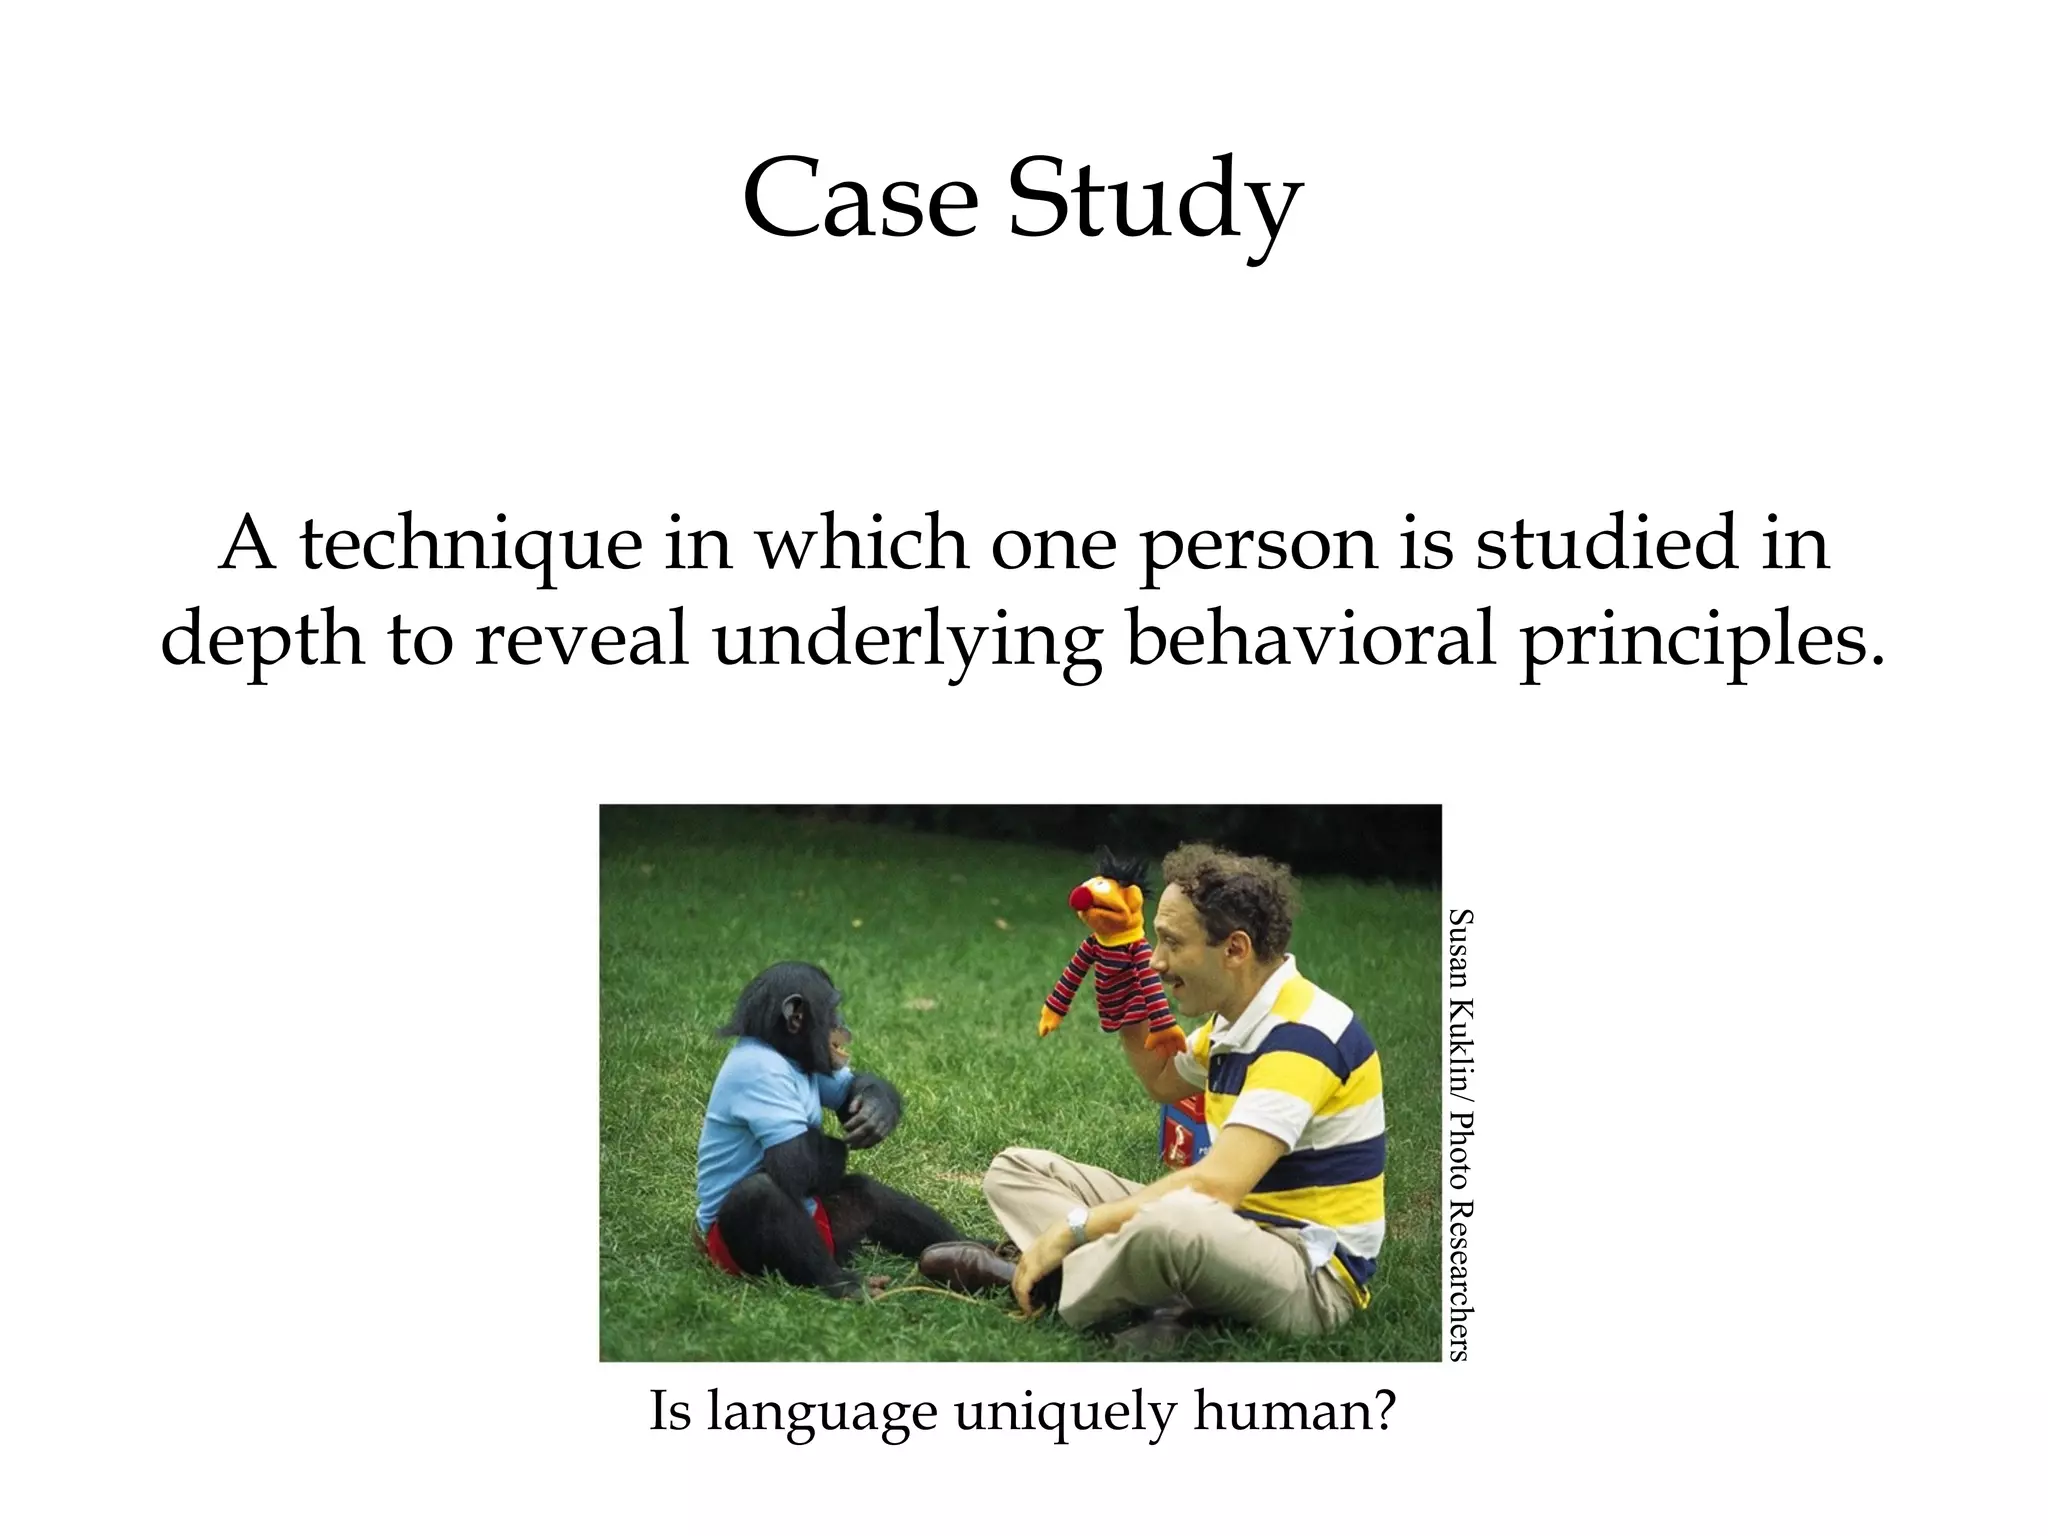
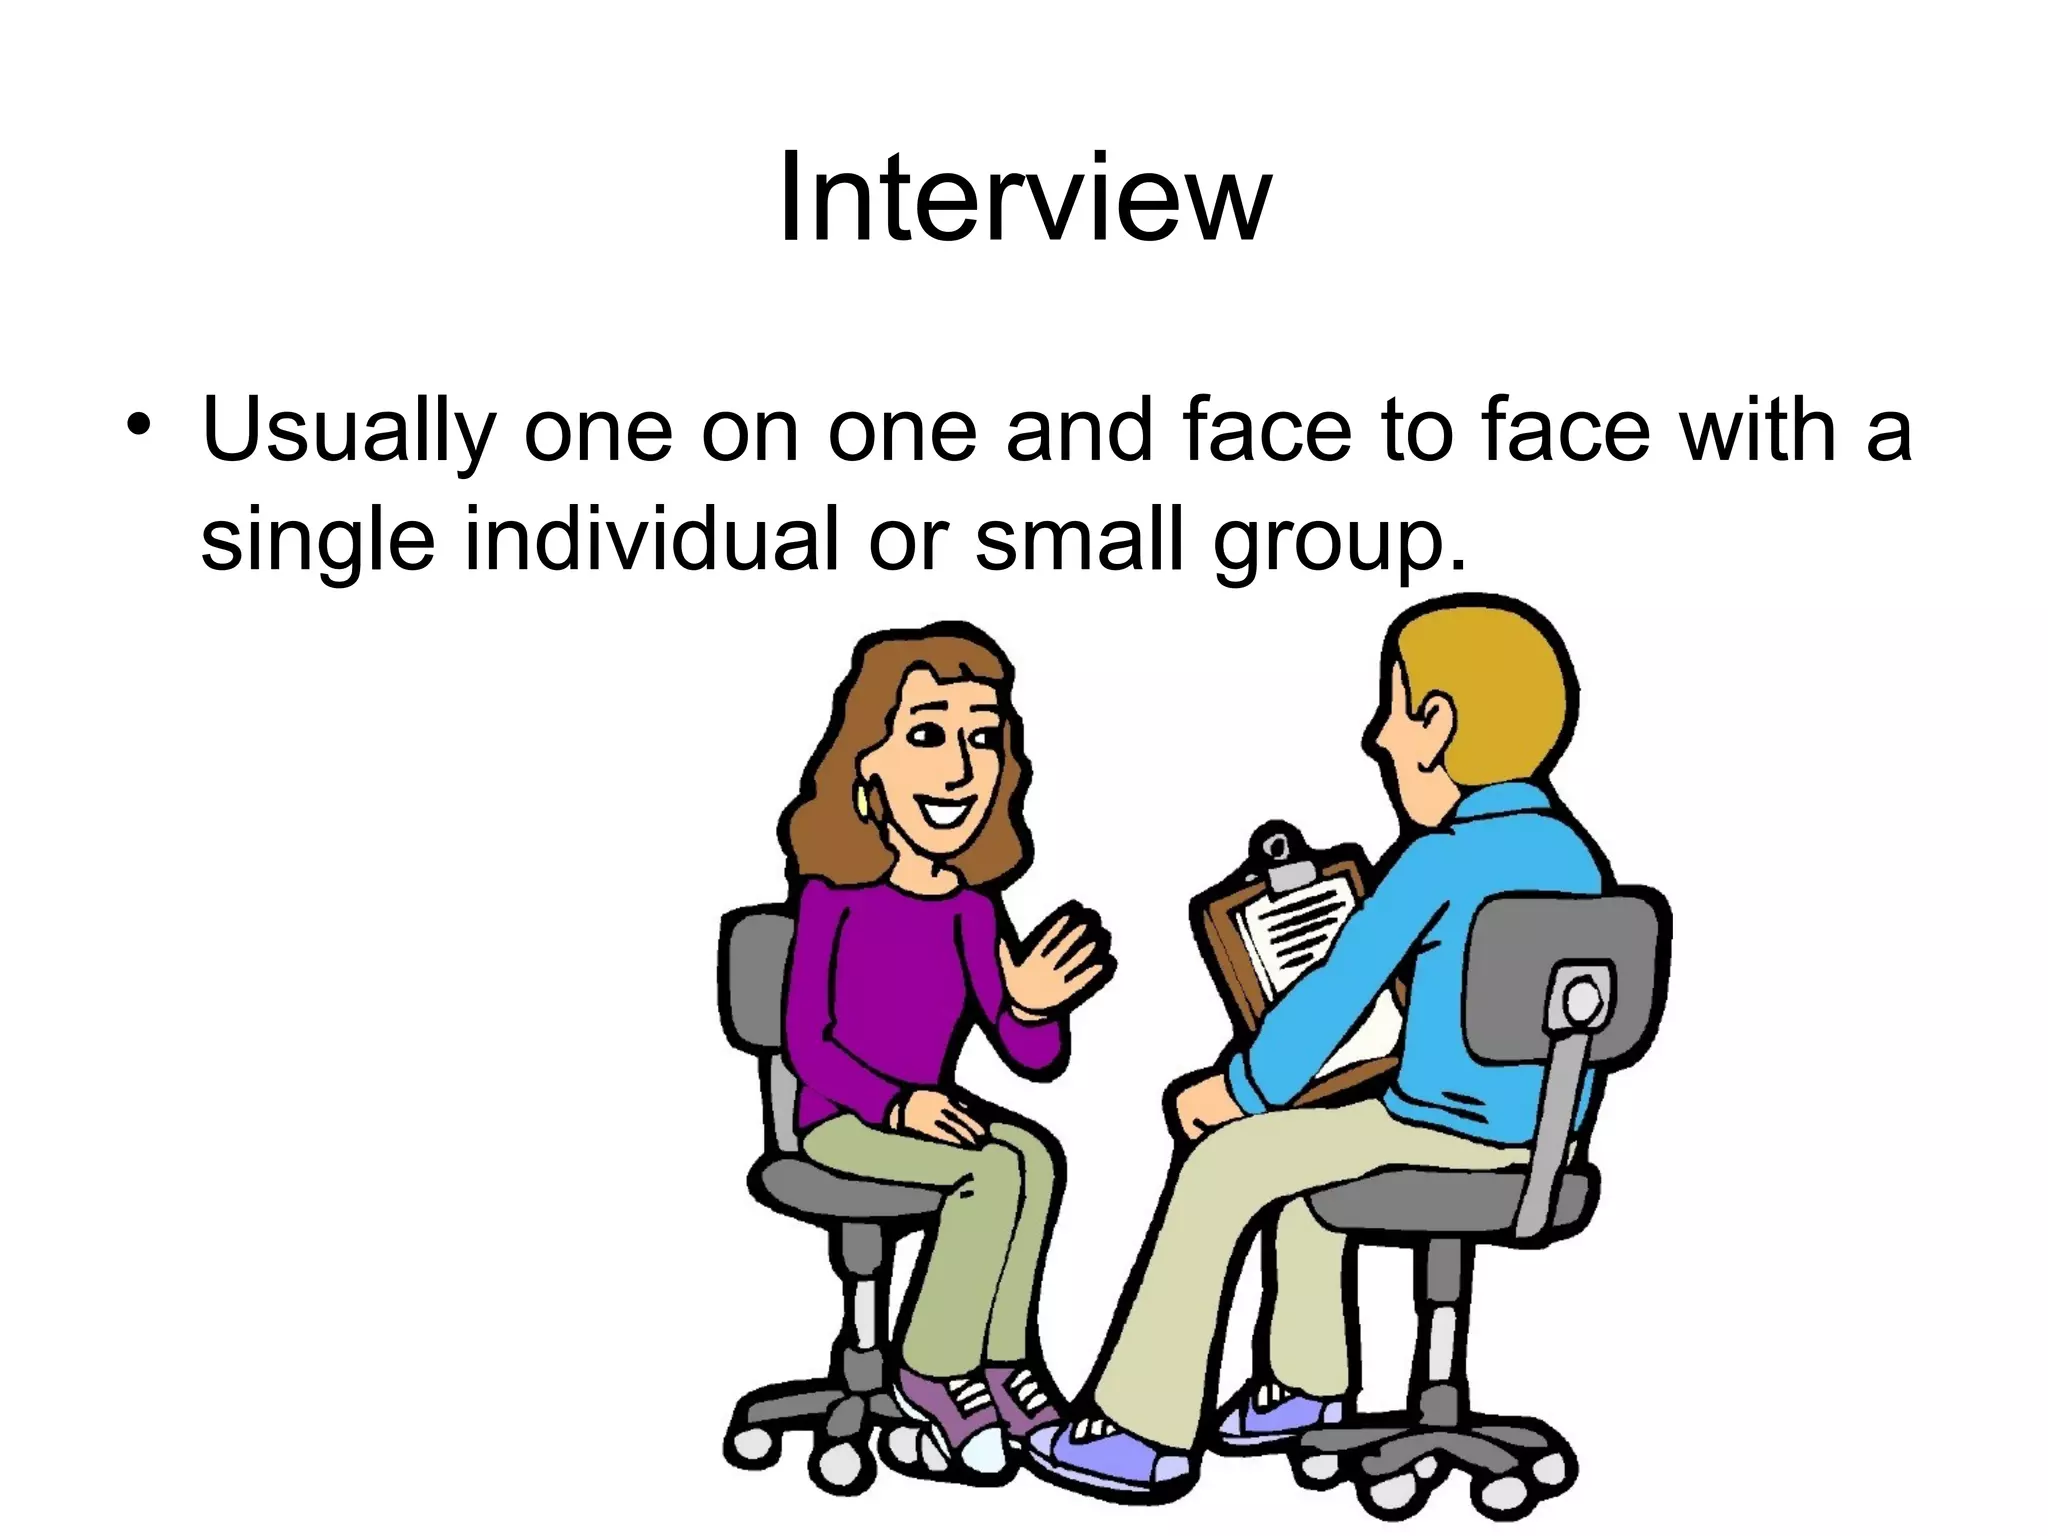
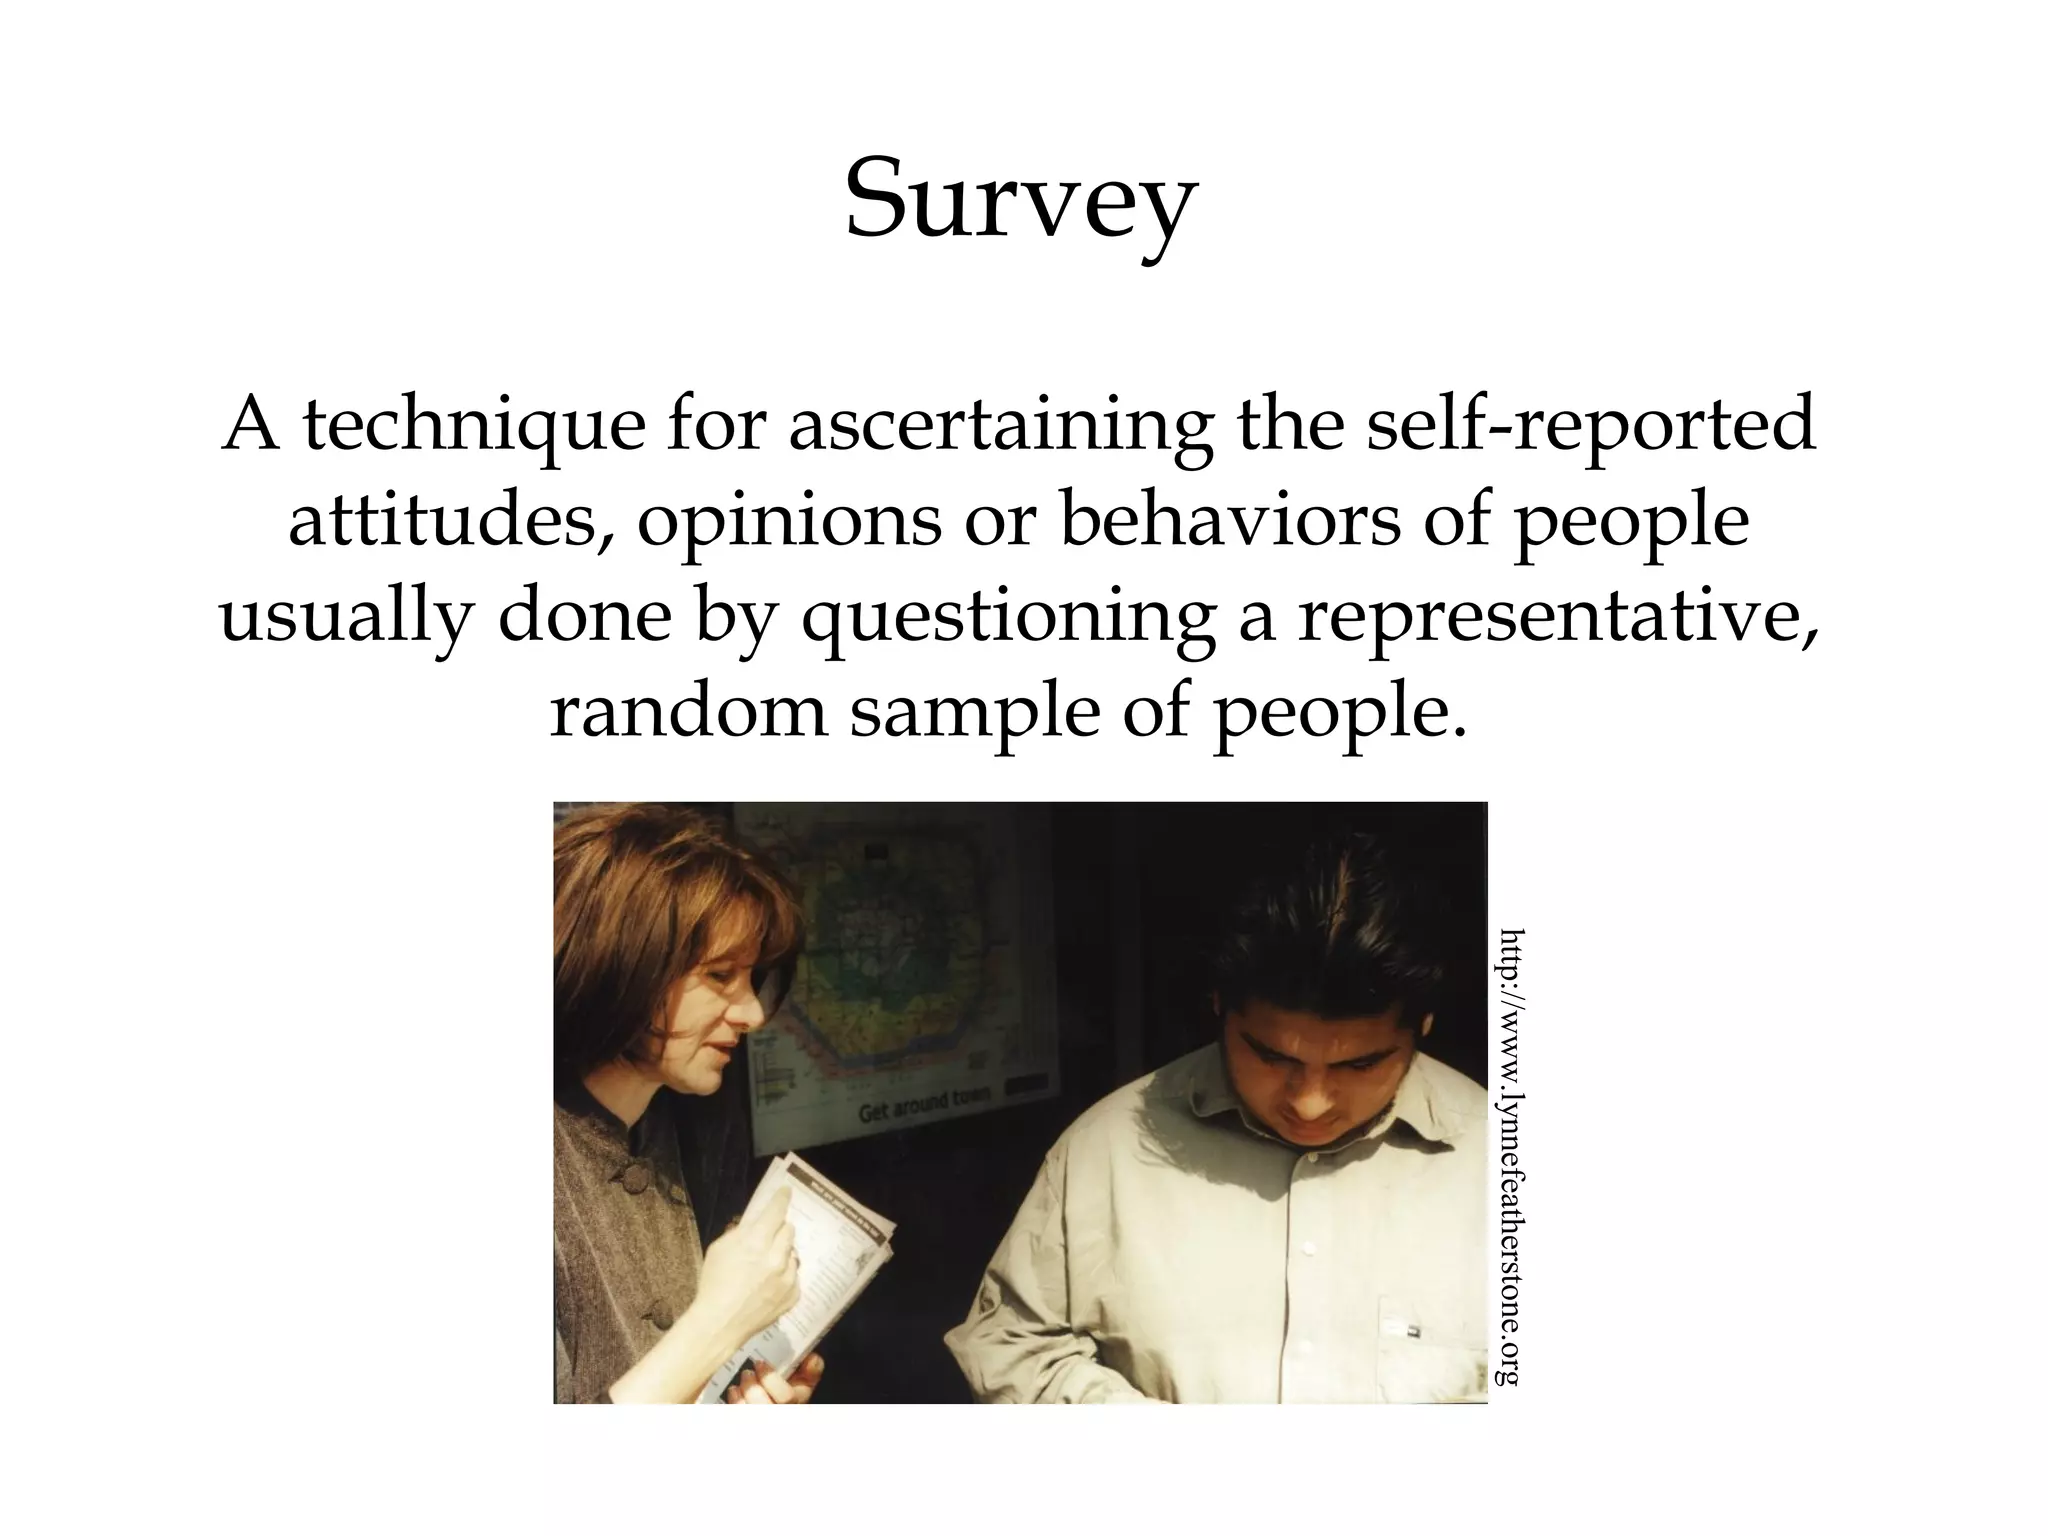
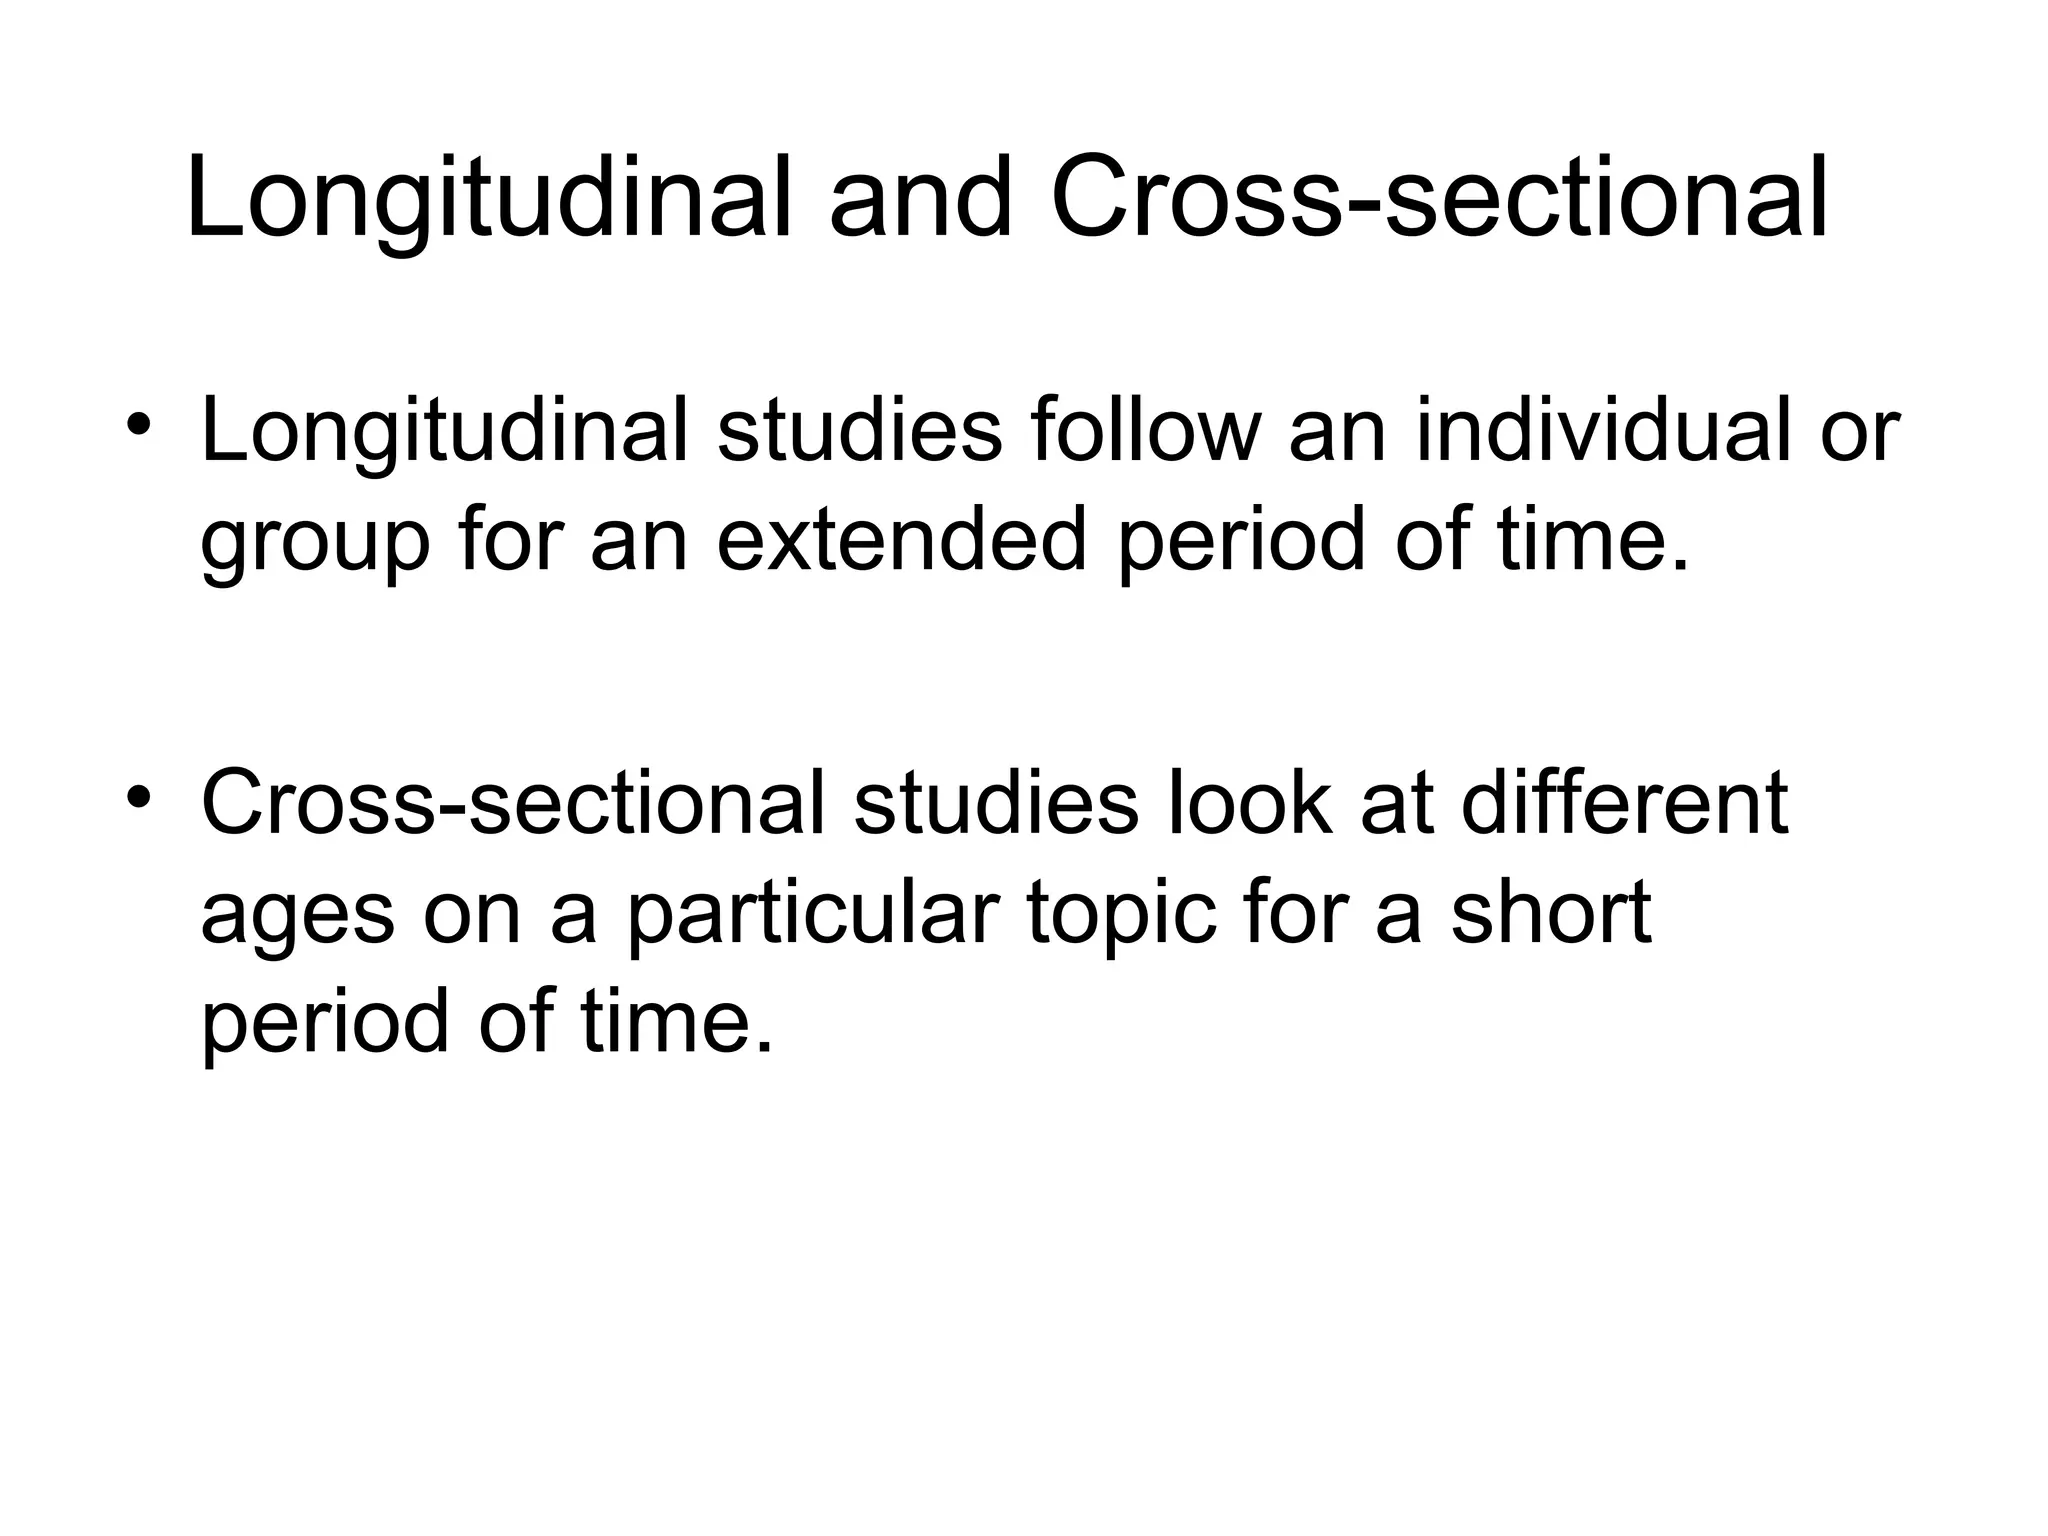
- Common research methods like surveys, interviews, and longitudinal studies.
- The importance of control groups, random assignment, and double-blind studies in experiments.
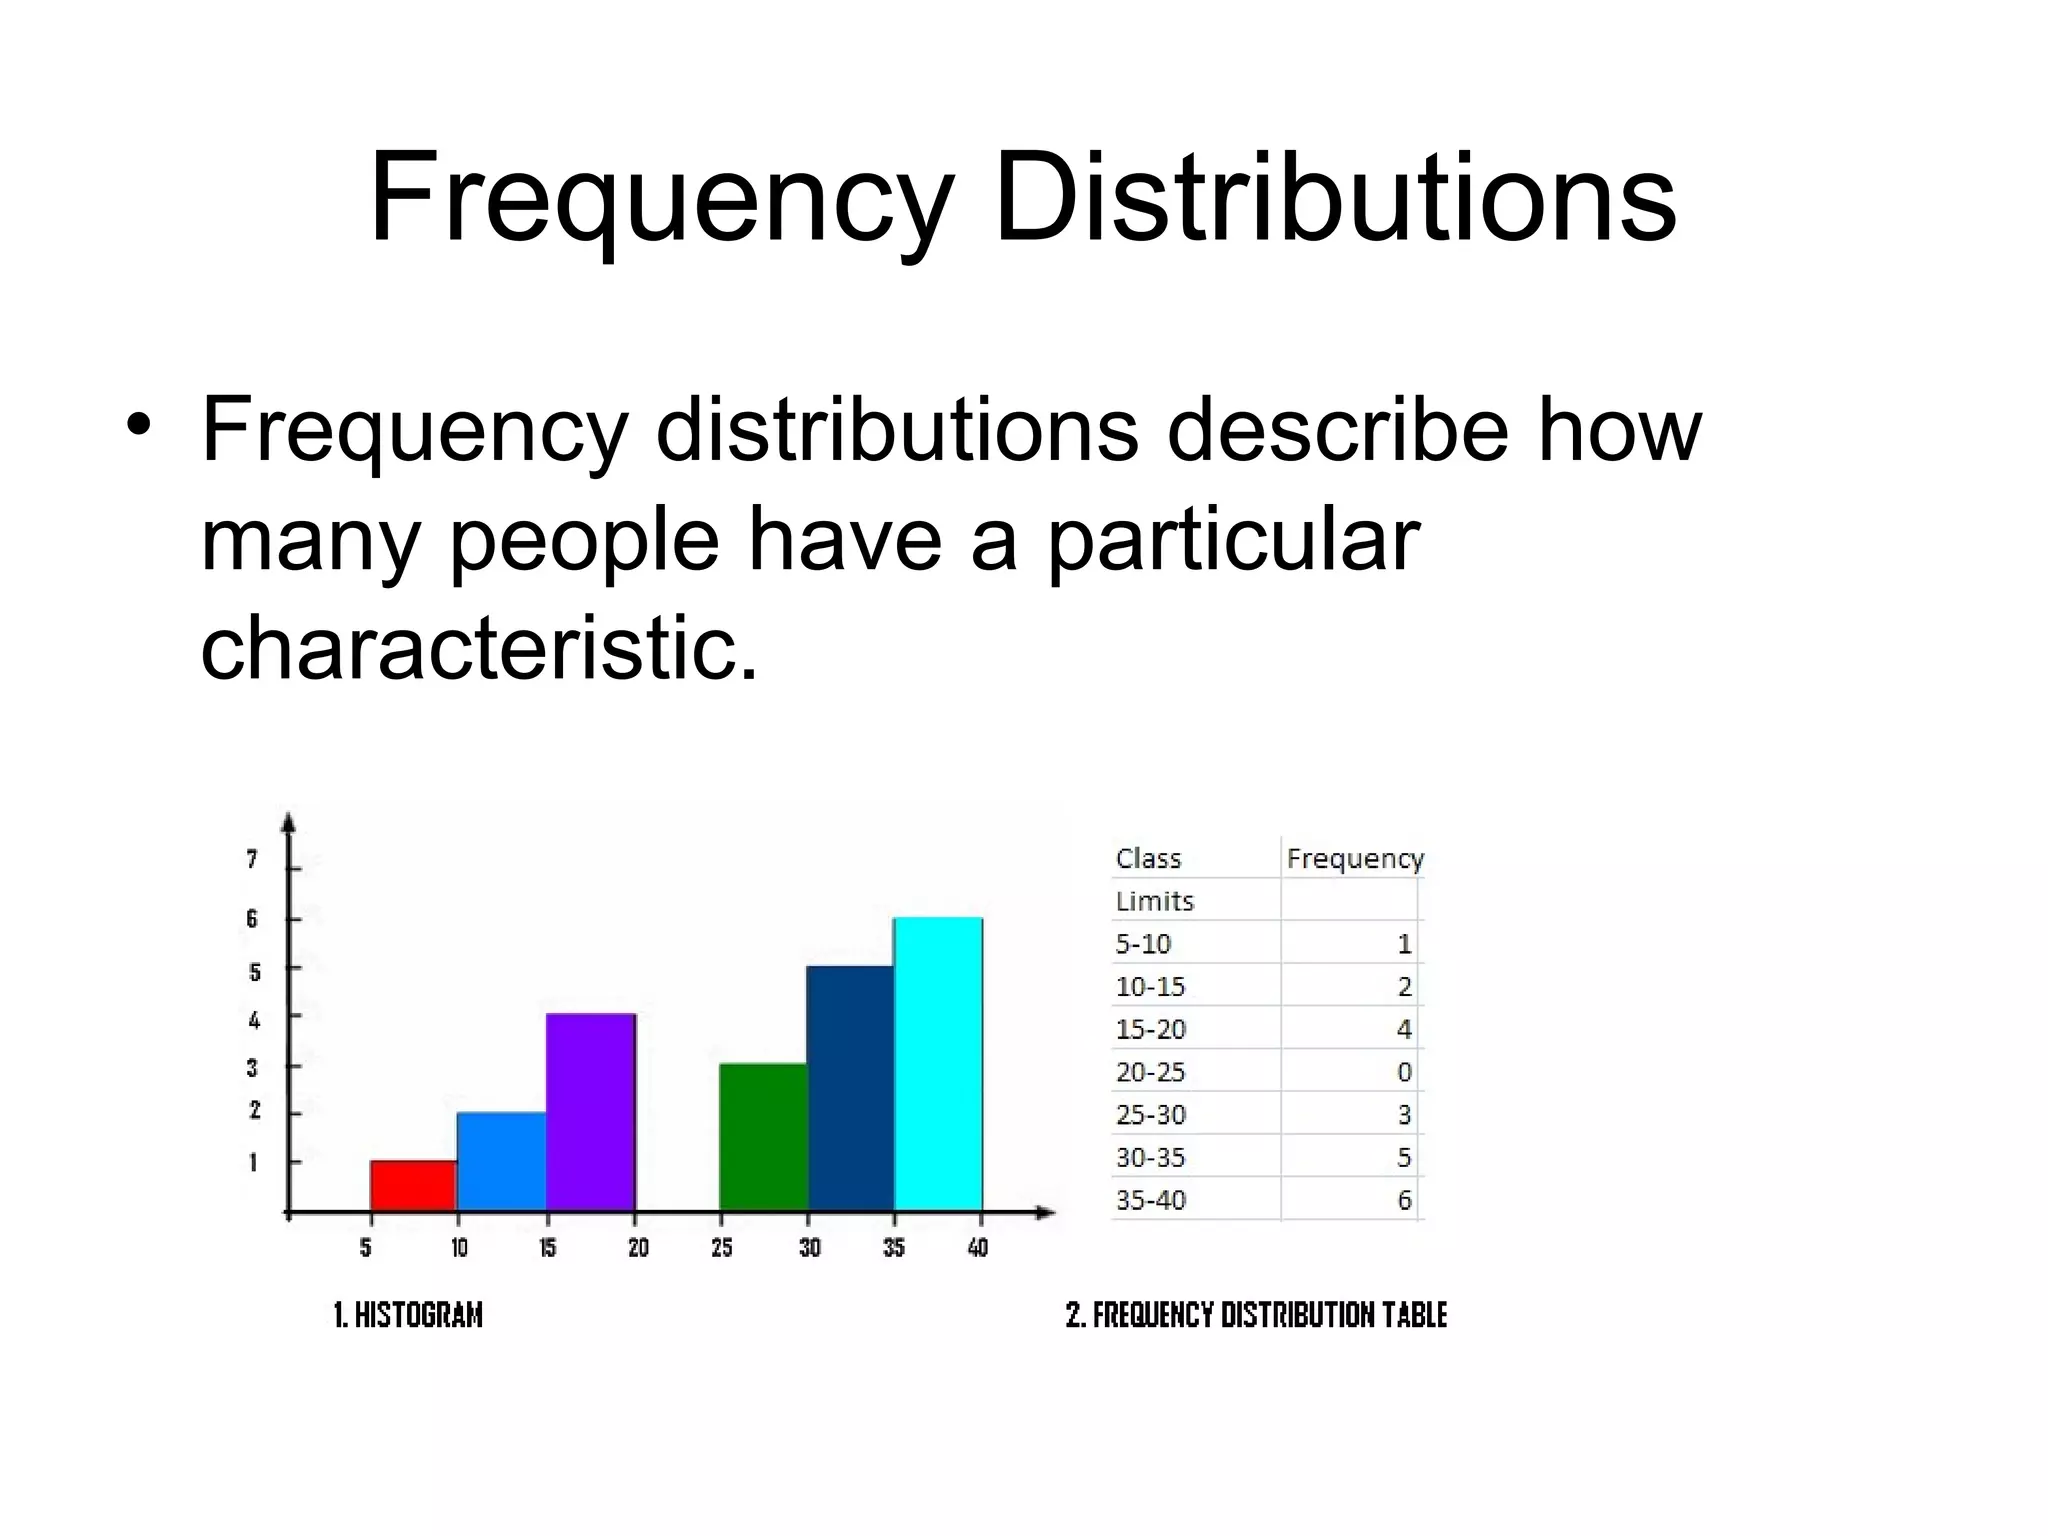
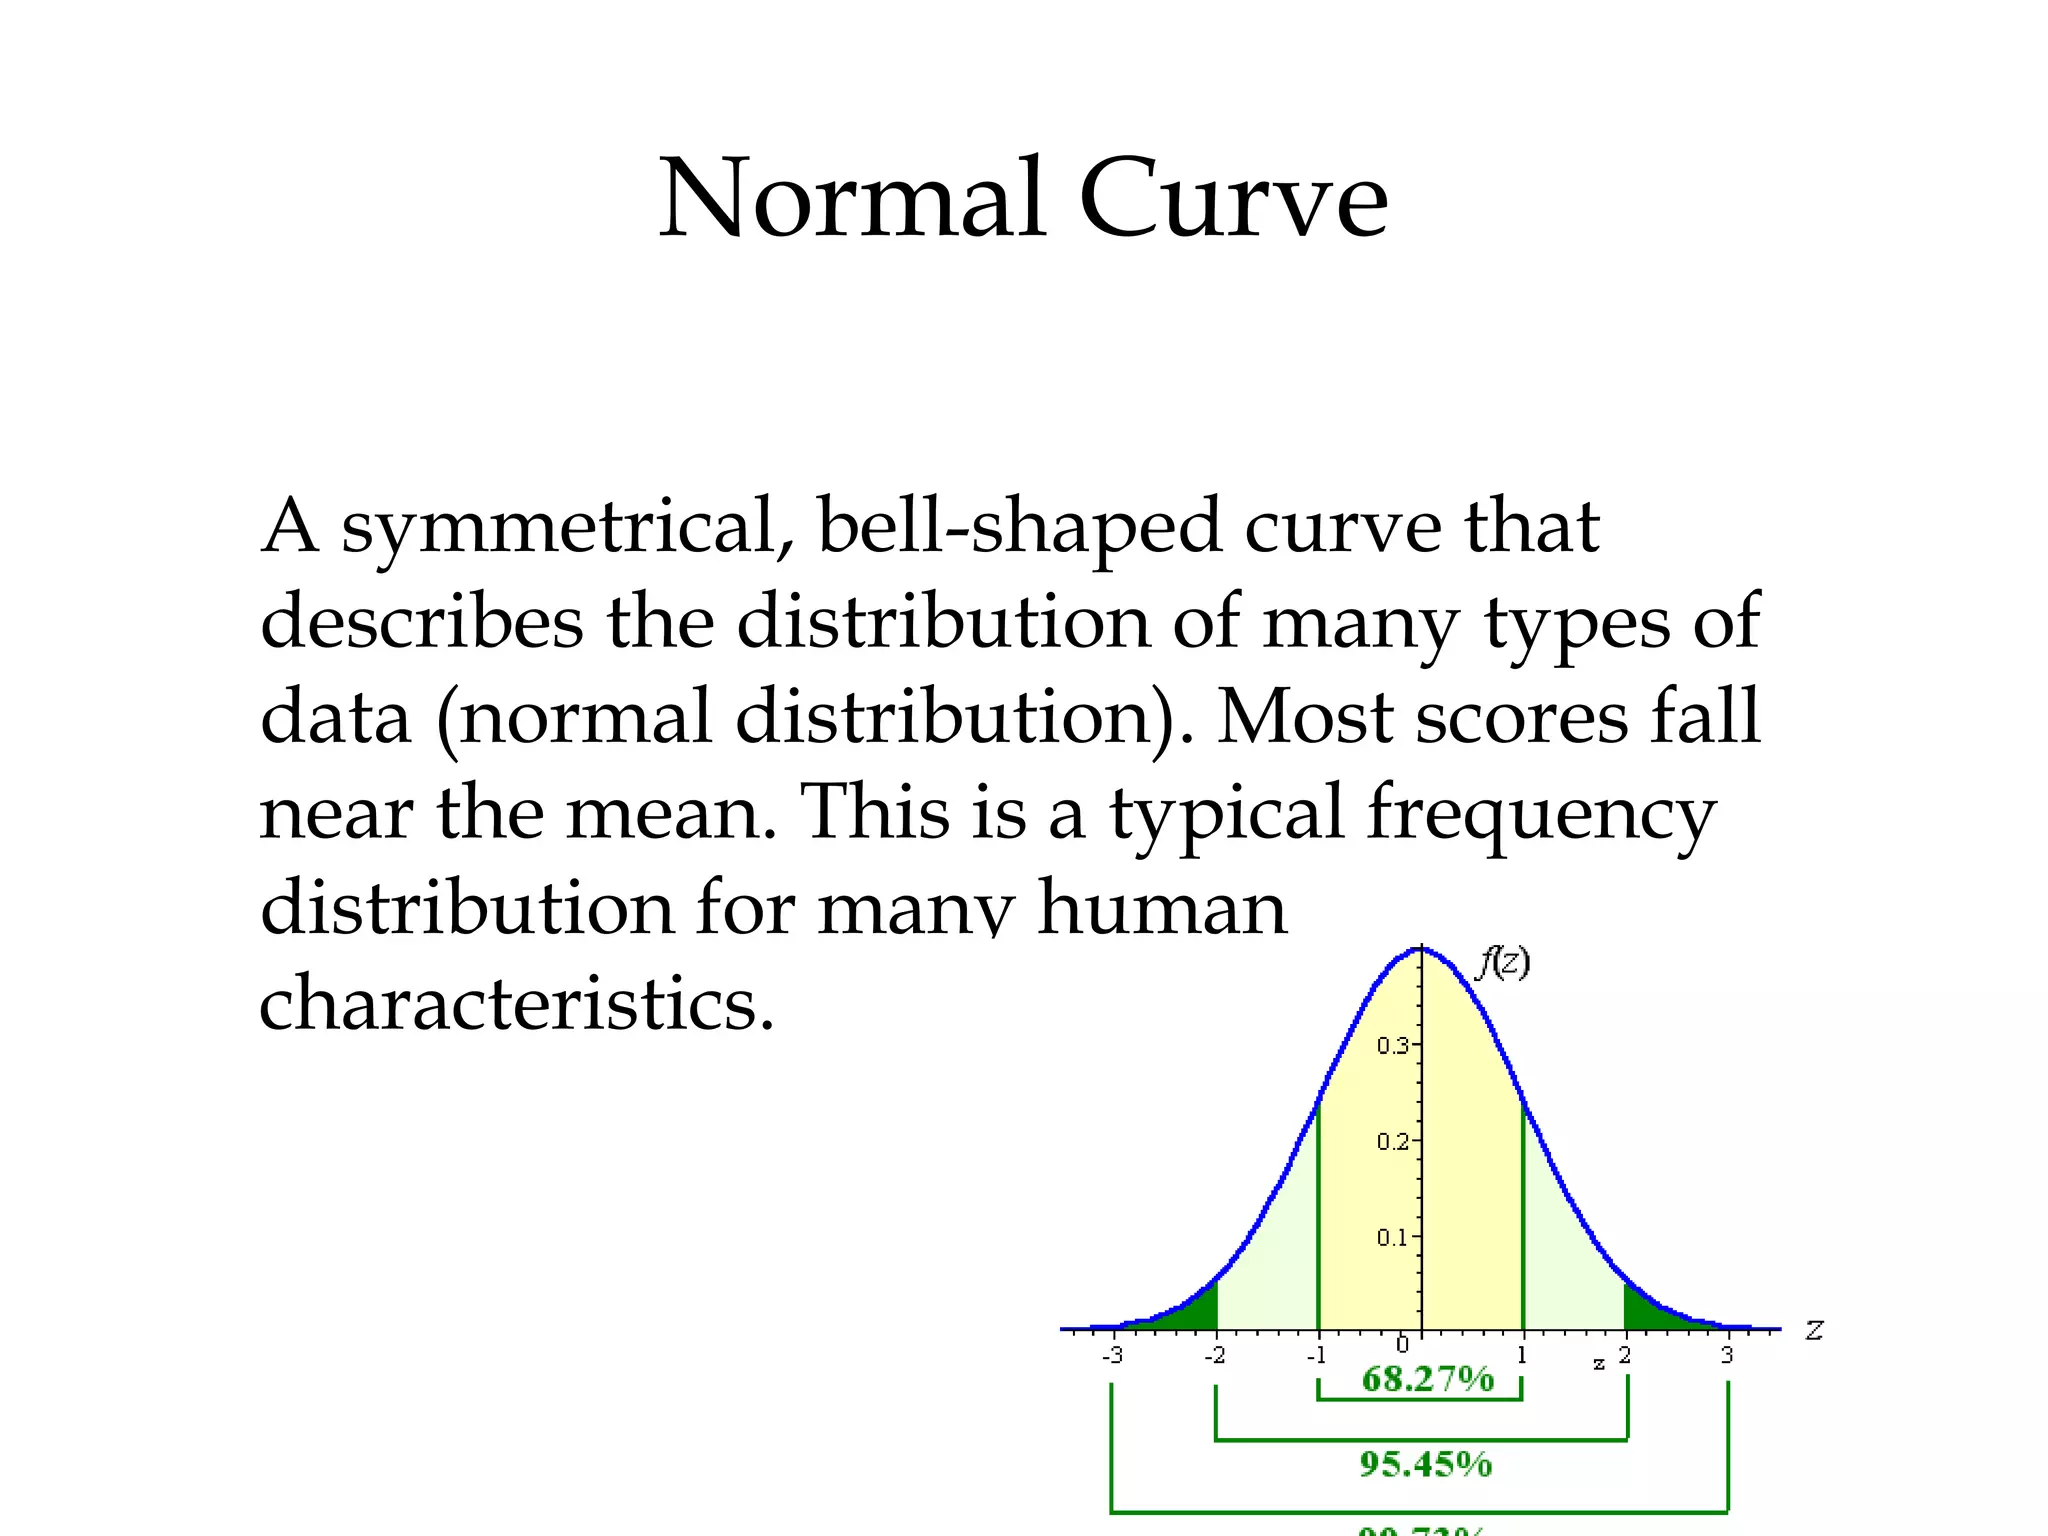
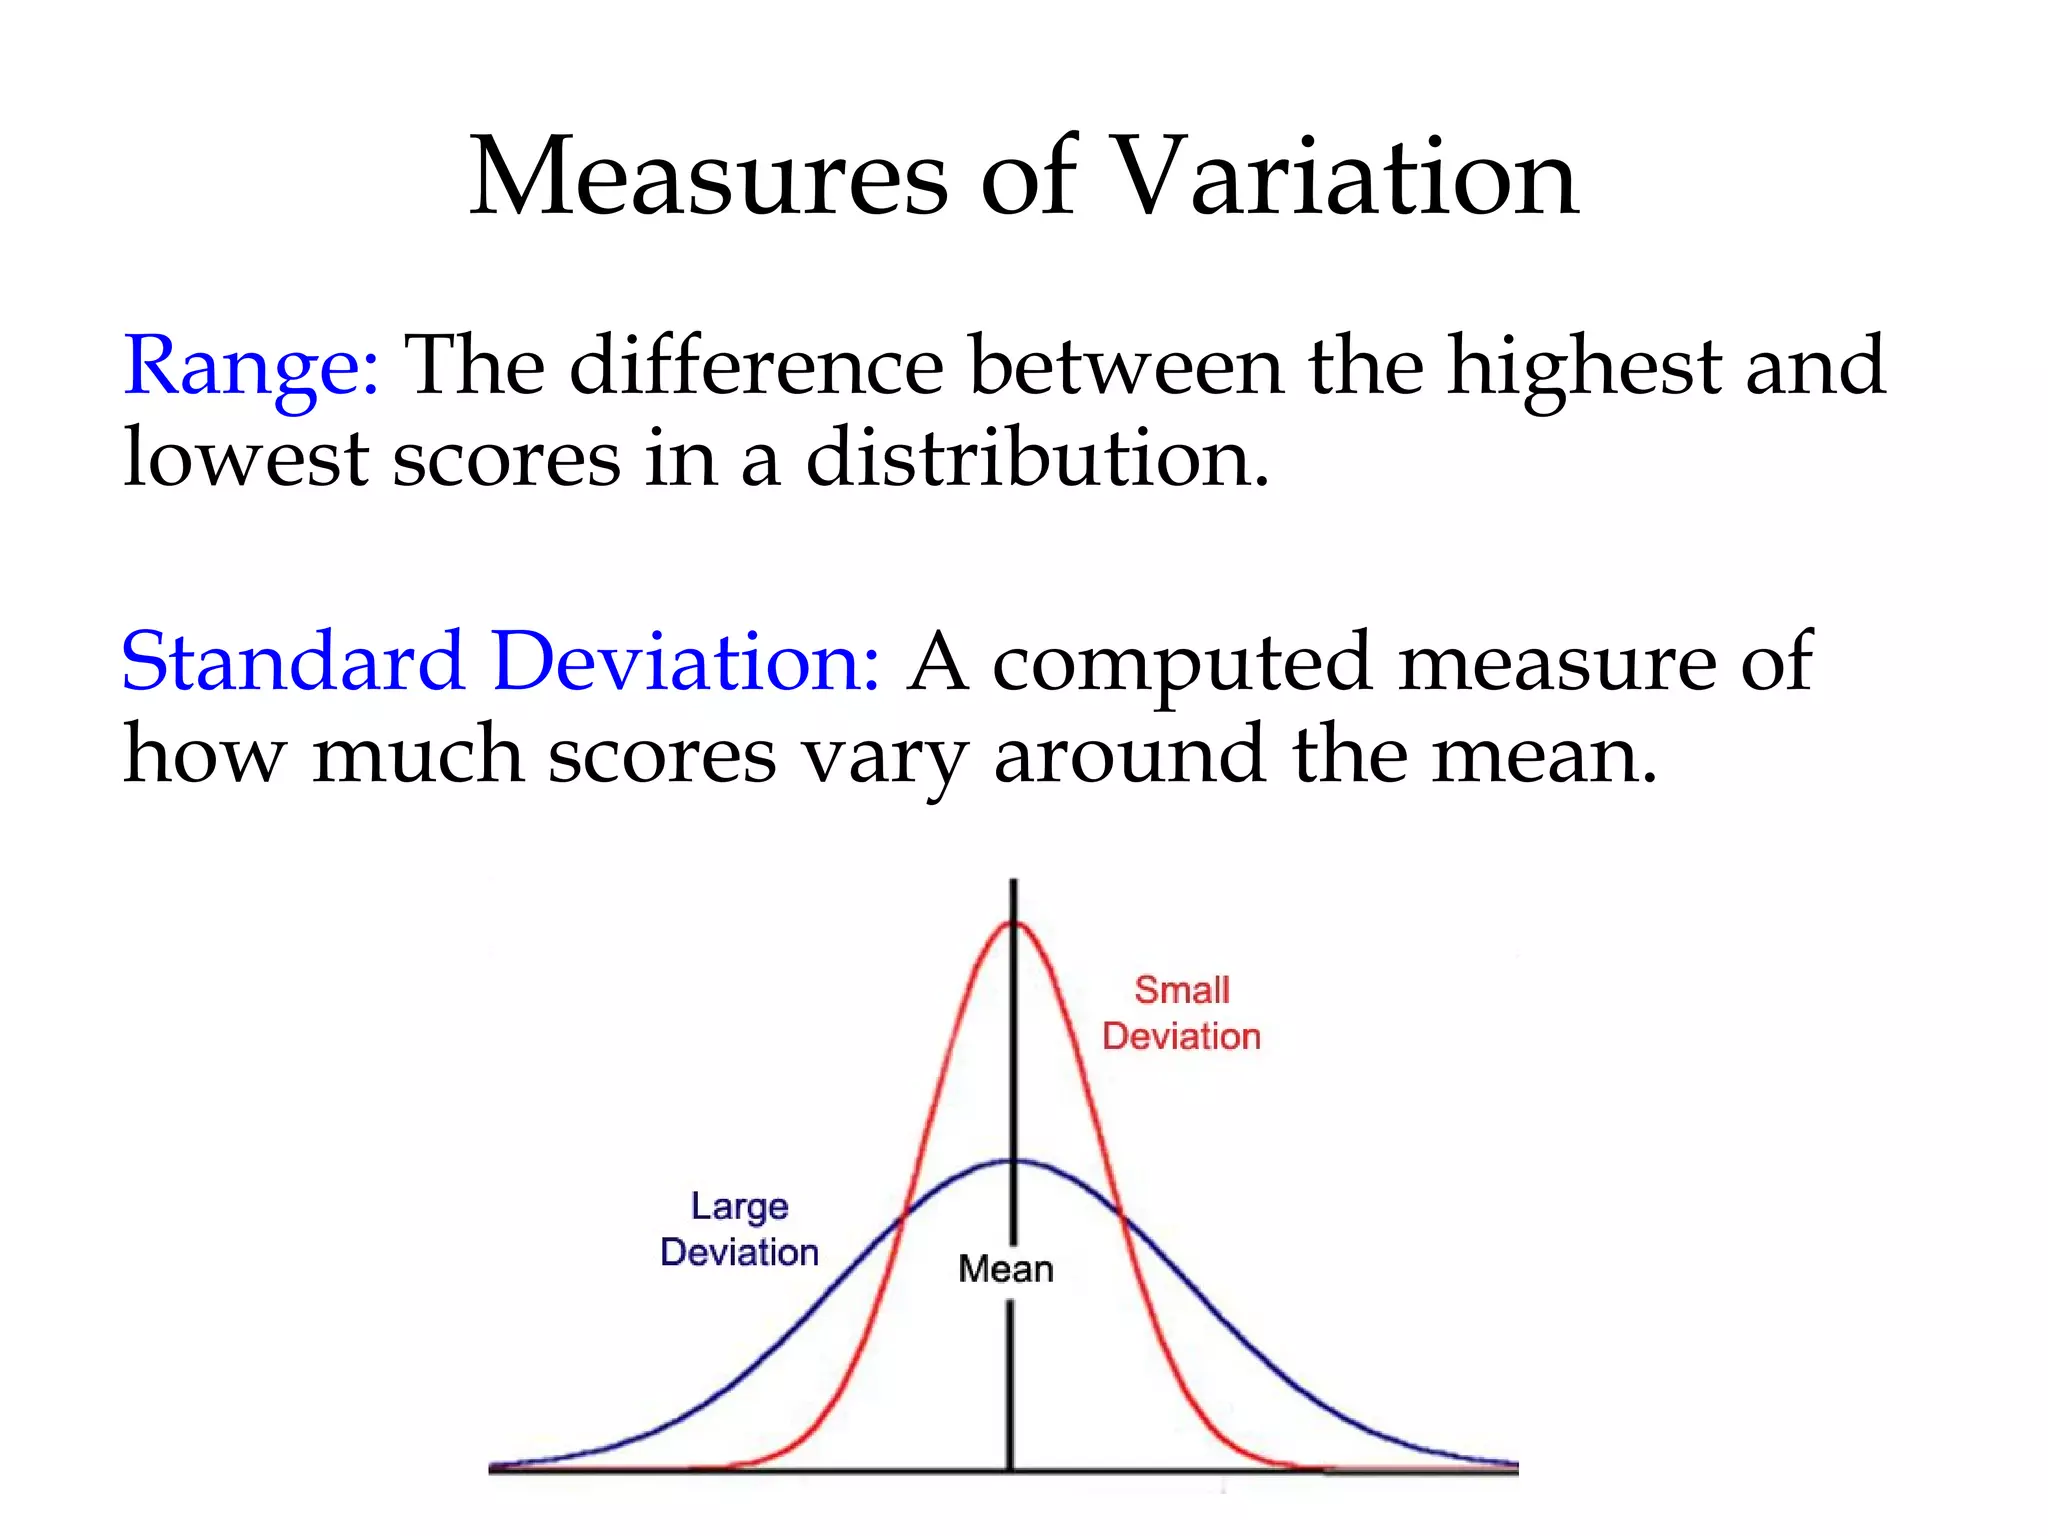
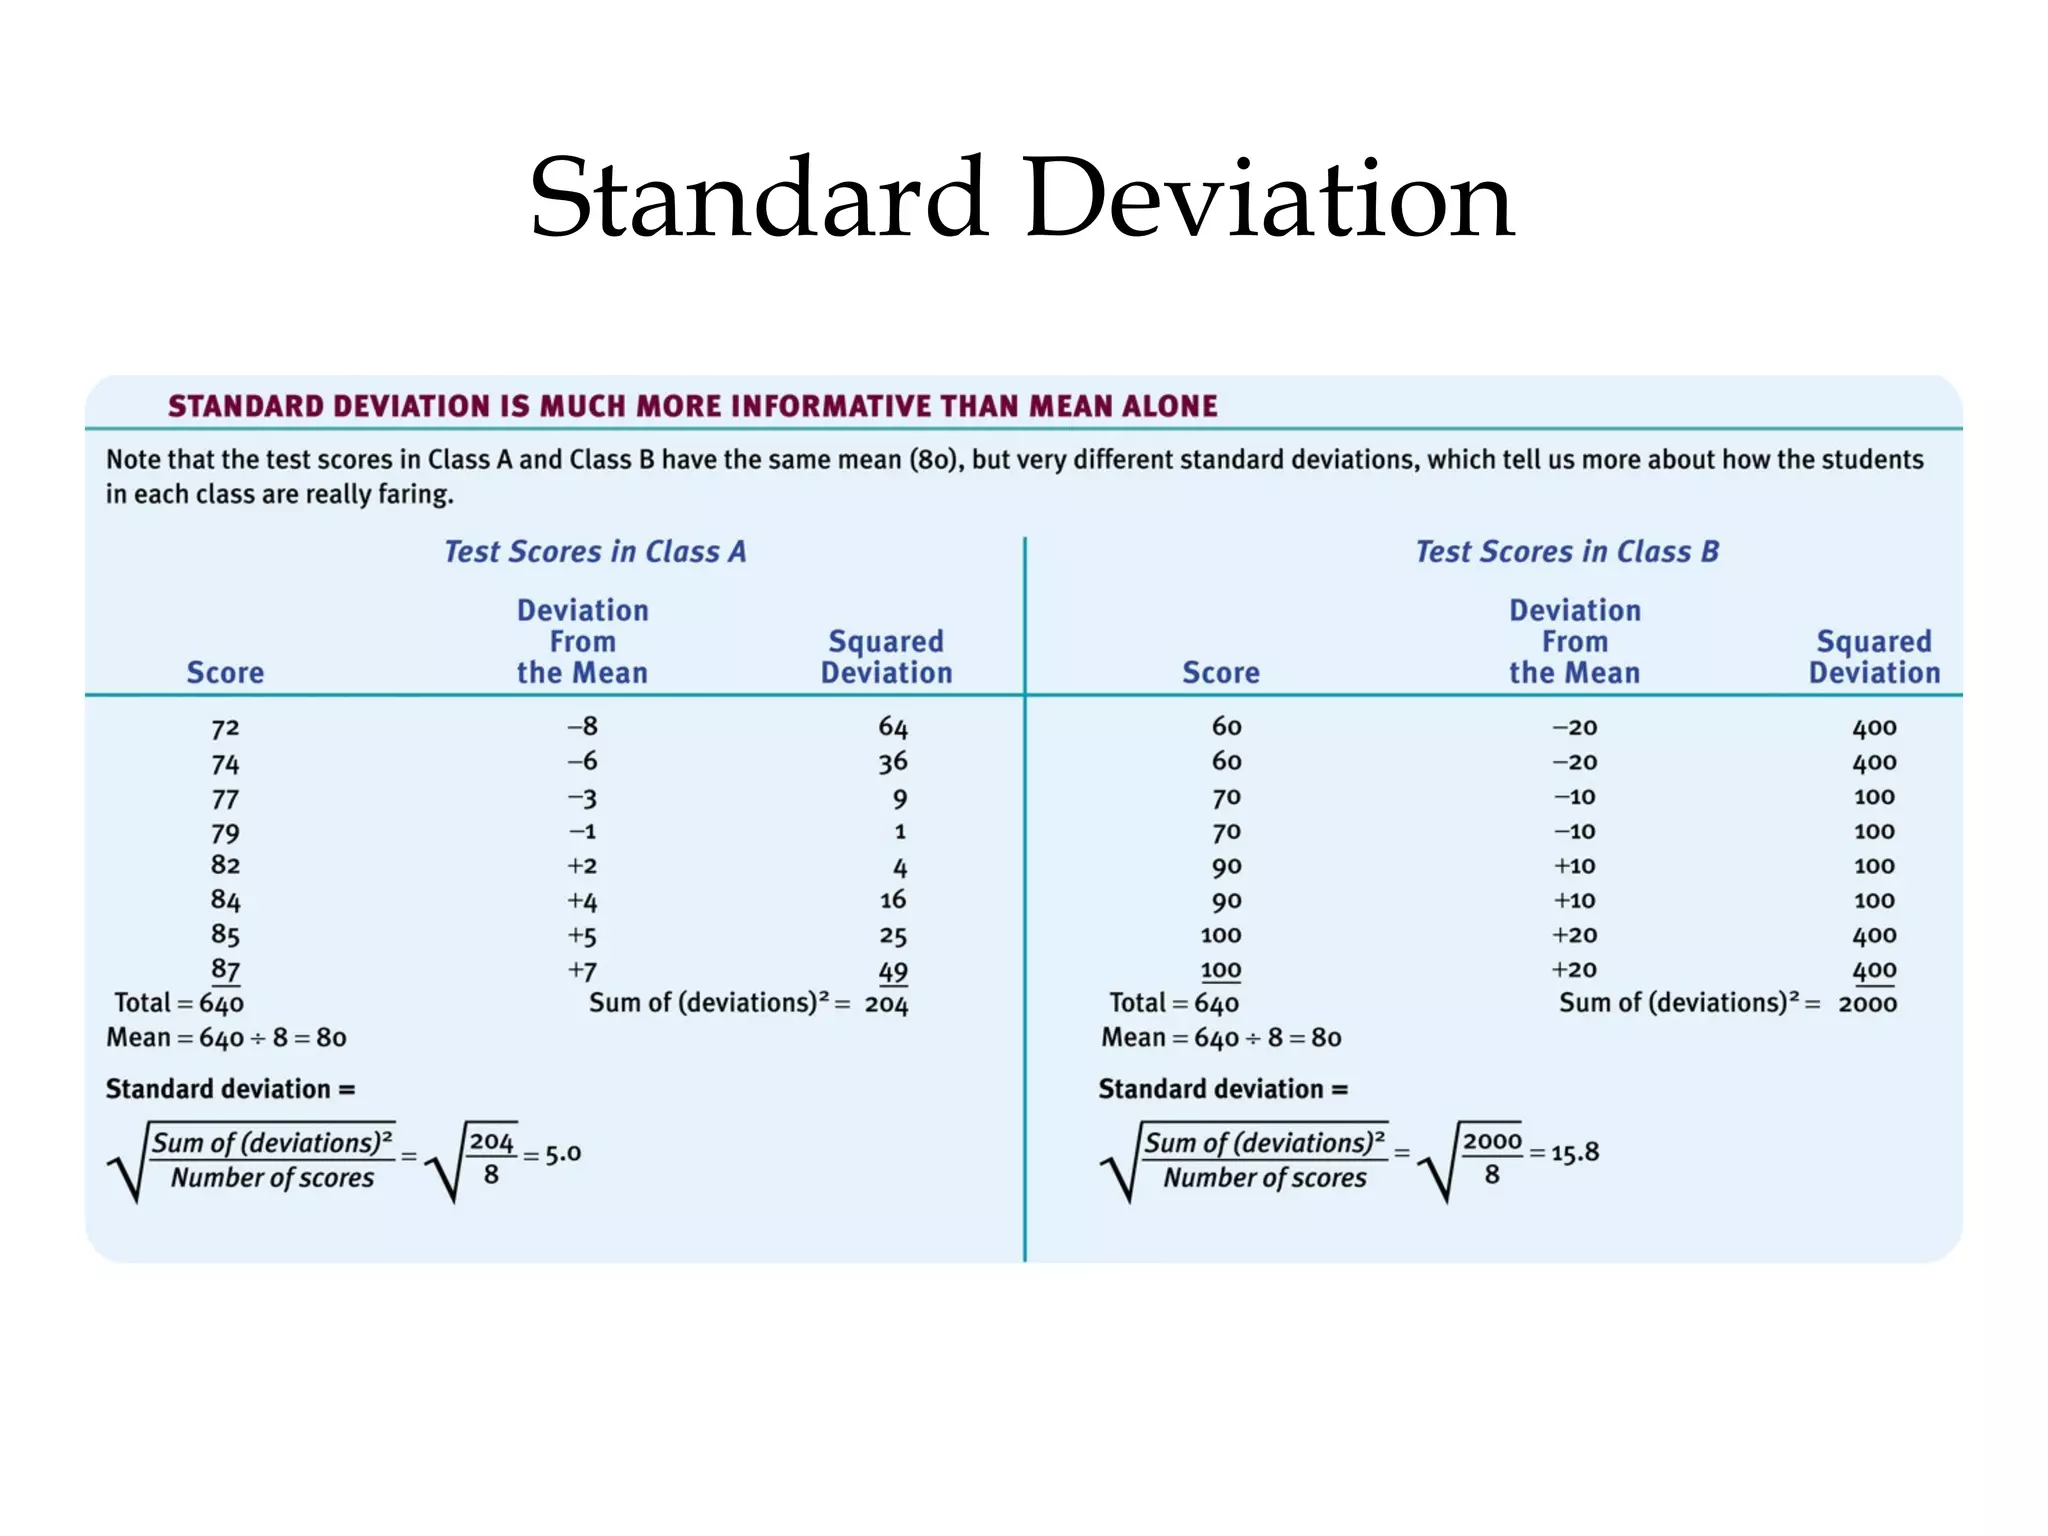
- Statistical analysis and making inferences from data through measures like mean, median, standard deviation, and statistical significance.
- Frequently asked questions about the field address topics like laboratory research, cross-cultural comparisons, animal research ethics, and the value-laden nature of psychology.