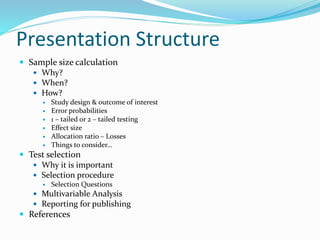
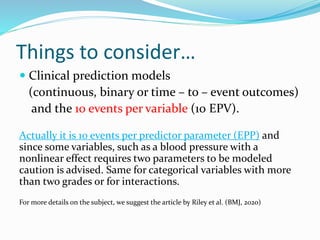
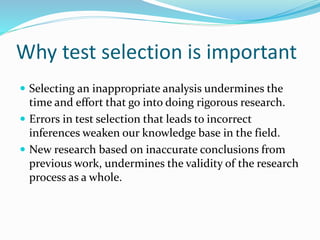
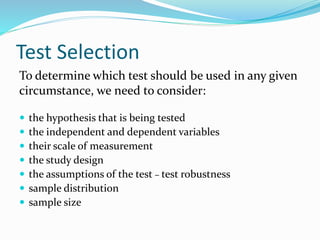
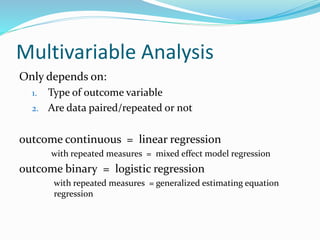
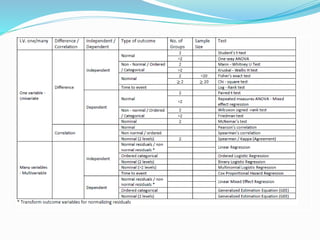
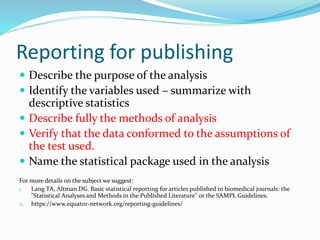
SlideShare a Scribd company logo
1 of 36
Sample Size estimation and a step-by-step approach for
choosing an appropriate statistical test for data analysis.
Vergoulas E.
Mathematician MSc
10th Scientific Conference Department of Medicine A.U.Th.
Round Table
Presentation Structure
 Sample size calculation
 Why?
 When?
 How?
 Study design & outcome of interest
 Error probabilities
 1 – tailed or 2 – tailed testing
 Effect size
 Allocation ratio – Losses
 Things to consider…
 Test selection
 Why it is important
 Selection procedure
 Selection Questions
 Multivariable Analysis
 Reporting for publishing
 References
Sample size calculation
Why?
 Ensures a high probability of the study achieving its
prespecified main objective
 In the absence of a priori sample size calculation there is no
knowledge of type I (false positive) and type II (false
negative) error.
When?
 Before the trial
 Can reduce the risk of an underpowered (false - negative) result in a well-
designed trial.
 Revision during the trial
 The study protocol should describe a comprehensive plan for the timing
and method of the potential modifications.
 Revisiting the sample size, without a formal statistical stopping rule, can
lead to the inflation of type I error so it is strongly advised to be avoided.
Similar problems can occur in larger than planned sample sizes.
How?
 Key components of sample size calculation
 Study design & outcome of interest
 Type I error or α (false positive) and Τype II error or β
(complement to power)
 1 – tailed or 2 – tailed testing
 Effect size or magnitude of the treatment effect
 Allocation ratio
 Losses
Study design & outcome of interest
 The approach of the hypothesis and questions asked define
the outcome of interest
 Moving from continuous to categorical outcome
measures increases sample size.
 Using non – parametric tests increases sample size.
 If there are secondary objectives they must be considered
during sample size calculation to ensure enough power
throughout the trial.
Error probabilities
 Type I error or α (false positive) and type II error or β
(false negative - complement to power)
Usually set at 5% and 20% respectively.
Deviations could happen based
on the nature of the study.
The smaller the probabilities
the larger the sample needed.
1 – tailed or 2 – tailed testing
 Usually when comparing two treatments we do not
know in advance which is better.
Use of 2 – tailed test is recommended unless justified.
Two tailed testing requires larger samples.
Effect size
 “Effect size is a simple way of quantifying the size of
the difference between two groups”
 It is scale free, can be comparable among studies
 Effect size* of 0,5 corresponds to: 69% of the control group
would be below the average person in the experimental group.
 0,5 is considered large effect
 0,3 medium effect (62%)
 0,1 small effect (54%)
 Large effect size leads to smaller samples – small effect size leads
to larger samples.
* effect size for mean difference between two groups
Effect size
 To calculate effect size* we require
 H0 = the null hypothesis
 H1 = alternative hypothesis
 The standard deviation of the samples
* effect size for mean difference between two groups
Effect size
 It is not an estimation of the population parameters
per se, but the treatment effect deem worthy* of
detecting
 Sample size calculation is our best estimate of a
required sample size not the absolute truth
* Minimum Important Difference: Specifies the difference between treatments
that would lead clinicians to change practice.
VS
Minimum Detectable Difference (MDD) - can be specified given the significance
level, power and sample size.
Statistical Significance ≠ Clinical Importance
Effect size
JAMA editorial 2019
Clinical interventions in
 Psychiatry median effect size of 0,41
 General medicine median effect size of 0,37
“What seems prudent is that trials of any new treatment
should assume the median observed in the field, and
those who hope for a much larger effect size should be
required to provide a strong justification for such
optimism.”
Effect size
 Population Variability
(large variance = smaller effect size = larger sample size)
 In case of uncommon conditions or if recruitment is
conducted among multiple locations higher variability
(consider larger sample) and higher heterogeneity
(higher generalizability of results).
Allocation ratio - Losses
 Allocation ratio
The more we diverge from 1 the larger the sample size
required.
 Losses
Factors such as losses to follow – up, non – compliance,
drop – outs, missing data etc. should be taken under
consideration. The sample size should be inflated based
on previous experience.
Sensitivity analysis
Part of this analysis will address issues that may rise due
to assumptions made in order to calculate sample size
and consequently the validity of the trial conclusions.
Some common scenarios
 Distribution assumptions
 Missing data
 Non – compliance
 Outliers
 Variation
 Definition of outcomes
Things to consider…
 Reader confidence increases when reporting a detailed
 sample size calculation
 detailed plan of data analysis
 Sample size calculation is strongly associated with
power analysis so it can help with the interpretation of
study findings when statistically significant effects
are not found.
“The effect under study might exist but is lower than the expected
and so the current trial could not detect it, thus it is likely to be of
little clinical benefit.”
Things to consider…
 Clinical prediction models
(continuous, binary or time – to – event outcomes)
and the 10 events per variable (10 EPV).
Actually it is 10 events per predictor parameter (EPP) and
since some variables, such as a blood pressure with a
nonlinear effect requires two parameters to be modeled
caution is advised. Same for categorical variables with more
than two grades or for interactions.
For more details on the subject, we suggest the article by Riley et al. (BMJ, 2020)
Statistical test selection
Why test selection is important
 Selecting an inappropriate analysis undermines the
time and effort that go into doing rigorous research.
 Errors in test selection that leads to incorrect
inferences weaken our knowledge base in the field.
 New research based on inaccurate conclusions from
previous work, undermines the validity of the research
process as a whole.
Test Selection
To determine which test should be used in any given
circumstance, we need to consider:
 the hypothesis that is being tested
 the independent and dependent variables
 their scale of measurement
 the study design
 the assumptions of the test – test robustness
 sample distribution
 sample size
Question 1
“Univariate” or “Multivariable”
What are the independent and dependent variables?
 Univariate – Unadjusted Analysis
 Multivariable – Adjusted Analysis
Question 2
"Difference" or "Correlation“
Do we want to test for a difference between groups or we
want to test for correlation between variables?
- Comparing mean (or median) of two groups (or more)
- Correlation between two variables in one group
Question 3
"Paired" or "Independent“
Are we measuring more than once from one sample /
population? (repeated measures, linked selection, or matching)
Are we measuring from different samples / populations?
Question 4
“Type of Outcome“
 Discrete/Categorical
 Nominal (sex, gene present, outcome of treatment,
cancer type)
 Ordinal (education, pain level, disease severity)
 Continuous / Interval ( age, income, blood pressure)
We can transform continuous data to discrete but with
justification and cost in power.
Question 5
Is the distribution of the outcome variable Normal?
This is a statistical guideline published by New England
Journal of Medicine.
"Exact methods should be used as extensively as possible in
the analysis of categorical data. For analysis of
measurements, nonparametric methods should be used to
compare groups when the distribution of the dependent
variable (the outcome variable) is not normal".
Question 5
Using a parametric statistical test when it is not
appropriate can be problematic for several reasons.
 The analysis of the data may result in a rejection of the null
hypothesis, because one of the assumptions of the test is
invalid. Hypothesis tests in general are sensitive detectors
not only of false hypotheses but also of false assumptions
in the model.
 Sometimes the data indicate strongly that the null
hypothesis is false, and neutralize each other in the test, so
that the test reveals nothing and the null hypothesis is
accepted.
Question 5
Non - parametric test are not without assumptions.
 Sampling (random)
 Independence or dependence of samples (varies by test)
but make no assumptions about the population.
Question 5
The result of a log
transformation
Use the Kolmogorov-Smirnov (K-S) and the Shapiro-Wilk (S-W) to test the
normality assumption also use a histogram to validate results.
The K-S & S-W tests are sensitive to large sample size.
In deciding whether a population is Gaussian, look at all available data, not just data in the current experiment.
Question 6
“Number of Groups”
How many groups are there for the independent
(predictor) variable?
- 2 levels? (t-test, chi-square, Mann-Whitney U, Wilcoxon T )
- 3 levels or more? (ANOVA, chi-square, Kruskal-Wallis H Test,)
Multivariable Analysis
Only depends on:
1. Type of outcome variable
2. Are data paired/repeated or not
outcome continuous = linear regression
with repeated measures = mixed effect model regression
outcome binary = logistic regression
with repeated measures = generalized estimating equation
regression
Reporting for publishing
 Describe the purpose of the analysis
 Identify the variables used – summarize with
descriptive statistics
 Describe fully the methods of analysis
 Verify that the data conformed to the assumptions of
the test used.
 Name the statistical package used in the analysis
For more details on the subject we suggest:
1. Lang TA, Altman DG. Basic statistical reporting for articles published in biomedical journals: the
"Statistical Analyses and Methods in the Published Literature" or the SAMPL Guidelines.
2. https://www.equator-network.org/reporting-guidelines/
References and useful links
1. Bhatt DL, Mehta C. Adaptive Designs for Clinical Trials. N Engl J Med. 2016 Jul 7;375(1):65-74. doi:
10.1056/NEJMra1510061. PMID: 27406349
2. Chan A, Tetzlaff J M, Gatzsche P C, Altman D G, Mann H, Berlin J A et al. SPIRIT 2013 explanation and
elaboration: guidance for protocols of clinical trials. BMJ. 2013; 346 :e7586 doi:10.1136/bmj.e7586
3. Coe R. It’s the effect size, stupid: what effect size is and why it is important. Paper presented at: Annual
Conference of the British Educational Research Association; September 12-14, 2002; Exeter, England.
http://www.leeds.ac.uk/educol/documents /00002182.htm. Accessed April 4, 2021.
4. Cook J A, Julious S A, Sones W, Hampson L V, Hewitt C, Berlin J A et al. DELTA2 guidance on choosing the
target difference and undertaking and reporting the sample size calculation for a randomised controlled
trial BMJ 2018; 363 :k3750 doi:10.1136/bmj.k3750
5. Dahiru T. (2008). P - value, a true test of statistical significance? A cautionary note. Annals of Ibadan
postgraduate medicine, 6(1), 21–26. https://doi.org/10.4314/aipm.v6i1.64038
6. Farrokhyar F, Reddy D, Poolman RW, Bhandari M. Why perform a priori sample size calculation? Can J Surg.
2013 Jun;56(3):207-13. doi: 10.1503/cjs.018012. PMID: 23706850; PMCID: PMC3672437
7. Kapur S, Munafò M. Small Sample Sizes and a False Economy for Psychiatric Clinical Trials. JAMA Psychiatry.
2019;76(7):676–677. doi:10.1001/jamapsychiatry.2019.0095
8. Kenneth F Schulz, David A Grimes, Sample size calculations in randomized trials: mandatory and mystical,
The Lancet, Volume 365, Issue 9467,2005, Pages 1348-1353, ISSN 0140-6736,
https://doi.org/10.1016/S0140-6736(05)61034-3
9. Krousel-Wood, M. A., Chambers, R. B., & Muntner, P. (2007). Clinicians' Guide to Statistics for Medical
Practice and Research: Part II. The Ochsner journal, 7(1), 3–7.
10. Lang TA, Altman DG. Basic statistical reporting for articles published in biomedical journals: the "Statistical
Analyses and Methods in the Published Literature" or the SAMPL Guidelines. Int J Nurs Stud. 2015
Jan;52(1):5-9. doi: 10.1016/j.ijnurstu.2014.09.006. Epub 2014 Sep 28. PMID: 25441757.
References and useful links
10. Riley R D, Ensor J, Snell K I E, Harrell F E, Martin G P, Reitsma J B et al. Calculating the sample size required
for developing a clinical prediction model BMJ 2020; 368 :m441 doi:10.1136/bmj.m441
11. Sedgwick P. Randomised controlled trials: the importance of sample size. BMJ 2015;350:h1586 doi:
https://doi.org/10.1136/bmj.h1586
12. Stokes L. Sample size calculation for a hypothesis test. JAMA. 2014 Jul;312(2):180-1. doi:
10.1001/jama.2014.8295. PMID: 25005655
13. Thabane, L., Mbuagbaw, L., Zhang, S. et al. A tutorial on sensitivity analyses in clinical trials: the what, why,
when and how. BMC Med Res Methodol 13, 92 (2013). https://doi.org/10.1186/1471-2288-13-92
14. Yuan I, Topjian AA, Kurth CD, Kirschen MP, Ward CG, Zhang B, Mensinger JL. Guide to the statistical
analysis plan. Paediatr Anaesth. 2019 Mar;29(3):237-242. doi: 10.1111/pan.13576. Epub 2019 Jan 29.
PMID: 30609103.
Links
1. https://stats.idre.ucla.edu/other/mult-pkg/whatstat/
2. https://www.bmj.com/about-bmj/resources-readers/publications/statistics-square-one/13-study-design-
and-choosing-statisti
3. http://www.biostathandbook.com/testchoice.html
4. http://rcompanion.org/handbook/D_03.html
5. http://www.wadsworth.com/psychology_d/templates/student_resources/workshops/stat_workshp/chos
e_stat/chose_stat_01.html
6. https://www.psychologie.hhu.de/arbeitsgruppen/allgemeine-psychologie-und-arbeitspsychologie/gpower
7. https://www.equator-network.org/reporting-guidelines/
Thank You!

More Related Content

What's hot

What's hot (20)

BIOSTATISTICS
BIOSTATISTICSBIOSTATISTICS
BIOSTATISTICS
 
Parametric tests
Parametric testsParametric tests
Parametric tests
 
Choosing appropriate statistical test RSS6 2104
Choosing appropriate statistical test RSS6 2104Choosing appropriate statistical test RSS6 2104
Choosing appropriate statistical test RSS6 2104
 
Parametric tests seminar
Parametric tests seminarParametric tests seminar
Parametric tests seminar
 
Wilcoxon signed rank test
Wilcoxon signed rank testWilcoxon signed rank test
Wilcoxon signed rank test
 
Non parametric test
Non parametric testNon parametric test
Non parametric test
 
Parametric tests
Parametric testsParametric tests
Parametric tests
 
Introduction to meta analysis
Introduction to meta analysisIntroduction to meta analysis
Introduction to meta analysis
 
Shovan anova main
Shovan anova mainShovan anova main
Shovan anova main
 
Randomisation
RandomisationRandomisation
Randomisation
 
Statistical Power
Statistical PowerStatistical Power
Statistical Power
 
L16 rm (systematic review and meta-analysis)-samer
L16 rm (systematic review and meta-analysis)-samerL16 rm (systematic review and meta-analysis)-samer
L16 rm (systematic review and meta-analysis)-samer
 
Confidence interval
Confidence intervalConfidence interval
Confidence interval
 
Statistical ppt
Statistical pptStatistical ppt
Statistical ppt
 
Methods of Randomization
Methods of RandomizationMethods of Randomization
Methods of Randomization
 
Repeated Measures ANOVA
Repeated Measures ANOVARepeated Measures ANOVA
Repeated Measures ANOVA
 
Non parametric test
Non parametric testNon parametric test
Non parametric test
 
Kruskal Wall Test
Kruskal Wall TestKruskal Wall Test
Kruskal Wall Test
 
Systematic review and meta analysis
Systematic review and meta analysisSystematic review and meta analysis
Systematic review and meta analysis
 
Observational Studies and their Reporting Guidelines
Observational Studies and their Reporting GuidelinesObservational Studies and their Reporting Guidelines
Observational Studies and their Reporting Guidelines
 

Similar to Sample Size and Statistical Test Selection Guide for Data Analysis

Sample size estimation
Sample size estimationSample size estimation
Sample size estimationHanaaBayomy
 
Sample size
Sample sizeSample size
Sample sizezubis
 
Sample size & meta analysis
Sample size & meta analysisSample size & meta analysis
Sample size & meta analysisdrsrb
 
Critical Appriaisal Skills Basic 1 | May 4th 2011
Critical Appriaisal Skills Basic 1 | May 4th 2011Critical Appriaisal Skills Basic 1 | May 4th 2011
Critical Appriaisal Skills Basic 1 | May 4th 2011NES
 
Biostatistics_Unit_II_ResearchMethodologyBiostatistics.pptx
Biostatistics_Unit_II_ResearchMethodologyBiostatistics.pptxBiostatistics_Unit_II_ResearchMethodologyBiostatistics.pptx
Biostatistics_Unit_II_ResearchMethodologyBiostatistics.pptxPrachi Pandey
 
Biostatistics_Unit_II_Research Methodology & Biostatistics_M. Pharm (Pharmace...
Biostatistics_Unit_II_Research Methodology & Biostatistics_M. Pharm (Pharmace...Biostatistics_Unit_II_Research Methodology & Biostatistics_M. Pharm (Pharmace...
Biostatistics_Unit_II_Research Methodology & Biostatistics_M. Pharm (Pharmace...RAHUL PAL
 
Vergoulas Choosing the appropriate statistical test (2019 Hippokratia journal)
Vergoulas Choosing the appropriate statistical test (2019 Hippokratia journal)Vergoulas Choosing the appropriate statistical test (2019 Hippokratia journal)
Vergoulas Choosing the appropriate statistical test (2019 Hippokratia journal)Vaggelis Vergoulas
 
Common statistical pitfalls in basic science research
Common statistical pitfalls in basic science researchCommon statistical pitfalls in basic science research
Common statistical pitfalls in basic science researchRamachandra Barik
 
Biostatistics clinical research & trials
Biostatistics clinical research & trialsBiostatistics clinical research & trials
Biostatistics clinical research & trialseclinicaltools
 
K7 - Critical Appraisal.pdf
K7 - Critical Appraisal.pdfK7 - Critical Appraisal.pdf
K7 - Critical Appraisal.pdfJeslynTengkawan1
 
P-values the gold measure of statistical validity are not as reliable as many...
P-values the gold measure of statistical validity are not as reliable as many...P-values the gold measure of statistical validity are not as reliable as many...
P-values the gold measure of statistical validity are not as reliable as many...David Pratap
 
Research methodology 101
Research methodology 101Research methodology 101
Research methodology 101Hesham Gaber
 
Advanced Biostatistics and Data Analysis abdul ghafoor sajjad
Advanced Biostatistics and Data Analysis abdul ghafoor sajjadAdvanced Biostatistics and Data Analysis abdul ghafoor sajjad
Advanced Biostatistics and Data Analysis abdul ghafoor sajjadHeadDPT
 
Poe_STUDY GUIDE_term 2.docx.pptx
Poe_STUDY GUIDE_term 2.docx.pptxPoe_STUDY GUIDE_term 2.docx.pptx
Poe_STUDY GUIDE_term 2.docx.pptxBlackStunnerjunior
 
Comparing research designs fw 2013 handout version
Comparing research designs fw 2013 handout versionComparing research designs fw 2013 handout version
Comparing research designs fw 2013 handout versionPat Barlow
 
SAMPLE SIZE CALCULATION IN DIFFERENT STUDY DESIGNS AT.pptx
SAMPLE SIZE CALCULATION IN DIFFERENT STUDY DESIGNS AT.pptxSAMPLE SIZE CALCULATION IN DIFFERENT STUDY DESIGNS AT.pptx
SAMPLE SIZE CALCULATION IN DIFFERENT STUDY DESIGNS AT.pptxssuserd509321
 
Statistics in meta analysis
Statistics in meta analysisStatistics in meta analysis
Statistics in meta analysisDr Shri Sangle
 

Similar to Sample Size and Statistical Test Selection Guide for Data Analysis (20)

Sample size estimation
Sample size estimationSample size estimation
Sample size estimation
 
Sample size
Sample sizeSample size
Sample size
 
Sample size & meta analysis
Sample size & meta analysisSample size & meta analysis
Sample size & meta analysis
 
Critical Appriaisal Skills Basic 1 | May 4th 2011
Critical Appriaisal Skills Basic 1 | May 4th 2011Critical Appriaisal Skills Basic 1 | May 4th 2011
Critical Appriaisal Skills Basic 1 | May 4th 2011
 
Biostatistics_Unit_II_ResearchMethodologyBiostatistics.pptx
Biostatistics_Unit_II_ResearchMethodologyBiostatistics.pptxBiostatistics_Unit_II_ResearchMethodologyBiostatistics.pptx
Biostatistics_Unit_II_ResearchMethodologyBiostatistics.pptx
 
Biostatistics_Unit_II_Research Methodology & Biostatistics_M. Pharm (Pharmace...
Biostatistics_Unit_II_Research Methodology & Biostatistics_M. Pharm (Pharmace...Biostatistics_Unit_II_Research Methodology & Biostatistics_M. Pharm (Pharmace...
Biostatistics_Unit_II_Research Methodology & Biostatistics_M. Pharm (Pharmace...
 
bias and error-final 1.pptx
bias and error-final 1.pptxbias and error-final 1.pptx
bias and error-final 1.pptx
 
Vergoulas Choosing the appropriate statistical test (2019 Hippokratia journal)
Vergoulas Choosing the appropriate statistical test (2019 Hippokratia journal)Vergoulas Choosing the appropriate statistical test (2019 Hippokratia journal)
Vergoulas Choosing the appropriate statistical test (2019 Hippokratia journal)
 
Common statistical pitfalls in basic science research
Common statistical pitfalls in basic science researchCommon statistical pitfalls in basic science research
Common statistical pitfalls in basic science research
 
Biostatistics clinical research & trials
Biostatistics clinical research & trialsBiostatistics clinical research & trials
Biostatistics clinical research & trials
 
K7 - Critical Appraisal.pdf
K7 - Critical Appraisal.pdfK7 - Critical Appraisal.pdf
K7 - Critical Appraisal.pdf
 
P-values the gold measure of statistical validity are not as reliable as many...
P-values the gold measure of statistical validity are not as reliable as many...P-values the gold measure of statistical validity are not as reliable as many...
P-values the gold measure of statistical validity are not as reliable as many...
 
Research methodology 101
Research methodology 101Research methodology 101
Research methodology 101
 
Clinical trials
Clinical trials Clinical trials
Clinical trials
 
Advanced Biostatistics and Data Analysis abdul ghafoor sajjad
Advanced Biostatistics and Data Analysis abdul ghafoor sajjadAdvanced Biostatistics and Data Analysis abdul ghafoor sajjad
Advanced Biostatistics and Data Analysis abdul ghafoor sajjad
 
Hypo
HypoHypo
Hypo
 
Poe_STUDY GUIDE_term 2.docx.pptx
Poe_STUDY GUIDE_term 2.docx.pptxPoe_STUDY GUIDE_term 2.docx.pptx
Poe_STUDY GUIDE_term 2.docx.pptx
 
Comparing research designs fw 2013 handout version
Comparing research designs fw 2013 handout versionComparing research designs fw 2013 handout version
Comparing research designs fw 2013 handout version
 
SAMPLE SIZE CALCULATION IN DIFFERENT STUDY DESIGNS AT.pptx
SAMPLE SIZE CALCULATION IN DIFFERENT STUDY DESIGNS AT.pptxSAMPLE SIZE CALCULATION IN DIFFERENT STUDY DESIGNS AT.pptx
SAMPLE SIZE CALCULATION IN DIFFERENT STUDY DESIGNS AT.pptx
 
Statistics in meta analysis
Statistics in meta analysisStatistics in meta analysis
Statistics in meta analysis
 

Recently uploaded

Mature dropshipping via API with DroFx.pptx
Mature dropshipping via API with DroFx.pptxMature dropshipping via API with DroFx.pptx
Mature dropshipping via API with DroFx.pptxolyaivanovalion
 
Kantar AI Summit- Under Embargo till Wednesday, 24th April 2024, 4 PM, IST.pdf
Kantar AI Summit- Under Embargo till Wednesday, 24th April 2024, 4 PM, IST.pdfKantar AI Summit- Under Embargo till Wednesday, 24th April 2024, 4 PM, IST.pdf
Kantar AI Summit- Under Embargo till Wednesday, 24th April 2024, 4 PM, IST.pdfSocial Samosa
 
Ukraine War presentation: KNOW THE BASICS
Ukraine War presentation: KNOW THE BASICSUkraine War presentation: KNOW THE BASICS
Ukraine War presentation: KNOW THE BASICSAishani27
 
Industrialised data - the key to AI success.pdf
Industrialised data - the key to AI success.pdfIndustrialised data - the key to AI success.pdf
Industrialised data - the key to AI success.pdfLars Albertsson
 
VidaXL dropshipping via API with DroFx.pptx
VidaXL dropshipping via API with DroFx.pptxVidaXL dropshipping via API with DroFx.pptx
VidaXL dropshipping via API with DroFx.pptxolyaivanovalion
 
VIP Call Girls Service Miyapur Hyderabad Call +91-8250192130
VIP Call Girls Service Miyapur Hyderabad Call +91-8250192130VIP Call Girls Service Miyapur Hyderabad Call +91-8250192130
VIP Call Girls Service Miyapur Hyderabad Call +91-8250192130Suhani Kapoor
 
04242024_CCC TUG_Joins and Relationships
04242024_CCC TUG_Joins and Relationships04242024_CCC TUG_Joins and Relationships
04242024_CCC TUG_Joins and Relationshipsccctableauusergroup
 
Introduction-to-Machine-Learning (1).pptx
Introduction-to-Machine-Learning (1).pptxIntroduction-to-Machine-Learning (1).pptx
Introduction-to-Machine-Learning (1).pptxfirstjob4
 
Market Analysis in the 5 Largest Economic Countries in Southeast Asia.pdf
Market Analysis in the 5 Largest Economic Countries in Southeast Asia.pdfMarket Analysis in the 5 Largest Economic Countries in Southeast Asia.pdf
Market Analysis in the 5 Largest Economic Countries in Southeast Asia.pdfRachmat Ramadhan H
 
Week-01-2.ppt BBB human Computer interaction
Week-01-2.ppt BBB human Computer interactionWeek-01-2.ppt BBB human Computer interaction
Week-01-2.ppt BBB human Computer interactionfulawalesam
 
Halmar dropshipping via API with DroFx
Halmar  dropshipping  via API with DroFxHalmar  dropshipping  via API with DroFx
Halmar dropshipping via API with DroFxolyaivanovalion
 
(ISHITA) Call Girls Service Hyderabad Call Now 8617697112 Hyderabad Escorts
(ISHITA) Call Girls Service Hyderabad Call Now 8617697112 Hyderabad Escorts(ISHITA) Call Girls Service Hyderabad Call Now 8617697112 Hyderabad Escorts
(ISHITA) Call Girls Service Hyderabad Call Now 8617697112 Hyderabad EscortsCall girls in Ahmedabad High profile
 
Invezz.com - Grow your wealth with trading signals
Invezz.com - Grow your wealth with trading signalsInvezz.com - Grow your wealth with trading signals
Invezz.com - Grow your wealth with trading signalsInvezz1
 
Smarteg dropshipping via API with DroFx.pptx
Smarteg dropshipping via API with DroFx.pptxSmarteg dropshipping via API with DroFx.pptx
Smarteg dropshipping via API with DroFx.pptxolyaivanovalion
 
VIP Call Girls in Amravati Aarohi 8250192130 Independent Escort Service Amravati
VIP Call Girls in Amravati Aarohi 8250192130 Independent Escort Service AmravatiVIP Call Girls in Amravati Aarohi 8250192130 Independent Escort Service Amravati
VIP Call Girls in Amravati Aarohi 8250192130 Independent Escort Service AmravatiSuhani Kapoor
 
100-Concepts-of-AI by Anupama Kate .pptx
100-Concepts-of-AI by Anupama Kate .pptx100-Concepts-of-AI by Anupama Kate .pptx
100-Concepts-of-AI by Anupama Kate .pptxAnupama Kate
 
April 2024 - Crypto Market Report's Analysis
April 2024 - Crypto Market Report's AnalysisApril 2024 - Crypto Market Report's Analysis
April 2024 - Crypto Market Report's Analysismanisha194592
 
Generative AI on Enterprise Cloud with NiFi and Milvus
Generative AI on Enterprise Cloud with NiFi and MilvusGenerative AI on Enterprise Cloud with NiFi and Milvus
Generative AI on Enterprise Cloud with NiFi and MilvusTimothy Spann
 
Call Girls In Mahipalpur O9654467111 Escorts Service
Call Girls In Mahipalpur O9654467111  Escorts ServiceCall Girls In Mahipalpur O9654467111  Escorts Service
Call Girls In Mahipalpur O9654467111 Escorts ServiceSapana Sha
 

Recently uploaded (20)

Mature dropshipping via API with DroFx.pptx
Mature dropshipping via API with DroFx.pptxMature dropshipping via API with DroFx.pptx
Mature dropshipping via API with DroFx.pptx
 
Kantar AI Summit- Under Embargo till Wednesday, 24th April 2024, 4 PM, IST.pdf
Kantar AI Summit- Under Embargo till Wednesday, 24th April 2024, 4 PM, IST.pdfKantar AI Summit- Under Embargo till Wednesday, 24th April 2024, 4 PM, IST.pdf
Kantar AI Summit- Under Embargo till Wednesday, 24th April 2024, 4 PM, IST.pdf
 
Ukraine War presentation: KNOW THE BASICS
Ukraine War presentation: KNOW THE BASICSUkraine War presentation: KNOW THE BASICS
Ukraine War presentation: KNOW THE BASICS
 
Industrialised data - the key to AI success.pdf
Industrialised data - the key to AI success.pdfIndustrialised data - the key to AI success.pdf
Industrialised data - the key to AI success.pdf
 
VidaXL dropshipping via API with DroFx.pptx
VidaXL dropshipping via API with DroFx.pptxVidaXL dropshipping via API with DroFx.pptx
VidaXL dropshipping via API with DroFx.pptx
 
VIP Call Girls Service Miyapur Hyderabad Call +91-8250192130
VIP Call Girls Service Miyapur Hyderabad Call +91-8250192130VIP Call Girls Service Miyapur Hyderabad Call +91-8250192130
VIP Call Girls Service Miyapur Hyderabad Call +91-8250192130
 
04242024_CCC TUG_Joins and Relationships
04242024_CCC TUG_Joins and Relationships04242024_CCC TUG_Joins and Relationships
04242024_CCC TUG_Joins and Relationships
 
Introduction-to-Machine-Learning (1).pptx
Introduction-to-Machine-Learning (1).pptxIntroduction-to-Machine-Learning (1).pptx
Introduction-to-Machine-Learning (1).pptx
 
Market Analysis in the 5 Largest Economic Countries in Southeast Asia.pdf
Market Analysis in the 5 Largest Economic Countries in Southeast Asia.pdfMarket Analysis in the 5 Largest Economic Countries in Southeast Asia.pdf
Market Analysis in the 5 Largest Economic Countries in Southeast Asia.pdf
 
Week-01-2.ppt BBB human Computer interaction
Week-01-2.ppt BBB human Computer interactionWeek-01-2.ppt BBB human Computer interaction
Week-01-2.ppt BBB human Computer interaction
 
Halmar dropshipping via API with DroFx
Halmar  dropshipping  via API with DroFxHalmar  dropshipping  via API with DroFx
Halmar dropshipping via API with DroFx
 
(ISHITA) Call Girls Service Hyderabad Call Now 8617697112 Hyderabad Escorts
(ISHITA) Call Girls Service Hyderabad Call Now 8617697112 Hyderabad Escorts(ISHITA) Call Girls Service Hyderabad Call Now 8617697112 Hyderabad Escorts
(ISHITA) Call Girls Service Hyderabad Call Now 8617697112 Hyderabad Escorts
 
Invezz.com - Grow your wealth with trading signals
Invezz.com - Grow your wealth with trading signalsInvezz.com - Grow your wealth with trading signals
Invezz.com - Grow your wealth with trading signals
 
Smarteg dropshipping via API with DroFx.pptx
Smarteg dropshipping via API with DroFx.pptxSmarteg dropshipping via API with DroFx.pptx
Smarteg dropshipping via API with DroFx.pptx
 
꧁❤ Aerocity Call Girls Service Aerocity Delhi ❤꧂ 9999965857 ☎️ Hard And Sexy ...
꧁❤ Aerocity Call Girls Service Aerocity Delhi ❤꧂ 9999965857 ☎️ Hard And Sexy ...꧁❤ Aerocity Call Girls Service Aerocity Delhi ❤꧂ 9999965857 ☎️ Hard And Sexy ...
꧁❤ Aerocity Call Girls Service Aerocity Delhi ❤꧂ 9999965857 ☎️ Hard And Sexy ...
 
VIP Call Girls in Amravati Aarohi 8250192130 Independent Escort Service Amravati
VIP Call Girls in Amravati Aarohi 8250192130 Independent Escort Service AmravatiVIP Call Girls in Amravati Aarohi 8250192130 Independent Escort Service Amravati
VIP Call Girls in Amravati Aarohi 8250192130 Independent Escort Service Amravati
 
100-Concepts-of-AI by Anupama Kate .pptx
100-Concepts-of-AI by Anupama Kate .pptx100-Concepts-of-AI by Anupama Kate .pptx
100-Concepts-of-AI by Anupama Kate .pptx
 
April 2024 - Crypto Market Report's Analysis
April 2024 - Crypto Market Report's AnalysisApril 2024 - Crypto Market Report's Analysis
April 2024 - Crypto Market Report's Analysis
 
Generative AI on Enterprise Cloud with NiFi and Milvus
Generative AI on Enterprise Cloud with NiFi and MilvusGenerative AI on Enterprise Cloud with NiFi and Milvus
Generative AI on Enterprise Cloud with NiFi and Milvus
 
Call Girls In Mahipalpur O9654467111 Escorts Service
Call Girls In Mahipalpur O9654467111  Escorts ServiceCall Girls In Mahipalpur O9654467111  Escorts Service
Call Girls In Mahipalpur O9654467111 Escorts Service
 

Sample Size and Statistical Test Selection Guide for Data Analysis

  • 1. Sample Size estimation and a step-by-step approach for choosing an appropriate statistical test for data analysis. Vergoulas E. Mathematician MSc 10th Scientific Conference Department of Medicine A.U.Th. Round Table
  • 2. Presentation Structure  Sample size calculation  Why?  When?  How?  Study design & outcome of interest  Error probabilities  1 – tailed or 2 – tailed testing  Effect size  Allocation ratio – Losses  Things to consider…  Test selection  Why it is important  Selection procedure  Selection Questions  Multivariable Analysis  Reporting for publishing  References
  • 4. Why?  Ensures a high probability of the study achieving its prespecified main objective  In the absence of a priori sample size calculation there is no knowledge of type I (false positive) and type II (false negative) error.
  • 5. When?  Before the trial  Can reduce the risk of an underpowered (false - negative) result in a well- designed trial.  Revision during the trial  The study protocol should describe a comprehensive plan for the timing and method of the potential modifications.  Revisiting the sample size, without a formal statistical stopping rule, can lead to the inflation of type I error so it is strongly advised to be avoided. Similar problems can occur in larger than planned sample sizes.
  • 6. How?  Key components of sample size calculation  Study design & outcome of interest  Type I error or α (false positive) and Τype II error or β (complement to power)  1 – tailed or 2 – tailed testing  Effect size or magnitude of the treatment effect  Allocation ratio  Losses
  • 7. Study design & outcome of interest  The approach of the hypothesis and questions asked define the outcome of interest  Moving from continuous to categorical outcome measures increases sample size.  Using non – parametric tests increases sample size.  If there are secondary objectives they must be considered during sample size calculation to ensure enough power throughout the trial.
  • 8. Error probabilities  Type I error or α (false positive) and type II error or β (false negative - complement to power) Usually set at 5% and 20% respectively. Deviations could happen based on the nature of the study. The smaller the probabilities the larger the sample needed.
  • 9. 1 – tailed or 2 – tailed testing  Usually when comparing two treatments we do not know in advance which is better. Use of 2 – tailed test is recommended unless justified. Two tailed testing requires larger samples.
  • 10. Effect size  “Effect size is a simple way of quantifying the size of the difference between two groups”  It is scale free, can be comparable among studies  Effect size* of 0,5 corresponds to: 69% of the control group would be below the average person in the experimental group.  0,5 is considered large effect  0,3 medium effect (62%)  0,1 small effect (54%)  Large effect size leads to smaller samples – small effect size leads to larger samples. * effect size for mean difference between two groups
  • 11. Effect size  To calculate effect size* we require  H0 = the null hypothesis  H1 = alternative hypothesis  The standard deviation of the samples * effect size for mean difference between two groups
  • 12. Effect size  It is not an estimation of the population parameters per se, but the treatment effect deem worthy* of detecting  Sample size calculation is our best estimate of a required sample size not the absolute truth * Minimum Important Difference: Specifies the difference between treatments that would lead clinicians to change practice. VS Minimum Detectable Difference (MDD) - can be specified given the significance level, power and sample size. Statistical Significance ≠ Clinical Importance
  • 13. Effect size JAMA editorial 2019 Clinical interventions in  Psychiatry median effect size of 0,41  General medicine median effect size of 0,37 “What seems prudent is that trials of any new treatment should assume the median observed in the field, and those who hope for a much larger effect size should be required to provide a strong justification for such optimism.”
  • 14. Effect size  Population Variability (large variance = smaller effect size = larger sample size)  In case of uncommon conditions or if recruitment is conducted among multiple locations higher variability (consider larger sample) and higher heterogeneity (higher generalizability of results).
  • 15. Allocation ratio - Losses  Allocation ratio The more we diverge from 1 the larger the sample size required.  Losses Factors such as losses to follow – up, non – compliance, drop – outs, missing data etc. should be taken under consideration. The sample size should be inflated based on previous experience.
  • 16. Sensitivity analysis Part of this analysis will address issues that may rise due to assumptions made in order to calculate sample size and consequently the validity of the trial conclusions. Some common scenarios  Distribution assumptions  Missing data  Non – compliance  Outliers  Variation  Definition of outcomes
  • 17. Things to consider…  Reader confidence increases when reporting a detailed  sample size calculation  detailed plan of data analysis  Sample size calculation is strongly associated with power analysis so it can help with the interpretation of study findings when statistically significant effects are not found. “The effect under study might exist but is lower than the expected and so the current trial could not detect it, thus it is likely to be of little clinical benefit.”
  • 18. Things to consider…  Clinical prediction models (continuous, binary or time – to – event outcomes) and the 10 events per variable (10 EPV). Actually it is 10 events per predictor parameter (EPP) and since some variables, such as a blood pressure with a nonlinear effect requires two parameters to be modeled caution is advised. Same for categorical variables with more than two grades or for interactions. For more details on the subject, we suggest the article by Riley et al. (BMJ, 2020)
  • 20. Why test selection is important  Selecting an inappropriate analysis undermines the time and effort that go into doing rigorous research.  Errors in test selection that leads to incorrect inferences weaken our knowledge base in the field.  New research based on inaccurate conclusions from previous work, undermines the validity of the research process as a whole.
  • 21. Test Selection To determine which test should be used in any given circumstance, we need to consider:  the hypothesis that is being tested  the independent and dependent variables  their scale of measurement  the study design  the assumptions of the test – test robustness  sample distribution  sample size
  • 22. Question 1 “Univariate” or “Multivariable” What are the independent and dependent variables?  Univariate – Unadjusted Analysis  Multivariable – Adjusted Analysis
  • 23. Question 2 "Difference" or "Correlation“ Do we want to test for a difference between groups or we want to test for correlation between variables? - Comparing mean (or median) of two groups (or more) - Correlation between two variables in one group
  • 24. Question 3 "Paired" or "Independent“ Are we measuring more than once from one sample / population? (repeated measures, linked selection, or matching) Are we measuring from different samples / populations?
  • 25. Question 4 “Type of Outcome“  Discrete/Categorical  Nominal (sex, gene present, outcome of treatment, cancer type)  Ordinal (education, pain level, disease severity)  Continuous / Interval ( age, income, blood pressure) We can transform continuous data to discrete but with justification and cost in power.
  • 26. Question 5 Is the distribution of the outcome variable Normal? This is a statistical guideline published by New England Journal of Medicine. "Exact methods should be used as extensively as possible in the analysis of categorical data. For analysis of measurements, nonparametric methods should be used to compare groups when the distribution of the dependent variable (the outcome variable) is not normal".
  • 27. Question 5 Using a parametric statistical test when it is not appropriate can be problematic for several reasons.  The analysis of the data may result in a rejection of the null hypothesis, because one of the assumptions of the test is invalid. Hypothesis tests in general are sensitive detectors not only of false hypotheses but also of false assumptions in the model.  Sometimes the data indicate strongly that the null hypothesis is false, and neutralize each other in the test, so that the test reveals nothing and the null hypothesis is accepted.
  • 28. Question 5 Non - parametric test are not without assumptions.  Sampling (random)  Independence or dependence of samples (varies by test) but make no assumptions about the population.
  • 29. Question 5 The result of a log transformation Use the Kolmogorov-Smirnov (K-S) and the Shapiro-Wilk (S-W) to test the normality assumption also use a histogram to validate results. The K-S & S-W tests are sensitive to large sample size. In deciding whether a population is Gaussian, look at all available data, not just data in the current experiment.
  • 30. Question 6 “Number of Groups” How many groups are there for the independent (predictor) variable? - 2 levels? (t-test, chi-square, Mann-Whitney U, Wilcoxon T ) - 3 levels or more? (ANOVA, chi-square, Kruskal-Wallis H Test,)
  • 31. Multivariable Analysis Only depends on: 1. Type of outcome variable 2. Are data paired/repeated or not outcome continuous = linear regression with repeated measures = mixed effect model regression outcome binary = logistic regression with repeated measures = generalized estimating equation regression
  • 32.
  • 33. Reporting for publishing  Describe the purpose of the analysis  Identify the variables used – summarize with descriptive statistics  Describe fully the methods of analysis  Verify that the data conformed to the assumptions of the test used.  Name the statistical package used in the analysis For more details on the subject we suggest: 1. Lang TA, Altman DG. Basic statistical reporting for articles published in biomedical journals: the "Statistical Analyses and Methods in the Published Literature" or the SAMPL Guidelines. 2. https://www.equator-network.org/reporting-guidelines/
  • 34. References and useful links 1. Bhatt DL, Mehta C. Adaptive Designs for Clinical Trials. N Engl J Med. 2016 Jul 7;375(1):65-74. doi: 10.1056/NEJMra1510061. PMID: 27406349 2. Chan A, Tetzlaff J M, Gatzsche P C, Altman D G, Mann H, Berlin J A et al. SPIRIT 2013 explanation and elaboration: guidance for protocols of clinical trials. BMJ. 2013; 346 :e7586 doi:10.1136/bmj.e7586 3. Coe R. It’s the effect size, stupid: what effect size is and why it is important. Paper presented at: Annual Conference of the British Educational Research Association; September 12-14, 2002; Exeter, England. http://www.leeds.ac.uk/educol/documents /00002182.htm. Accessed April 4, 2021. 4. Cook J A, Julious S A, Sones W, Hampson L V, Hewitt C, Berlin J A et al. DELTA2 guidance on choosing the target difference and undertaking and reporting the sample size calculation for a randomised controlled trial BMJ 2018; 363 :k3750 doi:10.1136/bmj.k3750 5. Dahiru T. (2008). P - value, a true test of statistical significance? A cautionary note. Annals of Ibadan postgraduate medicine, 6(1), 21–26. https://doi.org/10.4314/aipm.v6i1.64038 6. Farrokhyar F, Reddy D, Poolman RW, Bhandari M. Why perform a priori sample size calculation? Can J Surg. 2013 Jun;56(3):207-13. doi: 10.1503/cjs.018012. PMID: 23706850; PMCID: PMC3672437 7. Kapur S, Munafò M. Small Sample Sizes and a False Economy for Psychiatric Clinical Trials. JAMA Psychiatry. 2019;76(7):676–677. doi:10.1001/jamapsychiatry.2019.0095 8. Kenneth F Schulz, David A Grimes, Sample size calculations in randomized trials: mandatory and mystical, The Lancet, Volume 365, Issue 9467,2005, Pages 1348-1353, ISSN 0140-6736, https://doi.org/10.1016/S0140-6736(05)61034-3 9. Krousel-Wood, M. A., Chambers, R. B., & Muntner, P. (2007). Clinicians' Guide to Statistics for Medical Practice and Research: Part II. The Ochsner journal, 7(1), 3–7. 10. Lang TA, Altman DG. Basic statistical reporting for articles published in biomedical journals: the "Statistical Analyses and Methods in the Published Literature" or the SAMPL Guidelines. Int J Nurs Stud. 2015 Jan;52(1):5-9. doi: 10.1016/j.ijnurstu.2014.09.006. Epub 2014 Sep 28. PMID: 25441757.
  • 35. References and useful links 10. Riley R D, Ensor J, Snell K I E, Harrell F E, Martin G P, Reitsma J B et al. Calculating the sample size required for developing a clinical prediction model BMJ 2020; 368 :m441 doi:10.1136/bmj.m441 11. Sedgwick P. Randomised controlled trials: the importance of sample size. BMJ 2015;350:h1586 doi: https://doi.org/10.1136/bmj.h1586 12. Stokes L. Sample size calculation for a hypothesis test. JAMA. 2014 Jul;312(2):180-1. doi: 10.1001/jama.2014.8295. PMID: 25005655 13. Thabane, L., Mbuagbaw, L., Zhang, S. et al. A tutorial on sensitivity analyses in clinical trials: the what, why, when and how. BMC Med Res Methodol 13, 92 (2013). https://doi.org/10.1186/1471-2288-13-92 14. Yuan I, Topjian AA, Kurth CD, Kirschen MP, Ward CG, Zhang B, Mensinger JL. Guide to the statistical analysis plan. Paediatr Anaesth. 2019 Mar;29(3):237-242. doi: 10.1111/pan.13576. Epub 2019 Jan 29. PMID: 30609103. Links 1. https://stats.idre.ucla.edu/other/mult-pkg/whatstat/ 2. https://www.bmj.com/about-bmj/resources-readers/publications/statistics-square-one/13-study-design- and-choosing-statisti 3. http://www.biostathandbook.com/testchoice.html 4. http://rcompanion.org/handbook/D_03.html 5. http://www.wadsworth.com/psychology_d/templates/student_resources/workshops/stat_workshp/chos e_stat/chose_stat_01.html 6. https://www.psychologie.hhu.de/arbeitsgruppen/allgemeine-psychologie-und-arbeitspsychologie/gpower 7. https://www.equator-network.org/reporting-guidelines/