Downloaded 82 times

![Example:
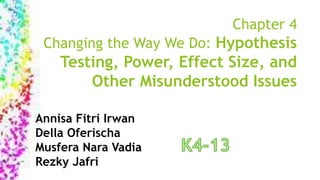
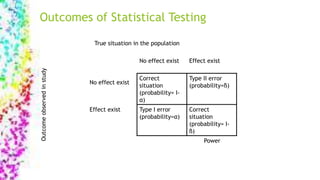
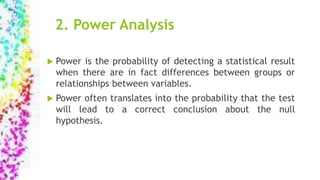
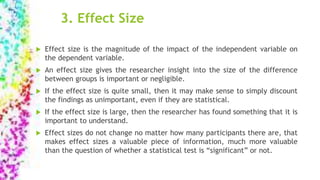
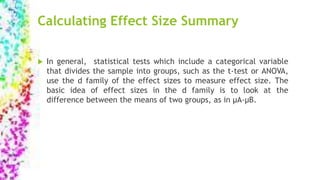
HR: Will 15 minutes of practice of meaningful drills result in
more accurate grammar scores than 15 minutes of telling a story
where the grammar in question must be used?
H0 : There is no [statistical] difference between a group which
practices grammar using explicit meaningful drills for 15 minutes
each day and a group which uses grammar implicitly by telling
stories where the grammar is needed for 15 minutes each day.
Ha: There is a [statistical] difference between the explicit and
implicit group.](https://image.slidesharecdn.com/statisticskel-150921051339-lva1-app6891/85/STATISTICS-Changing-the-way-we-do-Hypothesis-testing-effect-size-power-and-other-misunderstood-issues-4-320.jpg)
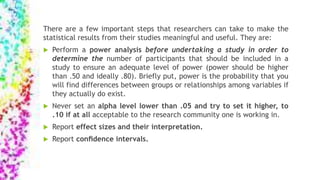
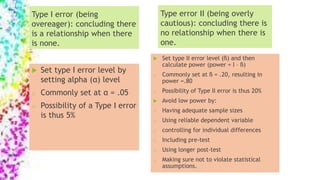
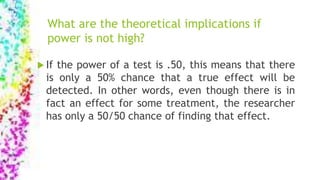
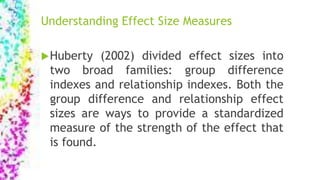
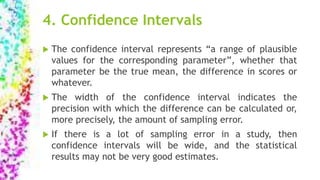
![ Since only two groups are being compared, a t-test can be used. The
t-test statistic is calculated based on three pieces of information.:
the mean scores of the groups, their variances, and the size of each
group (the sample size).
In NHST process, we should have already decided on a cut-off level
that we will use to consider the results of the statistic test extreme.
This is called alpha level or significant level.
Baayen (2008) “if the p-value is lower than alpha level we set, we
reject the null hypothesis and accept the alternative hypothesis that
there is a difference between the two groups (it does not necessarily
mean the alternative hypothesis is correct)”
P-value: the probability of finding a [insert statistic name here] this
large or larger if the null hypothesis were true is [insert p-value].](https://image.slidesharecdn.com/statisticskel-150921051339-lva1-app6891/85/STATISTICS-Changing-the-way-we-do-Hypothesis-testing-effect-size-power-and-other-misunderstood-issues-5-320.jpg)
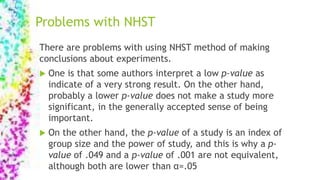
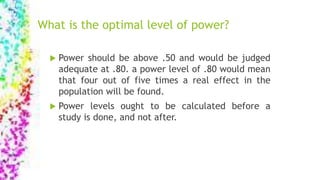
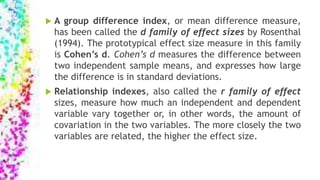
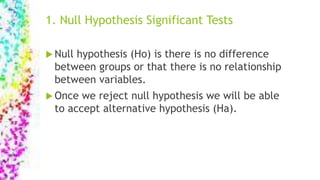
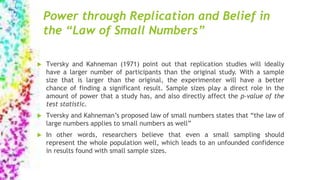
![Table 4.6 Options for Computing Standardizers (the Denominator
for d Family Effect Sizes)
A The standard deviation of one of the groups, perhaps most
typically the control group
B The pooled standard deviation of [only the groups] being
compared
C The pooled standard deviation [of all the groups] in the
design](https://image.slidesharecdn.com/statisticskel-150921051339-lva1-app6891/85/STATISTICS-Changing-the-way-we-do-Hypothesis-testing-effect-size-power-and-other-misunderstood-issues-20-320.jpg)


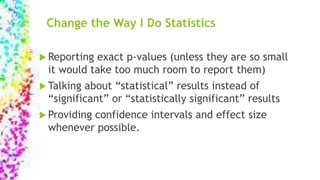
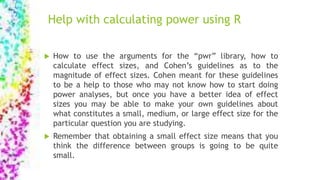
Researchers should take several steps to make statistical results meaningful: 1. Perform a power analysis to determine adequate sample size and ensure power is above .50, ideally .80. Power is the probability of detecting real effects. 2. Never set the alpha level lower than .05 and try to set it higher to .10 if acceptable. 3. Report effect sizes and confidence intervals to provide context around statistical significance. Effect sizes indicate the magnitude of differences between groups.


