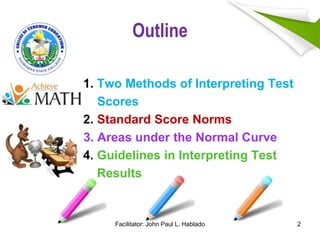
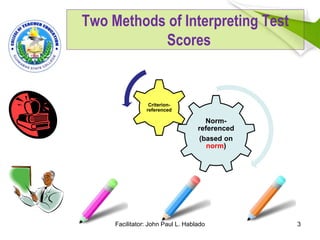
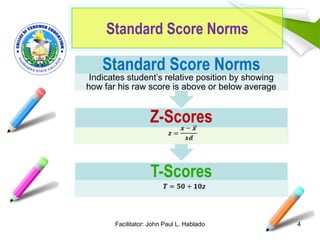
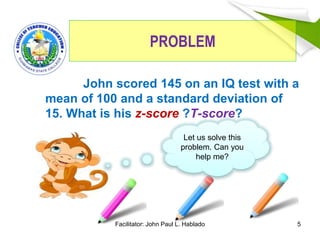
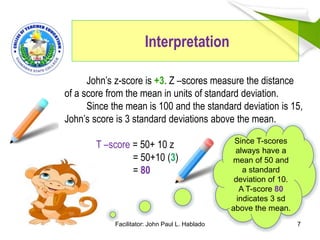
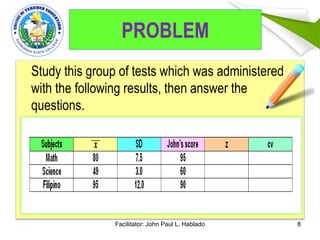
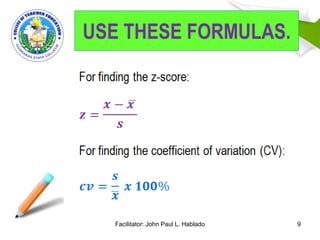
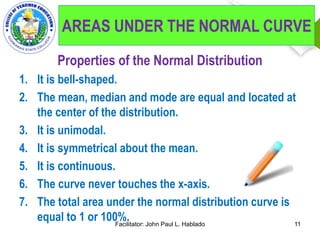
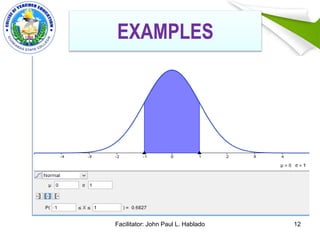
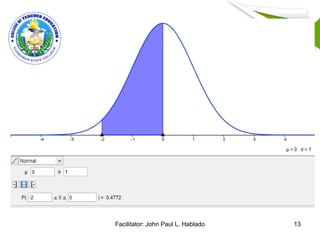
INTERPRETING TEST
RESULTS
John Paul L. Hablado
Discussant
Outline
1. Two Methods of Interpreting Test
Scores
2. Standard Score Norms
3. Areas under the Normal Curve
4. Guidelines in Interpreting Test
Results
2Facilitator: John Paul L. Hablado
Two Methods of Interpreting Test
Scores
3
Norm-
referenced
(based on
norm)
Criterion-
referenced
Facilitator: John Paul L. Hablado
Standard Score Norms
4
T-Scores
Z-Scores
Standard Score Norms
Indicates student’s relative position by showing
how far his raw score is above or below average
Facilitator: John Paul L. Hablado
PROBLEM
John scored 145 on an IQ test with a
mean of 100 and a standard deviation of
15. What is his z-score ?T-score?
5
Let us solve this
problem. Can you
help me?
Facilitator: John Paul L. Hablado
Facilitator: John Paul L. Hablado 6
SOLUTION
It is easy,
isn’t it?Let’s do it!
Interpretation
7
John’s z-score is +3. Z –scores measure the distance
of a score from the mean in units of standard deviation.
Since the mean is 100 and the standard deviation is 15,
John’s score is 3 standard deviations above the mean.
T –score = 50+ 10 z
= 50+10 (3)
= 80
Since T-scores
always have a
mean of 50 and
a standard
deviation of 10.
A T-score 80
indicates 3 sd
above the mean.
Facilitator: John Paul L. Hablado
PROBLEM
Study this group of tests which was administered
with the following results, then answer the
questions.
Facilitator: John Paul L. Hablado 8
Facilitator: John Paul L. Hablado 9
USE THESE FORMULAS.
Facilitator: John Paul L. Hablado 10
QUESTIONS
Properties of the Normal Distribution
1. It is bell-shaped.
2. The mean, median and mode are equal and located at
the center of the distribution.
3. It is unimodal.
4. It is symmetrical about the mean.
5. It is continuous.
6. The curve never touches the x-axis.
7. The total area under the normal distribution curve is
equal to 1 or 100%.Facilitator: John Paul L. Hablado 11
AREAS UNDER THE NORMAL CURVE
Facilitator: John Paul L. Hablado 12
EXAMPLES
Facilitator: John Paul L. Hablado 13
GUIDELINES IN
INTERPRETING TEST RESULTS
1. Test results should be interpreted in
terms of the test items from which they
were obtained.
2. It should be interpreted in relation to
other information about the background or
characteristics of the students.
14Facilitator: John Paul L. Hablado
GUIDELINES IN
INTERPRETING TEST RESULTS
3. It should be interpreted in terms of our
purposes or the decision we are about to
make.
4. Test results are not exact measures;
allowance for errors should be made.
15Facilitator: John Paul L. Hablado
GUIDELINES IN
INTERPRETING TEST RESULTS
5. Test results should be supported by
other evidence or information.
16
Ponder
these
guidelines!
Facilitator: John Paul L. Hablado
TO BE CONTINUED…
“ Think big. Think fast. Ideas
are no one’s monopoly.”
Thank you for listening,
and God bless everyone!
17Facilitator: John Paul L. Hablado

Interpreting test results

  • 1.
  • 2.
    Outline 1. Two Methodsof Interpreting Test Scores 2. Standard Score Norms 3. Areas under the Normal Curve 4. Guidelines in Interpreting Test Results 2Facilitator: John Paul L. Hablado
  • 3.
    Two Methods ofInterpreting Test Scores 3 Norm- referenced (based on norm) Criterion- referenced Facilitator: John Paul L. Hablado
  • 4.
    Standard Score Norms 4 T-Scores Z-Scores StandardScore Norms Indicates student’s relative position by showing how far his raw score is above or below average Facilitator: John Paul L. Hablado
  • 5.
    PROBLEM John scored 145on an IQ test with a mean of 100 and a standard deviation of 15. What is his z-score ?T-score? 5 Let us solve this problem. Can you help me? Facilitator: John Paul L. Hablado
  • 6.
    Facilitator: John PaulL. Hablado 6 SOLUTION It is easy, isn’t it?Let’s do it!
  • 7.
    Interpretation 7 John’s z-score is+3. Z –scores measure the distance of a score from the mean in units of standard deviation. Since the mean is 100 and the standard deviation is 15, John’s score is 3 standard deviations above the mean. T –score = 50+ 10 z = 50+10 (3) = 80 Since T-scores always have a mean of 50 and a standard deviation of 10. A T-score 80 indicates 3 sd above the mean. Facilitator: John Paul L. Hablado
  • 8.
    PROBLEM Study this groupof tests which was administered with the following results, then answer the questions. Facilitator: John Paul L. Hablado 8
  • 9.
    Facilitator: John PaulL. Hablado 9 USE THESE FORMULAS.
  • 10.
    Facilitator: John PaulL. Hablado 10 QUESTIONS
  • 11.
    Properties of theNormal Distribution 1. It is bell-shaped. 2. The mean, median and mode are equal and located at the center of the distribution. 3. It is unimodal. 4. It is symmetrical about the mean. 5. It is continuous. 6. The curve never touches the x-axis. 7. The total area under the normal distribution curve is equal to 1 or 100%.Facilitator: John Paul L. Hablado 11 AREAS UNDER THE NORMAL CURVE
  • 12.
    Facilitator: John PaulL. Hablado 12 EXAMPLES
  • 13.
  • 14.
    GUIDELINES IN INTERPRETING TESTRESULTS 1. Test results should be interpreted in terms of the test items from which they were obtained. 2. It should be interpreted in relation to other information about the background or characteristics of the students. 14Facilitator: John Paul L. Hablado
  • 15.
    GUIDELINES IN INTERPRETING TESTRESULTS 3. It should be interpreted in terms of our purposes or the decision we are about to make. 4. Test results are not exact measures; allowance for errors should be made. 15Facilitator: John Paul L. Hablado
  • 16.
    GUIDELINES IN INTERPRETING TESTRESULTS 5. Test results should be supported by other evidence or information. 16 Ponder these guidelines! Facilitator: John Paul L. Hablado
  • 17.
    TO BE CONTINUED… “Think big. Think fast. Ideas are no one’s monopoly.” Thank you for listening, and God bless everyone! 17Facilitator: John Paul L. Hablado