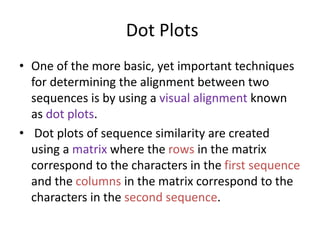
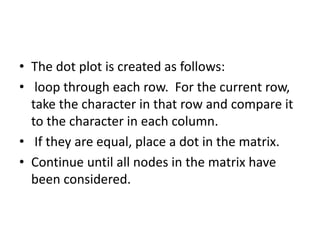
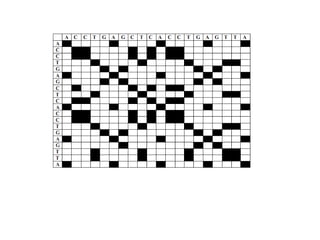
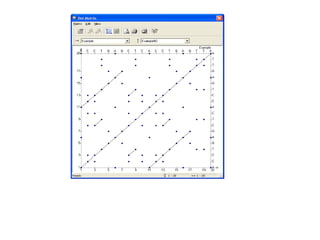
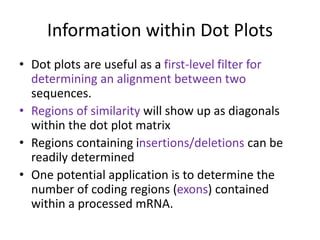
This document discusses dot plots, which are a visual technique for determining sequence alignment and similarity. Dot plots create a matrix where dots are placed at positions where characters match between two sequences being compared. This allows regions of similarity to be identified as diagonals within the matrix. Dot plots can reveal homologs, repeats, insertions/deletions, and be used to compare genes to mRNA sequences. They provide a first-level analysis of sequence alignment before more detailed scoring methods are applied.


![Polymer [ बहुलक ] Chemistry Notes PDF - Irfanullah Mehar - JJ Sir Chemistry.pdf](https://cdn.slidesharecdn.com/ss_thumbnails/polymerchemistrynotespdf-irfanullahmehar-jjsirchemistry-260210172118-3f9b37f7-thumbnail.jpg?width=640&height=640&fit=bounds)
