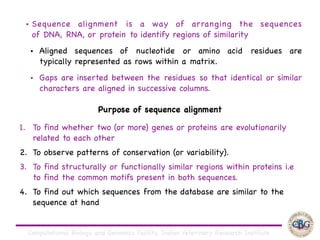
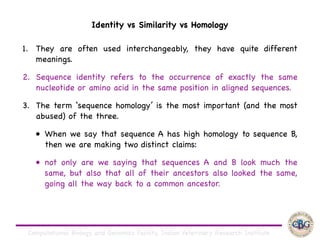
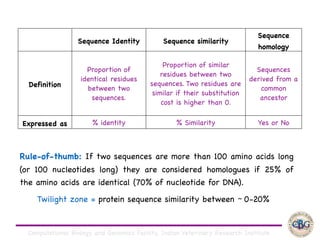
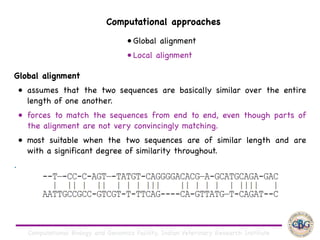
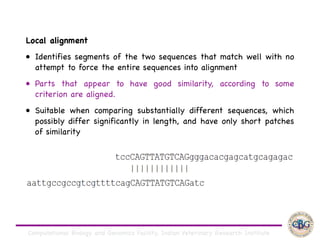
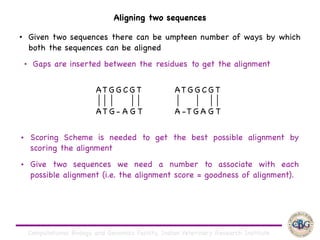
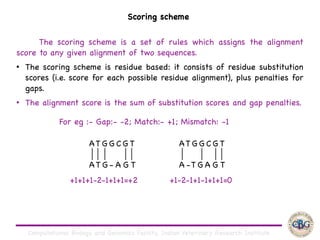
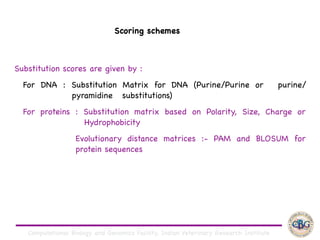
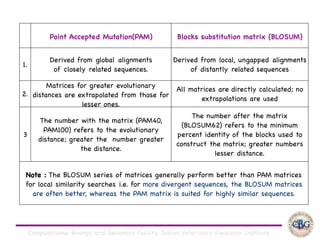
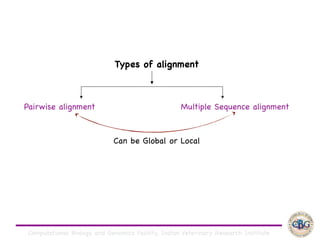
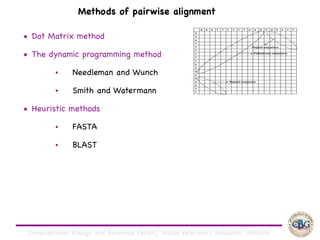
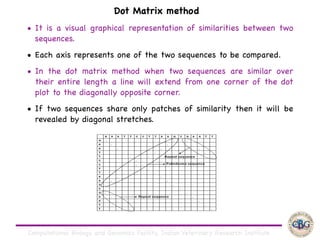
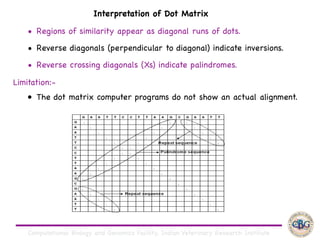
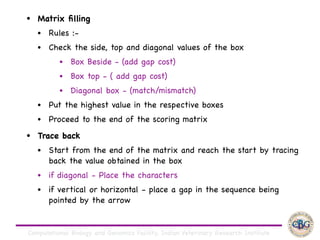
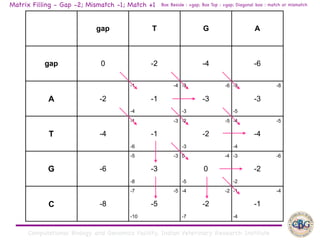
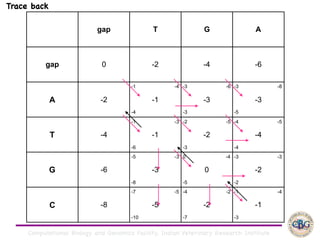
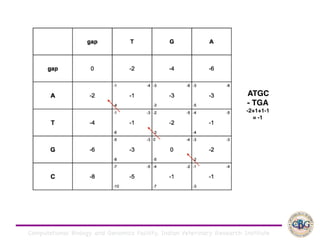
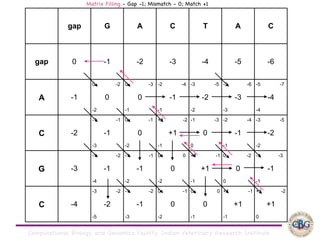
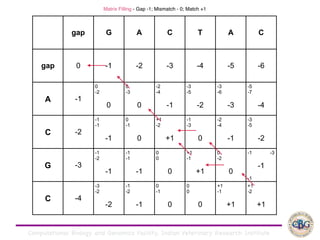
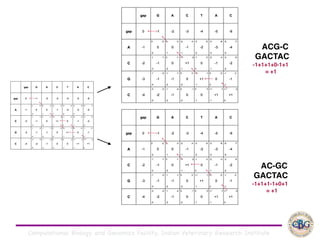
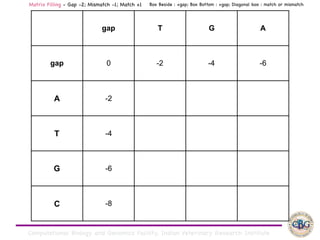
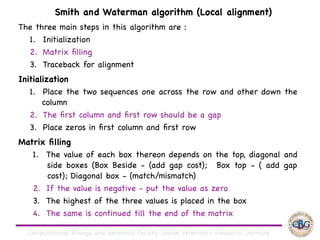
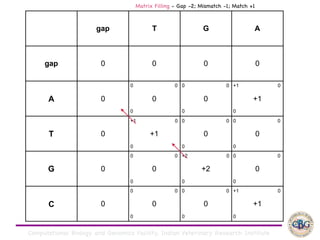
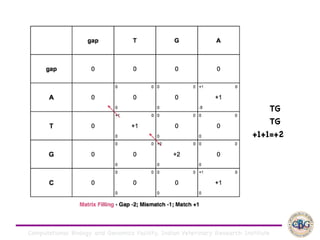
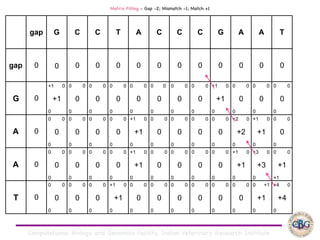
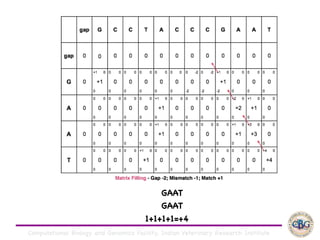
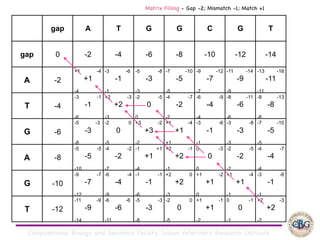
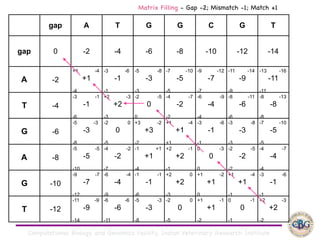
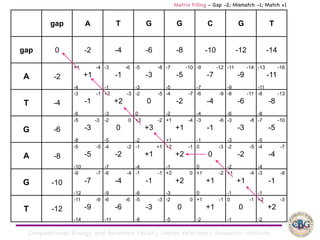
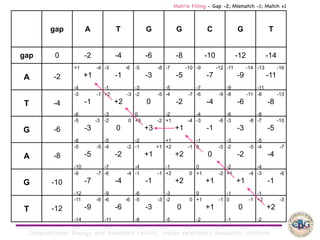
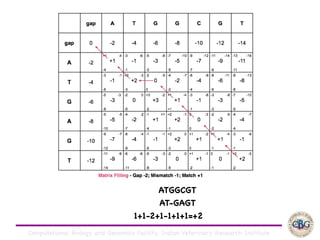
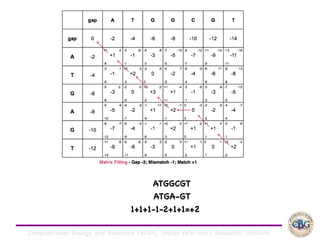
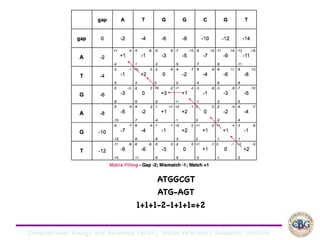
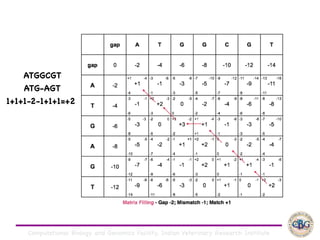
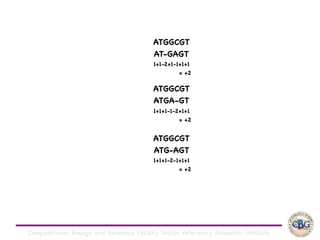
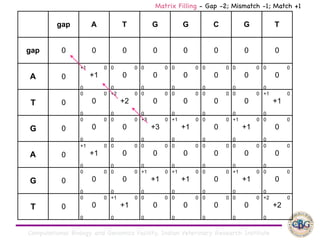
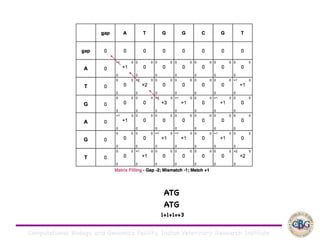
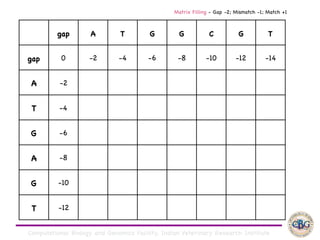
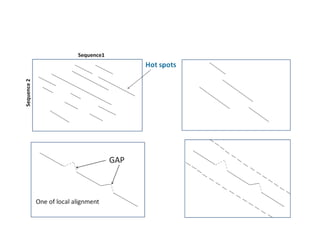
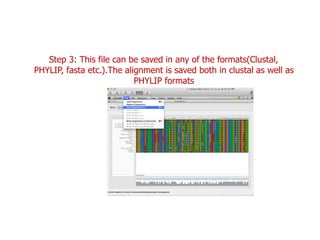
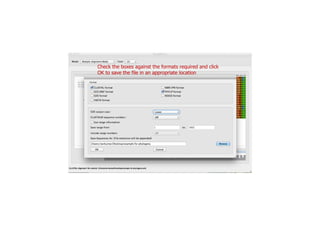
Computational Biology and Genomics Facility, Indian Veterinary Research Institute
Sequence alignment
Computational Biology and Genomics Facility, Indian Veterinary Research Institute
▪ Sequence alignment  is a way of arranging the sequences
of DNA, RNA, or protein to identify regions of similarity 

▪ Aligned sequences of  nucleotide  or amino acid  residues are
typically represented as rows within a matrix. 

▪ Gaps are inserted between the residues so that identical or similar
characters are aligned in successive columns.
1. To find whether two (or more) genes or proteins are evolutionarily
related to each other

2. To observe patterns of conservation (or variability).

3. To find structurally or functionally similar regions within proteins i.e
to find the common motifs present in both sequences.

4. To find out which sequences from the database are similar to the
sequence at hand
Purpose of sequence alignment
Computational Biology and Genomics Facility, Indian Veterinary Research Institute
1. They are often used interchangeably, they have quite different
meanings. 

2. Sequence identity refers to the occurrence of exactly the same
nucleotide or amino acid in the same position in aligned sequences. 

3. The term ‘sequence homology’ is the most important (and the most
abused) of the three. 

• When we say that sequence A has high homology to sequence B,
then we are making two distinct claims: 

• not only are we saying that sequences A and B look much the
same, but also that all of their ancestors also looked the same,
going all the way back to a common ancestor.
Identity vs Similarity vs Homology
Computational Biology and Genomics Facility, Indian Veterinary Research Institute
Sequence Identity Sequence similarity
Sequence
homology
Definition
Proportion of
identical residues
between two
sequences.
Proportion of similar
residues between two
sequences. Two residues are
similar if their substitution
cost is higher than 0.
Sequences
derived from a
common
ancestor
Expressed as % identity % Similarity Yes or No
Rule-of-thumb: If two sequences are more than 100 amino acids long
(or 100 nucleotides long) they are considered homologues if 25% of
the amino acids are identical (70% of nucleotide for DNA).
Twilight zone = protein sequence similarity between ~ 0-20%
Computational Biology and Genomics Facility, Indian Veterinary Research Institute
Global alignment 

• assumes that the two sequences are basically similar over the entire
length of one another. 

• forces to match the sequences from end to end, even though parts of
the alignment are not very convincingly matching. 

• most suitable when the two sequences are of similar length and are
with a significant degree of similarity throughout.

.
Computational approaches
• Global alignment

• Local alignment
Computational Biology and Genomics Facility, Indian Veterinary Research Institute
Local alignment

• Identifies segments of the two sequences that match well with no
attempt to force the entire sequences into alignment

• Parts that appear to have good similarity, according to some
criterion are aligned. 

• Suitable when comparing substantially different sequences, which
possibly differ significantly in length, and have only short patches
of similarity
Computational Biology and Genomics Facility, Indian Veterinary Research Institute
• Given two sequences there can be umpteen number of ways by which
both the sequences can be aligned

▪ Gaps are inserted between the residues to get the alignment
AT G G C G T 

A T G - A G T
AT G G C G T 

A -T G A G T
Aligning two sequences
• Scoring Scheme is needed to get the best possible alignment by
scoring the alignment

• Give two sequences we need a number to associate with each
possible alignment (i.e. the alignment score = goodness of alignment).
Computational Biology and Genomics Facility, Indian Veterinary Research Institute
The scoring scheme is a set of rules which assigns the alignment
score to any given alignment of two sequences.

• The scoring scheme is residue based: it consists of residue substitution
scores (i.e. score for each possible residue alignment), plus penalties for
gaps.

• The alignment score is the sum of substitution scores and gap penalties.
AT G G C G T 

A T G - A G T
AT G G C G T 

A -T G A G T
For eg :- Gap:- -2; Match:- +1; Mismatch: -1
+1+1+1-2-1+1+1=+2 +1-2-1+1-1+1+1=0
Scoring scheme
Computational Biology and Genomics Facility, Indian Veterinary Research Institute
Substitution scores are given by :

For DNA : Substitution Matrix for DNA (Purine/Purine or purine/
pyramidine substitutions)

For proteins : Substitution matrix based on Polarity, Size, Charge or
Hydrophobicity

Evolutionary distance matrices :- PAM and BLOSUM for
protein sequences
Scoring schemes
Computational Biology and Genomics Facility, Indian Veterinary Research Institute
Point Accepted Mutation(PAM) Blocks substitution matrix (BLOSUM)
1.
Derived from global alignments
of closely related sequences.
Derived from local, ungapped alignments
of distantly related sequences
2.
Matrices for greater evolutionary
distances are extrapolated from those for
lesser ones.
All matrices are directly calculated; no
extrapolations are used
3
The number with the matrix (PAM40,
PAM100) refers to the evolutionary
distance; greater the number greater
the distance.
The number after the matrix
(BLOSUM62) refers to the minimum
percent identity of the blocks used to
construct the matrix; greater numbers
lesser distance.
Note : The BLOSUM series of matrices generally perform better than PAM matrices
for local similarity searches i.e. for more divergent sequences, the BLOSUM matrices
are often better, whereas the PAM matrix is suited for highly similar sequences.
Computational Biology and Genomics Facility, Indian Veterinary Research Institute
Types of alignment
Pairwise alignment Multiple Sequence alignment
Can be Global or Local
Computational Biology and Genomics Facility, Indian Veterinary Research Institute
Methods of pairwise alignment
• Dot Matrix method

• The dynamic programming method

• Needleman and Wunch 

• Smith and Watermann 

• Heuristic methods

• FASTA 

• BLAST
Computational Biology and Genomics Facility, Indian Veterinary Research Institute
• It is a visual graphical representation of similarities between two
sequences. 

• Each axis represents one of the two sequences to be compared.

• In the dot matrix method when two sequences are similar over
their entire length a line will extend from one corner of the dot
plot to the diagonally opposite corner.

• If two sequences share only patches of similarity then it will be
revealed by diagonal stretches.
Dot Matrix method
Computational Biology and Genomics Facility, Indian Veterinary Research Institute
Interpretation of Dot Matrix
• Regions of similarity appear as diagonal runs of dots.

• Reverse diagonals (perpendicular to diagonal) indicate inversions.

• Reverse crossing diagonals (Xs) indicate palindromes.
Limitation:-
• The dot matrix computer programs do not show an actual alignment.
Computational Biology and Genomics Facility, Indian Veterinary Research Institute
The dynamic programming
• Dynamic programming reduces the massive number of possibilities that
need to be considered in aligning sequences.

• This method was first used for global alignment of sequences by
Needleman-Wunch algorithm (1970) and for local alignment by Smith -
Waterman algorithm (1981).

• Both the algorithms involve initialization, matrix filling (scoring) and
trace back steps. The algorithms use either PAM or BLOSUM matrices
in the scoring step to fill the score matrix.
Computational Biology and Genomics Facility, Indian Veterinary Research Institute
Global alignment
Computational Biology and Genomics Facility, Indian Veterinary Research Institute
The three main steps in this algorithm are :

1. Initialization

2. Matrix filling

3. Traceback for alignment
Initialization

1. Place the two sequences one across the row and other down the
column 

2. The first column and first row should be a gap

3. Add the cumulative gap cost across the row and other down the
column to fill the first column and first row
Global alignment (Needleman and Wunch)
Computational Biology and Genomics Facility, Indian Veterinary Research Institute
• Matrix filling

• Rules :-

• Check the side, top and diagonal values of the box

• Box Beside - (add gap cost)

• Box top - ( add gap cost)

• Diagonal box - (match/mismatch)

• Put the highest value in the respective boxes

• Proceed to the end of the scoring matrix

• Trace back

• Start from the end of the matrix and reach the start by tracing
back the value obtained in the box

• if diagonal - Place the characters

• if vertical or horizontal - place a gap in the sequence being
pointed by the arrow
Computational Biology and Genomics Facility, Indian Veterinary Research Institute
gap T G A
gap 0 -2 -4 -6
A -2
-1 -4
-1
-4
-3 -6
-3
-3
-3 -8
-3
-5
T -4
-1 -3
-1
-6
-2 -5
-2
-3
-4 -5
-4
-4
G -6
-5 -3
-3
-8
0 -4
0
-5
-3 -6
-2
-2
C -8
-7 -5
-5
-10
-4 -2
-2
-7
-1 -4
-1
-4
Matrix Filling - Gap -2; Mismatch -1; Match +1 Box Beside : +gap; Box Top : +gap; Diagonal box : match or mismatch
Computational Biology and Genomics Facility, Indian Veterinary Research Institute
gap T G A
gap 0 -2 -4 -6
A -2
-1 -4
-1
-4
-3 -6
-3
-3
-3 -8
-3
-5
T -4
-1 -3
-1
-6
-2 -5
-2
-3
-4 -5
-4
-4
G -6
-5 -3
-3
-8
0 -4
0
-5
-3 -3
-2
-2
C -8
-7 -5
-5
-10
-4 -2
-2
-7
-1 -4
-1
-3
Trace back
Computational Biology and Genomics Facility, Indian Veterinary Research Institute
ATGC
- TGA
-2+1+1-1
= -1
Computational Biology and Genomics Facility, Indian Veterinary Research Institute
gap G A C T A C
gap 0 -1 -2 -3 -4 -5 -6
A -1
0 -2
0
-2
0 -3
0
-1
-2 -4
-1
-1
-3 -5
-2
-2
-3 -6
-3
-3
-5 -7
-4
-4
C -2
-1 -1
-1
-3
0 -1
0
-2
+1 -2
+1
-1
-1 -3
0
0
-2 -4
-1
-1
-3 -5
-2
-2
G -3
-1 -2
-1
-4
-1 -1
-1
-2
0 0
0
-2
+1 -1
+1
-1
0 -2
0
0
-1 -3
-1
-1
C -4
-3 -2
-2
-5
-1 -2
-1
-3
0 -1
0
-2
0 0
0
-1
+1 -1
+1
-1
+1 -2
+1
0
Matrix Filling - Gap -1; Mismatch - 0; Match +1
Computational Biology and Genomics Facility, Indian Veterinary Research Institute
Matrix Filling - Gap -1; Mismatch - 0; Match +1
gap G A C T A C
gap 0 -1 -2 -3 -4 -5 -6
A -1
0
-2
0
-2
0
-3
0
-1
-2
-4
-1
-1
-3
-5
-2
-2
-3
-6
-3
-3
-5
-7
-4
-4
C -2
-1
-1
-1
-3
0
-1
0
-2
+1
-2
+1
-1
-1
-3
0
0
-2
-4
-1
-1
-3
-5
-2
-2
G -3
-1
-2
-1
-4
-1
-1
-1
-2
0
0
0
-2
+1
-1
+1
-1
0
-2
0
0
-1 -3
-1
-1
C -4
-3
-2
-2
-5
-1
-2
-1
-3
0
-1
0
-2
0
0
0
-1
+1
-1
+1
-1
+1
-2
+1
0
Computational Biology and Genomics Facility, Indian Veterinary Research Institute
ACG-C
GACTAC
-1+1+1+0-1+1
= +1
AC-GC
GACTAC
-1+1+1-1+0+1
= +1
Computational Biology and Genomics Facility, Indian Veterinary Research Institute
gap T G A
gap 0 -2 -4 -6
A -2
T -4
G -6
C -8
Matrix Filling - Gap -2; Mismatch -1; Match +1 Box Beside : +gap; Box Bottom : +gap; Diagonal box : match or mismatch
Computational Biology and Genomics Facility, Indian Veterinary Research Institute
gap G A C T A C
gap 0
A -2
C -4
G -6
C -8
Matrix Filling - Gap -2; Mismatch - -1; Match +1
Computational Biology and Genomics Facility, Indian Veterinary Research Institute
gap G A C T A C
gap
A
C
G
C
Matrix Filling - Gap -1; Mismatch - 0; Match +1
Computational Biology and Genomics Facility, Indian Veterinary Research Institute
gap T G A
gap
A
T
G
C
Matrix Filling - Gap -2; Mismatch -1; Match +1 Box Beside : +gap; Box Bottom : +gap; Diagonal box : match or mismatch
Computational Biology and Genomics Facility, Indian Veterinary Research Institute
The three main steps in this algorithm are :

1. Initialization

2. Matrix filling

3. Traceback for alignment

Initialization

1. Place the two sequences one across the row and other down the
column 

2. The first column and first row should be a gap

3. Place zeros in first column and first row

Matrix filling

1. The value of each box thereon depends on the top, diagonal and
side boxes (Box Beside - (add gap cost); Box top - ( add gap
cost); Diagonal box - (match/mismatch)

2. If the value is negative - put the value as zero

3. The highest of the three values is placed in the box

4. The same is continued till the end of the matrix
Smith and Waterman algorithm (Local alignment)
Computational Biology and Genomics Facility, Indian Veterinary Research Institute
gap T G A
gap 0 0 0 0
A 0
0 0
0
0
0 0
0
0
+1 0
+1
0
T 0
+1 0
+1
0
0 0
0
0
0 0
0
0
G 0
0 0
0
0
+2 0
+2
0
0 0
0
0
C 0
0 0
0
0
0 0
0
0
+1 0
+1
0
Matrix Filling - Gap -2; Mismatch -1; Match +1
Computational Biology and Genomics Facility, Indian Veterinary Research Institute
TG

TG

+1+1=+2
Computational Biology and Genomics Facility, Indian Veterinary Research Institute
gap G C C T A C C C G A A T
gap 0 0 0 0 0 0 0 0 0 0 0 0 0
G 0
+1 0
+1
0
0 0
0
0
0 0
0
0
0 0
0
0
0 0
0
0
0 0
0
0
0 0
0
0
0 0
0
0
+1 0
+1
0
0 0
0
0
0 0
0
0
0 0
0
0
A 0
0 0
0
0
0 0
0
0
0 0
0
0
0 0
0
0
+1 0
+1
0
0 0
0
0
0 0
0
0
0 0
0
0
0 0
0
0
+2 0
+2
0
+1 0
+1
0
0 0
0
0
A 0
0 0
0
0
0 0
0
0
0 0
0
0
0 0
0
0
+1 0
+1
0
0 0
0
0
0 0
0
0
0 0
0
0
0 0
0
0
+1 0
+1
0
+3 0
+3
0
0 0
+1
+1
T 0
0 0
0
0
0 0
0
0
0 0
0
0
+1 0
+1
0
0 0
0
0
0 0
0
0
0 0
0
0
0 0
0
0
0 0
0
0
0 0
0
0
0 +1
+1
0
+4 0
+4
0
Matrix Filling - Gap -2; Mismatch -1; Match +1
Computational Biology and Genomics Facility, Indian Veterinary Research Institute
GAAT

GAAT

1+1+1+1=+4
Computational Biology and Genomics Facility, Indian Veterinary Research Institute
Global alignment - example
Computational Biology and Genomics Facility, Indian Veterinary Research Institute
gap A T G G C G T
gap 0 -2 -4 -6 -8 -10 -12 -14
A -2
+1 -4
+1
-4
-3 -6
-1
-1
-5 -8
-3
-3
-7 -10
-5
-5
-9 -12
-7
-7
-11 -14
-9
-9
-13 -16
-11
-11
T -4
-3 -1
-1
-6
+2 -3
+2
-3
-2 -5
0
0
-4 -7
-2
-2
-6 -9
-4
-4
-8 -11
-6
-6
-8 -13
-8
-8
G -6
-5 -3
-3
-8
-2 0
0
-5
+3 -2
+3
-2
+1 -4
+1
+1
-3 -6
-1
-1
-3 -8
-3
-3
-7 -10
-5
-5
A -8
-5 -5
-5
-10
-4 -2
-2
-7
-1 +1
+1
-4
+2 -1
+2
-1
0 -3
0
0
-2 -5
-2
-2
-4 -7
-4
-4
G -10
-9 -7
-7
-12
-6 -4
-4
-9
-1 -1
-1
-6
+2 0
+2
-3
+1 -2
+1
0
+1 -4
+1
-1
-3 -6
-1
-1
T -12
-11 -9
-9
-14
-6 -6
-6
-11
-5 -3
-3
-8
-2 0
0
-5
+1 -1
+1
-2
0 -1
0
-1
+2 -3
+2
-2
Matrix Filling - Gap -2; Mismatch -1; Match +1
Computational Biology and Genomics Facility, Indian Veterinary Research Institute
ATGGCGT

AT-GAGT

1+1-2+1-1+1+1=+2
Computational Biology and Genomics Facility, Indian Veterinary Research Institute
ATGGCGT

ATGA-GT

1+1+1-1-2+1+1=+2
Computational Biology and Genomics Facility, Indian Veterinary Research Institute
ATGGCGT

ATG-AGT

1+1+1-2-1+1+1=+2
Computational Biology and Genomics Facility, Indian Veterinary Research Institute
ATGGCGT

ATG-AGT

1+1+1-2-1+1+1=+2
Computational Biology and Genomics Facility, Indian Veterinary Research Institute
ATGGCGT

AT-GAGT

1+1-2+1-1+1+1

= +2
ATGGCGT

ATGA-GT

1+1+1-1-2+1+1

= +2
ATGGCGT

ATG-AGT

1+1+1-2-1+1+1

= +2
Computational Biology and Genomics Facility, Indian Veterinary Research Institute
Local alignment
Computational Biology and Genomics Facility, Indian Veterinary Research Institute
gap A T G G C G T
gap 0 0 0 0 0 0 0 0
A 0
+1 0
+1
0
0 0
0
0
0 0
0
0
0 0
0
0
0 0
0
0
0 0
0
0
0 0
0
0
T 0
0 0
0
0
+2 0
+2
0
0 0
0
0
0 0
0
0
0 0
0
0
0 0
0
0
+1 0
+1
0
G 0
0 0
0
0
0 0
0
0
+3 0
+3
0
+1 0
+1
0
0 0
0
0
+1 0
+1
0
0 0
0
0
A 0
+1 0
+1
0
0 0
0
0
0 0
0
0
0 0
0
0
0 0
0
0
0 0
0
0
0 0
0
0
G 0
0 0
0
0
0 0
0
0
+1 0
+1
0
+1 0
+1
0
0 0
0
0
+1 0
+1
0
0 0
0
0
T 0
0 0
0
0
+1 0
+1
0
0 0
0
0
0 0
0
0
0 0
0
0
0 0
0
0
+2 0
+2
0
Matrix Filling - Gap -2; Mismatch -1; Match +1
Computational Biology and Genomics Facility, Indian Veterinary Research Institute
ATG

ATG

1+1+1=+3
Computational Biology and Genomics Facility, Indian Veterinary Research Institute
gap A T G G C G T
gap 0 -2 -4 -6 -8 -10 -12 -14
A -2
T -4
G -6
A -8
G -10
T -12
Matrix Filling - Gap -2; Mismatch -1; Match +1
Computational Biology and Genomics Facility, Indian Veterinary Research Institute
Note :- Always take the value of gap cost or mismatch cost a negative
value and the values have to be different
Fast All (FASTA)
FASTA is the heuristic method first developed by Lipman and Pearson in
1985.
How the FASTA algorithm works?
•FASTA initially finds all hot-spots. Hot-spots are pairs of words of
length k (2 a.a. or 6 nt) that exactly match
•It then scores (substitution matrix) and identifies the 10 best diagonal
runs. A diagonal run is a sequence of nearby hot spots on the same
diagonal.
•All good diagonal runs from close diagonals are combined, to achieve
an alignment. All such alignments are scored to get the best scored
alignment.
The Basic Local Alignment Search Tool (BLAST)

▪ The BLAST algorithm was developed by Altschul et al. in 1990 and later
modified in 1997 by them.
▪ It finds regions of local similarity between sequences.
▪ The program compares nucleotide or protein sequences to sequence databases
and calculates the statistical significance of matches.
▪ The query is broken down into words (3 for a.a and 11 for nt). (the
maximum number of words can be calculated: L - w +1= max. word no.
(L=seq.length, w=word)).
▪ For each word from the query sequence find the list of words with high
score using a substitution matrix(PAM or BLOSUM)
▪ For each exact word match, alignment is extended in both directions to
find high score segments
1.Raw score: Scores based on either PAM or BLOSUM
2. Bit-score/Normalized score: To compare different alignments, based on
different scoring systems the score needs to be normalized, e.g.
different substitution matrices.
Important terms in BLAST:
E-Value (Expectation Value):
▪In the context of database searches, the E-value (associated to a score S)
is the number of distinct alignments, with a score equivalent to or better
than S, that are expected to occur in a database search by chance.
▪The lower the E value, the more significant the score is.
n = query sequence length;
m = the sum of the lengths of the sequences in the database.
P-value: Probability that an alignment with this score occurs by
chance in a database of size N. The closer the P-value is towards
0, the better the alignment
N * P
Interpretation of E-value :
1. E-value is the number of matches with this score one can expect to find
by chance in a database of size N. The closer the E-value is towards 0, the
better the alignment.
▪For nucleotide based searches, one should look for hits with E-values of
10-6 or less and sequence identity of 70% or more
▪For protein based searches, one should look for hits with E-values of 10-3
or less and sequence identity of 25% or more
Step 1: Go to the NCBI site (http://www.ncbi.nlm.nih.gov) click on Blast
or type the URL (http://blast.ncbi.nlm.nih.gov/ Blast.cgi)
Step 2: In the page shown below the following options are available :
BLAST
In this chapter we will deal with blastn and blastp
▪Step 3 : Clicking on blastn opens a window which provides space for
pasting our query sequence or for entering the accession number
Query length is 1662bp
The colour of the line gives
an idea about the total score
of the query with the hit
Step 4 : Click on blast to proceed and see the result (there is an option to
view the results in a new window by ticking on the check box at the
bottom of the page)
Max score and Total score are the same until
and unless the query matches with the
subject in complete segments
The total query(100%) of 1662 is
involved in the alignment match
The 99% of the total query length of
1662bp is involved in the alignment match
percent of the query length that is
included in the aligned segments
100% of the query (1-1662)
is involved in the alignment
out of which there is only
9 7 % i d e n t i t y i . e .
1604/1662=96.5%
Blastp : Step 1- step 2 are similar, in step 3 press blasp and paste your
sequence of interest and view the result. The only one extra
parameter in blastp result is the positives which is nothing but the
similarity Identities Plus the conservative
substitutions gives the similarity
(positives)
Total score vs Max score
Multiple Sequence Alignment
▪ It is an extension of pairwise alignment to incorporate more than
two sequences at a time.
▪ Multiple alignment methods try to align all of the sequences in a
given query set.
▪ Alignments are also used to aid in establishing evolutionary
relationships by constructing phylogenetic trees.
▪ Multiple sequence alignment methods can be performed by
following methods :
1.Dynamic programming method : Very slow and out of vogue
2.Progressive methods : Clustal W, Clustal X and T-coffee
Steps in Clustal W/Clustal X

▪ Determining all pairwise alignments between sequences and
degrees of similarity between each pair.
▪ Constructing a "rough" similarity tree
▪ Combining the alignments starting from the most closely related
groups to most distantly related groups.
3.Iterative methods : MUSCLE (multiple sequence alignment by log-
expectation),MAFFT (MAFFT is a multiple sequence alignment program
for unix-like operating systems).
These methods work similarly to progressive methods but repeatedly
realign the initial sequences as well as adding new sequences to the
growing MSA.
4.Hidden Markov model : PROBCONS (A practical tool for progressive
protein multiple sequence alignment based on probabilistic consistency),
5.Motif finding methods: MEME(Multiple Expectation Maximization for Motif
finding)
Multiple Sequence alignment by ClustalX
Step 1: Load Sequences into ClustalX by choosing a file by browsing
through the computer.
Step 2: Do complete Alignment by selecting from the alignment
menu
Alignment in progress
Alignment file created
Step 3: This file can be saved in any of the formats(Clustal,
PHYLIP, fasta etc.).The alignment is saved both in clustal as well as
PHYLIP formats
Check the boxes against the formats required and click
OK to save the file in an appropriate location

Sequence Alignment

  • 1.
    Computational Biology andGenomics Facility, Indian Veterinary Research Institute Sequence alignment
  • 2.
    Computational Biology andGenomics Facility, Indian Veterinary Research Institute ▪ Sequence alignment  is a way of arranging the sequences of DNA, RNA, or protein to identify regions of similarity ▪ Aligned sequences of  nucleotide  or amino acid  residues are typically represented as rows within a matrix. ▪ Gaps are inserted between the residues so that identical or similar characters are aligned in successive columns. 1. To find whether two (or more) genes or proteins are evolutionarily related to each other 2. To observe patterns of conservation (or variability). 3. To find structurally or functionally similar regions within proteins i.e to find the common motifs present in both sequences. 4. To find out which sequences from the database are similar to the sequence at hand Purpose of sequence alignment
  • 3.
    Computational Biology andGenomics Facility, Indian Veterinary Research Institute 1. They are often used interchangeably, they have quite different meanings. 2. Sequence identity refers to the occurrence of exactly the same nucleotide or amino acid in the same position in aligned sequences. 3. The term ‘sequence homology’ is the most important (and the most abused) of the three. • When we say that sequence A has high homology to sequence B, then we are making two distinct claims: • not only are we saying that sequences A and B look much the same, but also that all of their ancestors also looked the same, going all the way back to a common ancestor. Identity vs Similarity vs Homology
  • 4.
    Computational Biology andGenomics Facility, Indian Veterinary Research Institute Sequence Identity Sequence similarity Sequence homology Definition Proportion of identical residues between two sequences. Proportion of similar residues between two sequences. Two residues are similar if their substitution cost is higher than 0. Sequences derived from a common ancestor Expressed as % identity % Similarity Yes or No Rule-of-thumb: If two sequences are more than 100 amino acids long (or 100 nucleotides long) they are considered homologues if 25% of the amino acids are identical (70% of nucleotide for DNA). Twilight zone = protein sequence similarity between ~ 0-20%
  • 5.
    Computational Biology andGenomics Facility, Indian Veterinary Research Institute Global alignment • assumes that the two sequences are basically similar over the entire length of one another. • forces to match the sequences from end to end, even though parts of the alignment are not very convincingly matching. • most suitable when the two sequences are of similar length and are with a significant degree of similarity throughout. . Computational approaches • Global alignment • Local alignment
  • 6.
    Computational Biology andGenomics Facility, Indian Veterinary Research Institute Local alignment • Identifies segments of the two sequences that match well with no attempt to force the entire sequences into alignment • Parts that appear to have good similarity, according to some criterion are aligned. • Suitable when comparing substantially different sequences, which possibly differ significantly in length, and have only short patches of similarity
  • 7.
    Computational Biology andGenomics Facility, Indian Veterinary Research Institute • Given two sequences there can be umpteen number of ways by which both the sequences can be aligned ▪ Gaps are inserted between the residues to get the alignment AT G G C G T A T G - A G T AT G G C G T A -T G A G T Aligning two sequences • Scoring Scheme is needed to get the best possible alignment by scoring the alignment • Give two sequences we need a number to associate with each possible alignment (i.e. the alignment score = goodness of alignment).
  • 8.
    Computational Biology andGenomics Facility, Indian Veterinary Research Institute The scoring scheme is a set of rules which assigns the alignment score to any given alignment of two sequences. • The scoring scheme is residue based: it consists of residue substitution scores (i.e. score for each possible residue alignment), plus penalties for gaps. • The alignment score is the sum of substitution scores and gap penalties. AT G G C G T A T G - A G T AT G G C G T A -T G A G T For eg :- Gap:- -2; Match:- +1; Mismatch: -1 +1+1+1-2-1+1+1=+2 +1-2-1+1-1+1+1=0 Scoring scheme
  • 9.
    Computational Biology andGenomics Facility, Indian Veterinary Research Institute Substitution scores are given by : For DNA : Substitution Matrix for DNA (Purine/Purine or purine/ pyramidine substitutions) For proteins : Substitution matrix based on Polarity, Size, Charge or Hydrophobicity Evolutionary distance matrices :- PAM and BLOSUM for protein sequences Scoring schemes
  • 10.
    Computational Biology andGenomics Facility, Indian Veterinary Research Institute Point Accepted Mutation(PAM) Blocks substitution matrix (BLOSUM) 1. Derived from global alignments of closely related sequences. Derived from local, ungapped alignments of distantly related sequences 2. Matrices for greater evolutionary distances are extrapolated from those for lesser ones. All matrices are directly calculated; no extrapolations are used 3 The number with the matrix (PAM40, PAM100) refers to the evolutionary distance; greater the number greater the distance. The number after the matrix (BLOSUM62) refers to the minimum percent identity of the blocks used to construct the matrix; greater numbers lesser distance. Note : The BLOSUM series of matrices generally perform better than PAM matrices for local similarity searches i.e. for more divergent sequences, the BLOSUM matrices are often better, whereas the PAM matrix is suited for highly similar sequences.
  • 11.
    Computational Biology andGenomics Facility, Indian Veterinary Research Institute Types of alignment Pairwise alignment Multiple Sequence alignment Can be Global or Local
  • 12.
    Computational Biology andGenomics Facility, Indian Veterinary Research Institute Methods of pairwise alignment • Dot Matrix method • The dynamic programming method • Needleman and Wunch • Smith and Watermann • Heuristic methods • FASTA • BLAST
  • 13.
    Computational Biology andGenomics Facility, Indian Veterinary Research Institute • It is a visual graphical representation of similarities between two sequences. • Each axis represents one of the two sequences to be compared. • In the dot matrix method when two sequences are similar over their entire length a line will extend from one corner of the dot plot to the diagonally opposite corner. • If two sequences share only patches of similarity then it will be revealed by diagonal stretches. Dot Matrix method
  • 14.
    Computational Biology andGenomics Facility, Indian Veterinary Research Institute Interpretation of Dot Matrix • Regions of similarity appear as diagonal runs of dots. • Reverse diagonals (perpendicular to diagonal) indicate inversions. • Reverse crossing diagonals (Xs) indicate palindromes. Limitation:- • The dot matrix computer programs do not show an actual alignment.
  • 15.
    Computational Biology andGenomics Facility, Indian Veterinary Research Institute The dynamic programming • Dynamic programming reduces the massive number of possibilities that need to be considered in aligning sequences. • This method was first used for global alignment of sequences by Needleman-Wunch algorithm (1970) and for local alignment by Smith - Waterman algorithm (1981). • Both the algorithms involve initialization, matrix filling (scoring) and trace back steps. The algorithms use either PAM or BLOSUM matrices in the scoring step to fill the score matrix.
  • 16.
    Computational Biology andGenomics Facility, Indian Veterinary Research Institute Global alignment
  • 17.
    Computational Biology andGenomics Facility, Indian Veterinary Research Institute The three main steps in this algorithm are : 1. Initialization 2. Matrix filling 3. Traceback for alignment Initialization 1. Place the two sequences one across the row and other down the column 2. The first column and first row should be a gap 3. Add the cumulative gap cost across the row and other down the column to fill the first column and first row Global alignment (Needleman and Wunch)
  • 18.
    Computational Biology andGenomics Facility, Indian Veterinary Research Institute • Matrix filling • Rules :- • Check the side, top and diagonal values of the box • Box Beside - (add gap cost) • Box top - ( add gap cost) • Diagonal box - (match/mismatch) • Put the highest value in the respective boxes • Proceed to the end of the scoring matrix • Trace back • Start from the end of the matrix and reach the start by tracing back the value obtained in the box • if diagonal - Place the characters • if vertical or horizontal - place a gap in the sequence being pointed by the arrow
  • 19.
    Computational Biology andGenomics Facility, Indian Veterinary Research Institute gap T G A gap 0 -2 -4 -6 A -2 -1 -4 -1 -4 -3 -6 -3 -3 -3 -8 -3 -5 T -4 -1 -3 -1 -6 -2 -5 -2 -3 -4 -5 -4 -4 G -6 -5 -3 -3 -8 0 -4 0 -5 -3 -6 -2 -2 C -8 -7 -5 -5 -10 -4 -2 -2 -7 -1 -4 -1 -4 Matrix Filling - Gap -2; Mismatch -1; Match +1 Box Beside : +gap; Box Top : +gap; Diagonal box : match or mismatch
  • 20.
    Computational Biology andGenomics Facility, Indian Veterinary Research Institute gap T G A gap 0 -2 -4 -6 A -2 -1 -4 -1 -4 -3 -6 -3 -3 -3 -8 -3 -5 T -4 -1 -3 -1 -6 -2 -5 -2 -3 -4 -5 -4 -4 G -6 -5 -3 -3 -8 0 -4 0 -5 -3 -3 -2 -2 C -8 -7 -5 -5 -10 -4 -2 -2 -7 -1 -4 -1 -3 Trace back
  • 21.
    Computational Biology andGenomics Facility, Indian Veterinary Research Institute ATGC - TGA -2+1+1-1 = -1
  • 22.
    Computational Biology andGenomics Facility, Indian Veterinary Research Institute gap G A C T A C gap 0 -1 -2 -3 -4 -5 -6 A -1 0 -2 0 -2 0 -3 0 -1 -2 -4 -1 -1 -3 -5 -2 -2 -3 -6 -3 -3 -5 -7 -4 -4 C -2 -1 -1 -1 -3 0 -1 0 -2 +1 -2 +1 -1 -1 -3 0 0 -2 -4 -1 -1 -3 -5 -2 -2 G -3 -1 -2 -1 -4 -1 -1 -1 -2 0 0 0 -2 +1 -1 +1 -1 0 -2 0 0 -1 -3 -1 -1 C -4 -3 -2 -2 -5 -1 -2 -1 -3 0 -1 0 -2 0 0 0 -1 +1 -1 +1 -1 +1 -2 +1 0 Matrix Filling - Gap -1; Mismatch - 0; Match +1
  • 23.
    Computational Biology andGenomics Facility, Indian Veterinary Research Institute Matrix Filling - Gap -1; Mismatch - 0; Match +1 gap G A C T A C gap 0 -1 -2 -3 -4 -5 -6 A -1 0 -2 0 -2 0 -3 0 -1 -2 -4 -1 -1 -3 -5 -2 -2 -3 -6 -3 -3 -5 -7 -4 -4 C -2 -1 -1 -1 -3 0 -1 0 -2 +1 -2 +1 -1 -1 -3 0 0 -2 -4 -1 -1 -3 -5 -2 -2 G -3 -1 -2 -1 -4 -1 -1 -1 -2 0 0 0 -2 +1 -1 +1 -1 0 -2 0 0 -1 -3 -1 -1 C -4 -3 -2 -2 -5 -1 -2 -1 -3 0 -1 0 -2 0 0 0 -1 +1 -1 +1 -1 +1 -2 +1 0
  • 24.
    Computational Biology andGenomics Facility, Indian Veterinary Research Institute ACG-C GACTAC -1+1+1+0-1+1 = +1 AC-GC GACTAC -1+1+1-1+0+1 = +1
  • 25.
    Computational Biology andGenomics Facility, Indian Veterinary Research Institute gap T G A gap 0 -2 -4 -6 A -2 T -4 G -6 C -8 Matrix Filling - Gap -2; Mismatch -1; Match +1 Box Beside : +gap; Box Bottom : +gap; Diagonal box : match or mismatch
  • 26.
    Computational Biology andGenomics Facility, Indian Veterinary Research Institute gap G A C T A C gap 0 A -2 C -4 G -6 C -8 Matrix Filling - Gap -2; Mismatch - -1; Match +1
  • 27.
    Computational Biology andGenomics Facility, Indian Veterinary Research Institute gap G A C T A C gap A C G C Matrix Filling - Gap -1; Mismatch - 0; Match +1
  • 28.
    Computational Biology andGenomics Facility, Indian Veterinary Research Institute gap T G A gap A T G C Matrix Filling - Gap -2; Mismatch -1; Match +1 Box Beside : +gap; Box Bottom : +gap; Diagonal box : match or mismatch
  • 29.
    Computational Biology andGenomics Facility, Indian Veterinary Research Institute The three main steps in this algorithm are : 1. Initialization 2. Matrix filling 3. Traceback for alignment Initialization 1. Place the two sequences one across the row and other down the column 2. The first column and first row should be a gap 3. Place zeros in first column and first row Matrix filling 1. The value of each box thereon depends on the top, diagonal and side boxes (Box Beside - (add gap cost); Box top - ( add gap cost); Diagonal box - (match/mismatch) 2. If the value is negative - put the value as zero 3. The highest of the three values is placed in the box 4. The same is continued till the end of the matrix Smith and Waterman algorithm (Local alignment)
  • 30.
    Computational Biology andGenomics Facility, Indian Veterinary Research Institute gap T G A gap 0 0 0 0 A 0 0 0 0 0 0 0 0 0 +1 0 +1 0 T 0 +1 0 +1 0 0 0 0 0 0 0 0 0 G 0 0 0 0 0 +2 0 +2 0 0 0 0 0 C 0 0 0 0 0 0 0 0 0 +1 0 +1 0 Matrix Filling - Gap -2; Mismatch -1; Match +1
  • 31.
    Computational Biology andGenomics Facility, Indian Veterinary Research Institute TG TG +1+1=+2
  • 32.
    Computational Biology andGenomics Facility, Indian Veterinary Research Institute gap G C C T A C C C G A A T gap 0 0 0 0 0 0 0 0 0 0 0 0 0 G 0 +1 0 +1 0 0 0 0 0 0 0 0 0 0 0 0 0 0 0 0 0 0 0 0 0 0 0 0 0 0 0 0 0 +1 0 +1 0 0 0 0 0 0 0 0 0 0 0 0 0 A 0 0 0 0 0 0 0 0 0 0 0 0 0 0 0 0 0 +1 0 +1 0 0 0 0 0 0 0 0 0 0 0 0 0 0 0 0 0 +2 0 +2 0 +1 0 +1 0 0 0 0 0 A 0 0 0 0 0 0 0 0 0 0 0 0 0 0 0 0 0 +1 0 +1 0 0 0 0 0 0 0 0 0 0 0 0 0 0 0 0 0 +1 0 +1 0 +3 0 +3 0 0 0 +1 +1 T 0 0 0 0 0 0 0 0 0 0 0 0 0 +1 0 +1 0 0 0 0 0 0 0 0 0 0 0 0 0 0 0 0 0 0 0 0 0 0 0 0 0 0 +1 +1 0 +4 0 +4 0 Matrix Filling - Gap -2; Mismatch -1; Match +1
  • 33.
    Computational Biology andGenomics Facility, Indian Veterinary Research Institute GAAT GAAT 1+1+1+1=+4
  • 34.
    Computational Biology andGenomics Facility, Indian Veterinary Research Institute Global alignment - example
  • 35.
    Computational Biology andGenomics Facility, Indian Veterinary Research Institute gap A T G G C G T gap 0 -2 -4 -6 -8 -10 -12 -14 A -2 +1 -4 +1 -4 -3 -6 -1 -1 -5 -8 -3 -3 -7 -10 -5 -5 -9 -12 -7 -7 -11 -14 -9 -9 -13 -16 -11 -11 T -4 -3 -1 -1 -6 +2 -3 +2 -3 -2 -5 0 0 -4 -7 -2 -2 -6 -9 -4 -4 -8 -11 -6 -6 -8 -13 -8 -8 G -6 -5 -3 -3 -8 -2 0 0 -5 +3 -2 +3 -2 +1 -4 +1 +1 -3 -6 -1 -1 -3 -8 -3 -3 -7 -10 -5 -5 A -8 -5 -5 -5 -10 -4 -2 -2 -7 -1 +1 +1 -4 +2 -1 +2 -1 0 -3 0 0 -2 -5 -2 -2 -4 -7 -4 -4 G -10 -9 -7 -7 -12 -6 -4 -4 -9 -1 -1 -1 -6 +2 0 +2 -3 +1 -2 +1 0 +1 -4 +1 -1 -3 -6 -1 -1 T -12 -11 -9 -9 -14 -6 -6 -6 -11 -5 -3 -3 -8 -2 0 0 -5 +1 -1 +1 -2 0 -1 0 -1 +2 -3 +2 -2 Matrix Filling - Gap -2; Mismatch -1; Match +1
  • 36.
    Computational Biology andGenomics Facility, Indian Veterinary Research Institute gap A T G G C G T gap 0 -2 -4 -6 -8 -10 -12 -14 A -2 +1 -4 +1 -4 -3 -6 -1 -1 -5 -8 -3 -3 -7 -10 -5 -5 -9 -12 -7 -7 -11 -14 -9 -9 -13 -16 -11 -11 T -4 -3 -1 -1 -6 +2 -3 +2 -3 -2 -5 0 0 -4 -7 -2 -2 -6 -9 -4 -4 -8 -11 -6 -6 -8 -13 -8 -8 G -6 -5 -3 -3 -8 -2 0 0 -5 +3 -2 +3 -2 +1 -4 +1 +1 -3 -6 -1 -1 -3 -8 -3 -3 -7 -10 -5 -5 A -8 -5 -5 -5 -10 -4 -2 -2 -7 -1 +1 +1 -4 +2 -1 +2 -1 0 -3 0 0 -2 -5 -2 -2 -4 -7 -4 -4 G -10 -9 -7 -7 -12 -6 -4 -4 -9 -1 -1 -1 -6 +2 0 +2 -3 +1 -2 +1 0 +1 -4 +1 -1 -3 -6 -1 -1 T -12 -11 -9 -9 -14 -6 -6 -6 -11 -5 -3 -3 -8 -2 0 0 -5 +1 -1 +1 -2 0 -1 0 -1 +2 -3 +2 -2 Matrix Filling - Gap -2; Mismatch -1; Match +1
  • 37.
    Computational Biology andGenomics Facility, Indian Veterinary Research Institute gap A T G G C G T gap 0 -2 -4 -6 -8 -10 -12 -14 A -2 +1 -4 +1 -4 -3 -6 -1 -1 -5 -8 -3 -3 -7 -10 -5 -5 -9 -12 -7 -7 -11 -14 -9 -9 -13 -16 -11 -11 T -4 -3 -1 -1 -6 +2 -3 +2 -3 -2 -5 0 0 -4 -7 -2 -2 -6 -9 -4 -4 -8 -11 -6 -6 -8 -13 -8 -8 G -6 -5 -3 -3 -8 -2 0 0 -5 +3 -2 +3 -2 +1 -4 +1 +1 -3 -6 -1 -1 -3 -8 -3 -3 -7 -10 -5 -5 A -8 -5 -5 -5 -10 -4 -2 -2 -7 -1 +1 +1 -4 +2 -1 +2 -1 0 -3 0 0 -2 -5 -2 -2 -4 -7 -4 -4 G -10 -9 -7 -7 -12 -6 -4 -4 -9 -1 -1 -1 -6 +2 0 +2 -3 +1 -2 +1 0 +1 -4 +1 -1 -3 -6 -1 -1 T -12 -11 -9 -9 -14 -6 -6 -6 -11 -5 -3 -3 -8 -2 0 0 -5 +1 -1 +1 -2 0 -1 0 -1 +2 -3 +2 -2 Matrix Filling - Gap -2; Mismatch -1; Match +1
  • 38.
    Computational Biology andGenomics Facility, Indian Veterinary Research Institute gap A T G G C G T gap 0 -2 -4 -6 -8 -10 -12 -14 A -2 +1 -4 +1 -4 -3 -6 -1 -1 -5 -8 -3 -3 -7 -10 -5 -5 -9 -12 -7 -7 -11 -14 -9 -9 -13 -16 -11 -11 T -4 -3 -1 -1 -6 +2 -3 +2 -3 -2 -5 0 0 -4 -7 -2 -2 -6 -9 -4 -4 -8 -11 -6 -6 -8 -13 -8 -8 G -6 -5 -3 -3 -8 -2 0 0 -5 +3 -2 +3 -2 +1 -4 +1 +1 -3 -6 -1 -1 -3 -8 -3 -3 -7 -10 -5 -5 A -8 -5 -5 -5 -10 -4 -2 -2 -7 -1 +1 +1 -4 +2 -1 +2 -1 0 -3 0 0 -2 -5 -2 -2 -4 -7 -4 -4 G -10 -9 -7 -7 -12 -6 -4 -4 -9 -1 -1 -1 -6 +2 0 +2 -3 +1 -2 +1 0 +1 -4 +1 -1 -3 -6 -1 -1 T -12 -11 -9 -9 -14 -6 -6 -6 -11 -5 -3 -3 -8 -2 0 0 -5 +1 -1 +1 -2 0 -1 0 -1 +2 -3 +2 -2 Matrix Filling - Gap -2; Mismatch -1; Match +1
  • 39.
    Computational Biology andGenomics Facility, Indian Veterinary Research Institute ATGGCGT AT-GAGT 1+1-2+1-1+1+1=+2
  • 40.
    Computational Biology andGenomics Facility, Indian Veterinary Research Institute ATGGCGT ATGA-GT 1+1+1-1-2+1+1=+2
  • 41.
    Computational Biology andGenomics Facility, Indian Veterinary Research Institute ATGGCGT ATG-AGT 1+1+1-2-1+1+1=+2
  • 42.
    Computational Biology andGenomics Facility, Indian Veterinary Research Institute ATGGCGT ATG-AGT 1+1+1-2-1+1+1=+2
  • 43.
    Computational Biology andGenomics Facility, Indian Veterinary Research Institute ATGGCGT AT-GAGT 1+1-2+1-1+1+1 = +2 ATGGCGT ATGA-GT 1+1+1-1-2+1+1 = +2 ATGGCGT ATG-AGT 1+1+1-2-1+1+1 = +2
  • 44.
    Computational Biology andGenomics Facility, Indian Veterinary Research Institute Local alignment
  • 45.
    Computational Biology andGenomics Facility, Indian Veterinary Research Institute gap A T G G C G T gap 0 0 0 0 0 0 0 0 A 0 +1 0 +1 0 0 0 0 0 0 0 0 0 0 0 0 0 0 0 0 0 0 0 0 0 0 0 0 0 T 0 0 0 0 0 +2 0 +2 0 0 0 0 0 0 0 0 0 0 0 0 0 0 0 0 0 +1 0 +1 0 G 0 0 0 0 0 0 0 0 0 +3 0 +3 0 +1 0 +1 0 0 0 0 0 +1 0 +1 0 0 0 0 0 A 0 +1 0 +1 0 0 0 0 0 0 0 0 0 0 0 0 0 0 0 0 0 0 0 0 0 0 0 0 0 G 0 0 0 0 0 0 0 0 0 +1 0 +1 0 +1 0 +1 0 0 0 0 0 +1 0 +1 0 0 0 0 0 T 0 0 0 0 0 +1 0 +1 0 0 0 0 0 0 0 0 0 0 0 0 0 0 0 0 0 +2 0 +2 0 Matrix Filling - Gap -2; Mismatch -1; Match +1
  • 46.
    Computational Biology andGenomics Facility, Indian Veterinary Research Institute ATG ATG 1+1+1=+3
  • 47.
    Computational Biology andGenomics Facility, Indian Veterinary Research Institute gap A T G G C G T gap 0 -2 -4 -6 -8 -10 -12 -14 A -2 T -4 G -6 A -8 G -10 T -12 Matrix Filling - Gap -2; Mismatch -1; Match +1
  • 48.
    Computational Biology andGenomics Facility, Indian Veterinary Research Institute Note :- Always take the value of gap cost or mismatch cost a negative value and the values have to be different
  • 49.
    Fast All (FASTA) FASTAis the heuristic method first developed by Lipman and Pearson in 1985. How the FASTA algorithm works? •FASTA initially finds all hot-spots. Hot-spots are pairs of words of length k (2 a.a. or 6 nt) that exactly match •It then scores (substitution matrix) and identifies the 10 best diagonal runs. A diagonal run is a sequence of nearby hot spots on the same diagonal. •All good diagonal runs from close diagonals are combined, to achieve an alignment. All such alignments are scored to get the best scored alignment.
  • 51.
    The Basic LocalAlignment Search Tool (BLAST)
 ▪ The BLAST algorithm was developed by Altschul et al. in 1990 and later modified in 1997 by them. ▪ It finds regions of local similarity between sequences. ▪ The program compares nucleotide or protein sequences to sequence databases and calculates the statistical significance of matches.
  • 52.
    ▪ The queryis broken down into words (3 for a.a and 11 for nt). (the maximum number of words can be calculated: L - w +1= max. word no. (L=seq.length, w=word)). ▪ For each word from the query sequence find the list of words with high score using a substitution matrix(PAM or BLOSUM) ▪ For each exact word match, alignment is extended in both directions to find high score segments
  • 53.
    1.Raw score: Scoresbased on either PAM or BLOSUM 2. Bit-score/Normalized score: To compare different alignments, based on different scoring systems the score needs to be normalized, e.g. different substitution matrices. Important terms in BLAST:
  • 54.
    E-Value (Expectation Value): ▪Inthe context of database searches, the E-value (associated to a score S) is the number of distinct alignments, with a score equivalent to or better than S, that are expected to occur in a database search by chance. ▪The lower the E value, the more significant the score is. n = query sequence length; m = the sum of the lengths of the sequences in the database. P-value: Probability that an alignment with this score occurs by chance in a database of size N. The closer the P-value is towards 0, the better the alignment N * P
  • 55.
    Interpretation of E-value: 1. E-value is the number of matches with this score one can expect to find by chance in a database of size N. The closer the E-value is towards 0, the better the alignment. ▪For nucleotide based searches, one should look for hits with E-values of 10-6 or less and sequence identity of 70% or more ▪For protein based searches, one should look for hits with E-values of 10-3 or less and sequence identity of 25% or more
  • 56.
    Step 1: Goto the NCBI site (http://www.ncbi.nlm.nih.gov) click on Blast or type the URL (http://blast.ncbi.nlm.nih.gov/ Blast.cgi) Step 2: In the page shown below the following options are available : BLAST
  • 57.
    In this chapterwe will deal with blastn and blastp ▪Step 3 : Clicking on blastn opens a window which provides space for pasting our query sequence or for entering the accession number
  • 58.
    Query length is1662bp The colour of the line gives an idea about the total score of the query with the hit Step 4 : Click on blast to proceed and see the result (there is an option to view the results in a new window by ticking on the check box at the bottom of the page)
  • 59.
    Max score andTotal score are the same until and unless the query matches with the subject in complete segments The total query(100%) of 1662 is involved in the alignment match The 99% of the total query length of 1662bp is involved in the alignment match percent of the query length that is included in the aligned segments
  • 60.
    100% of thequery (1-1662) is involved in the alignment out of which there is only 9 7 % i d e n t i t y i . e . 1604/1662=96.5%
  • 61.
    Blastp : Step1- step 2 are similar, in step 3 press blasp and paste your sequence of interest and view the result. The only one extra parameter in blastp result is the positives which is nothing but the similarity Identities Plus the conservative substitutions gives the similarity (positives)
  • 62.
    Total score vsMax score
  • 65.
    Multiple Sequence Alignment ▪It is an extension of pairwise alignment to incorporate more than two sequences at a time. ▪ Multiple alignment methods try to align all of the sequences in a given query set. ▪ Alignments are also used to aid in establishing evolutionary relationships by constructing phylogenetic trees. ▪ Multiple sequence alignment methods can be performed by following methods : 1.Dynamic programming method : Very slow and out of vogue 2.Progressive methods : Clustal W, Clustal X and T-coffee
  • 66.
    Steps in ClustalW/Clustal X
 ▪ Determining all pairwise alignments between sequences and degrees of similarity between each pair. ▪ Constructing a "rough" similarity tree ▪ Combining the alignments starting from the most closely related groups to most distantly related groups.
  • 67.
    3.Iterative methods :MUSCLE (multiple sequence alignment by log- expectation),MAFFT (MAFFT is a multiple sequence alignment program for unix-like operating systems). These methods work similarly to progressive methods but repeatedly realign the initial sequences as well as adding new sequences to the growing MSA. 4.Hidden Markov model : PROBCONS (A practical tool for progressive protein multiple sequence alignment based on probabilistic consistency), 5.Motif finding methods: MEME(Multiple Expectation Maximization for Motif finding)
  • 68.
    Multiple Sequence alignmentby ClustalX Step 1: Load Sequences into ClustalX by choosing a file by browsing through the computer.
  • 70.
    Step 2: Docomplete Alignment by selecting from the alignment menu
  • 71.
  • 72.
  • 73.
    Step 3: Thisfile can be saved in any of the formats(Clustal, PHYLIP, fasta etc.).The alignment is saved both in clustal as well as PHYLIP formats
  • 74.
    Check the boxesagainst the formats required and click OK to save the file in an appropriate location