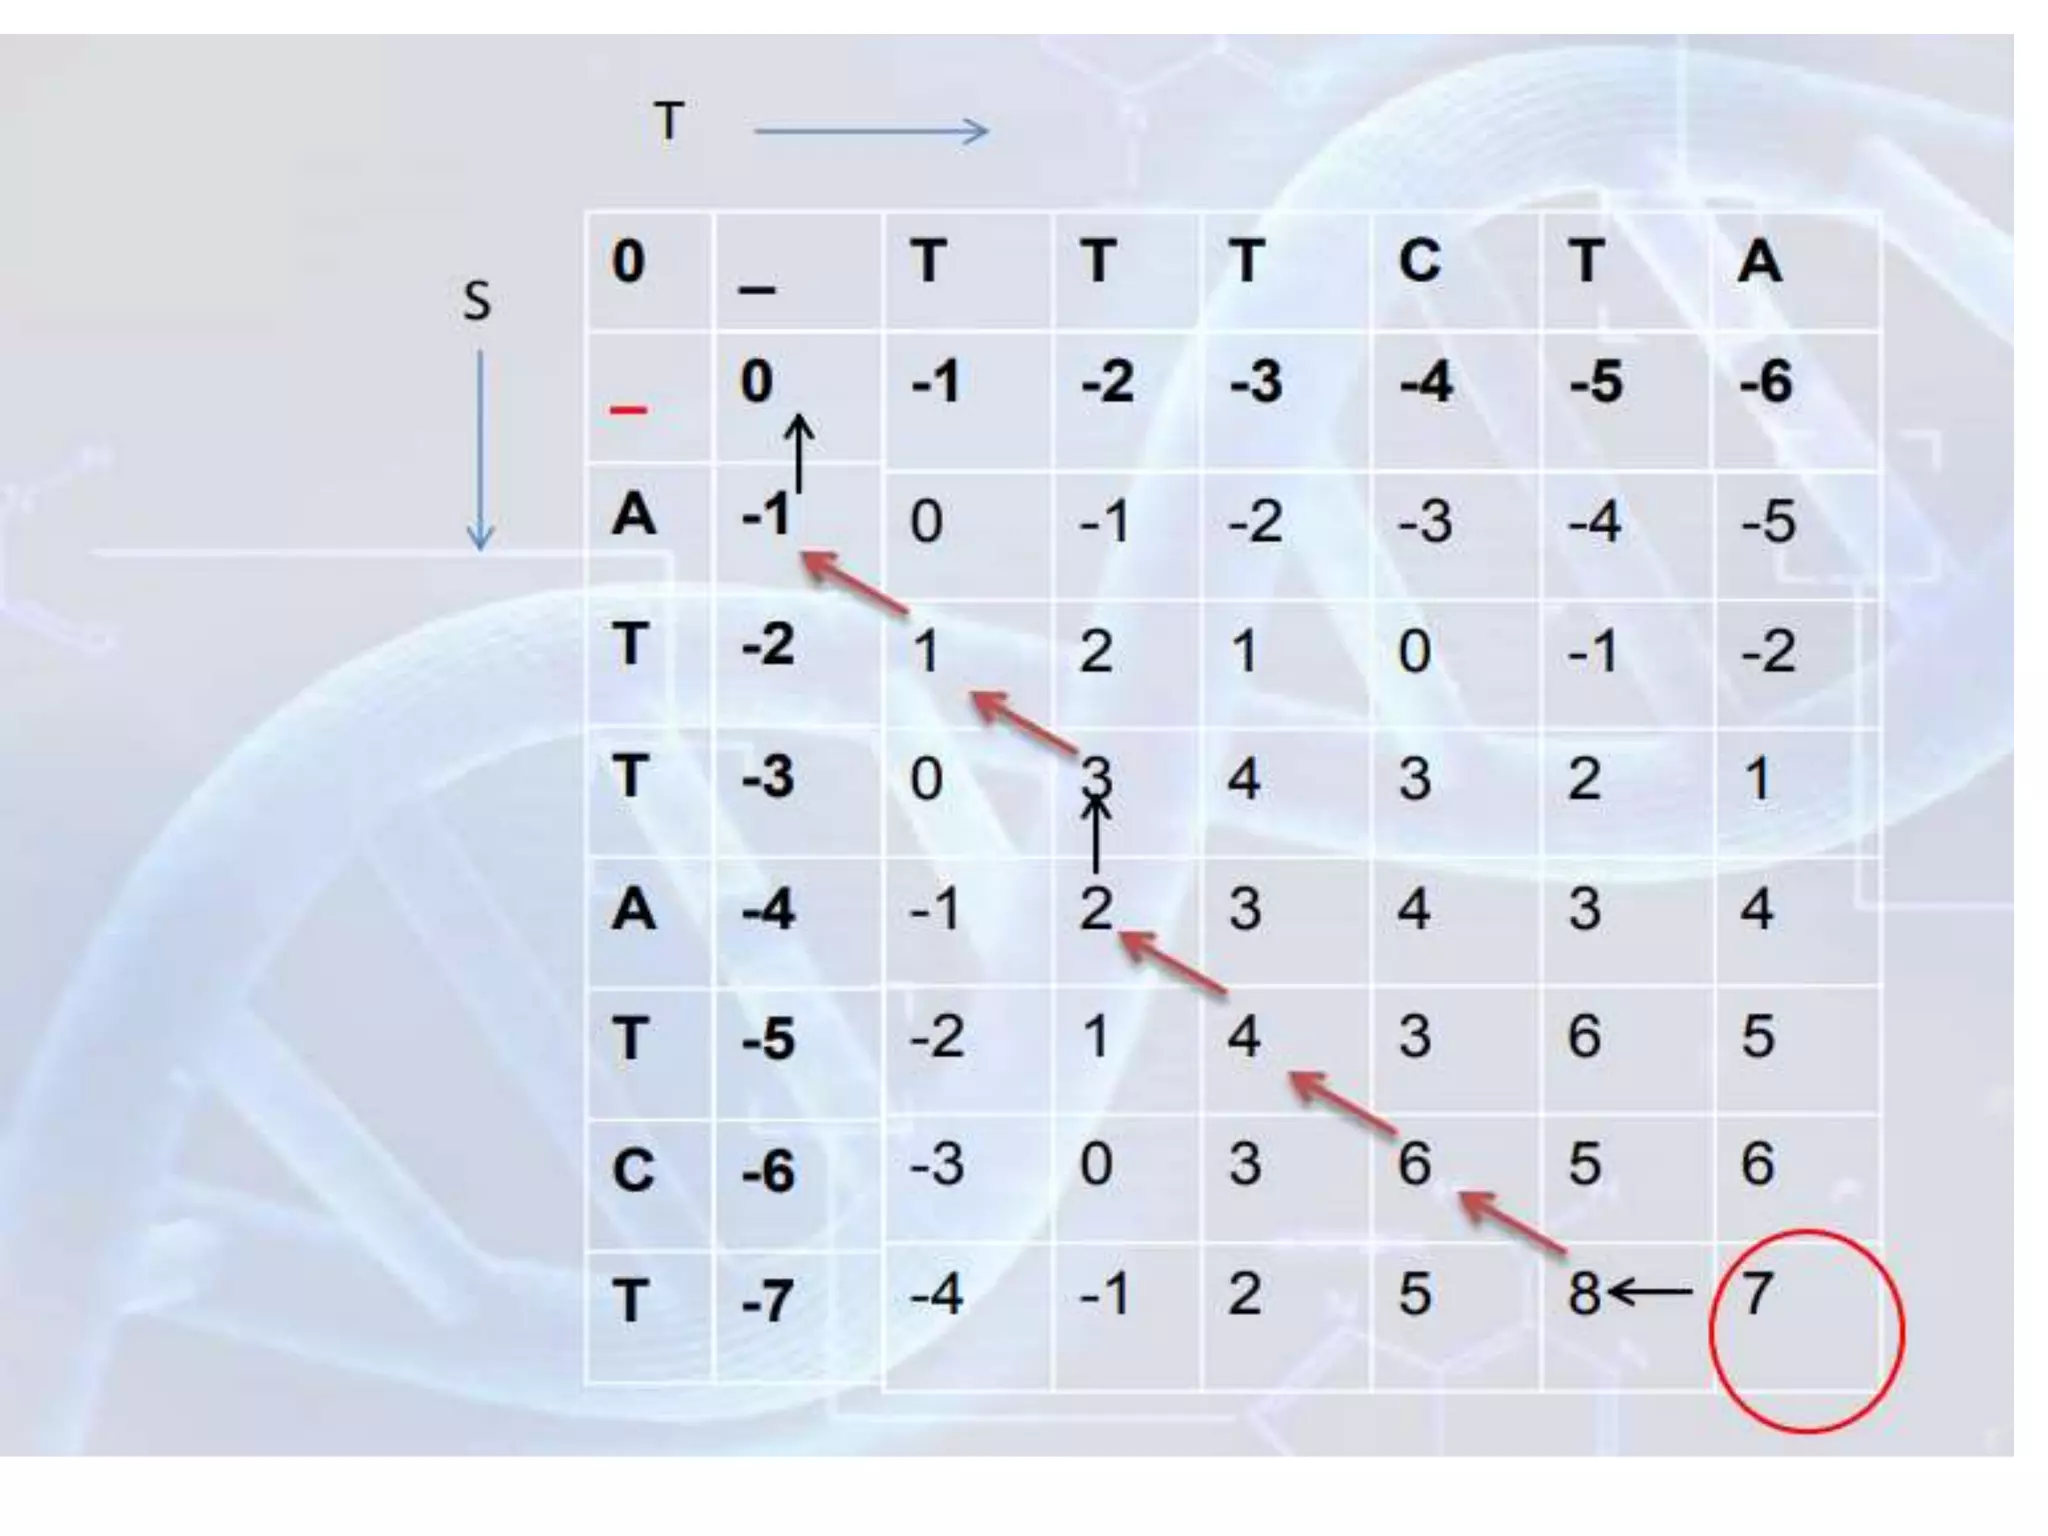
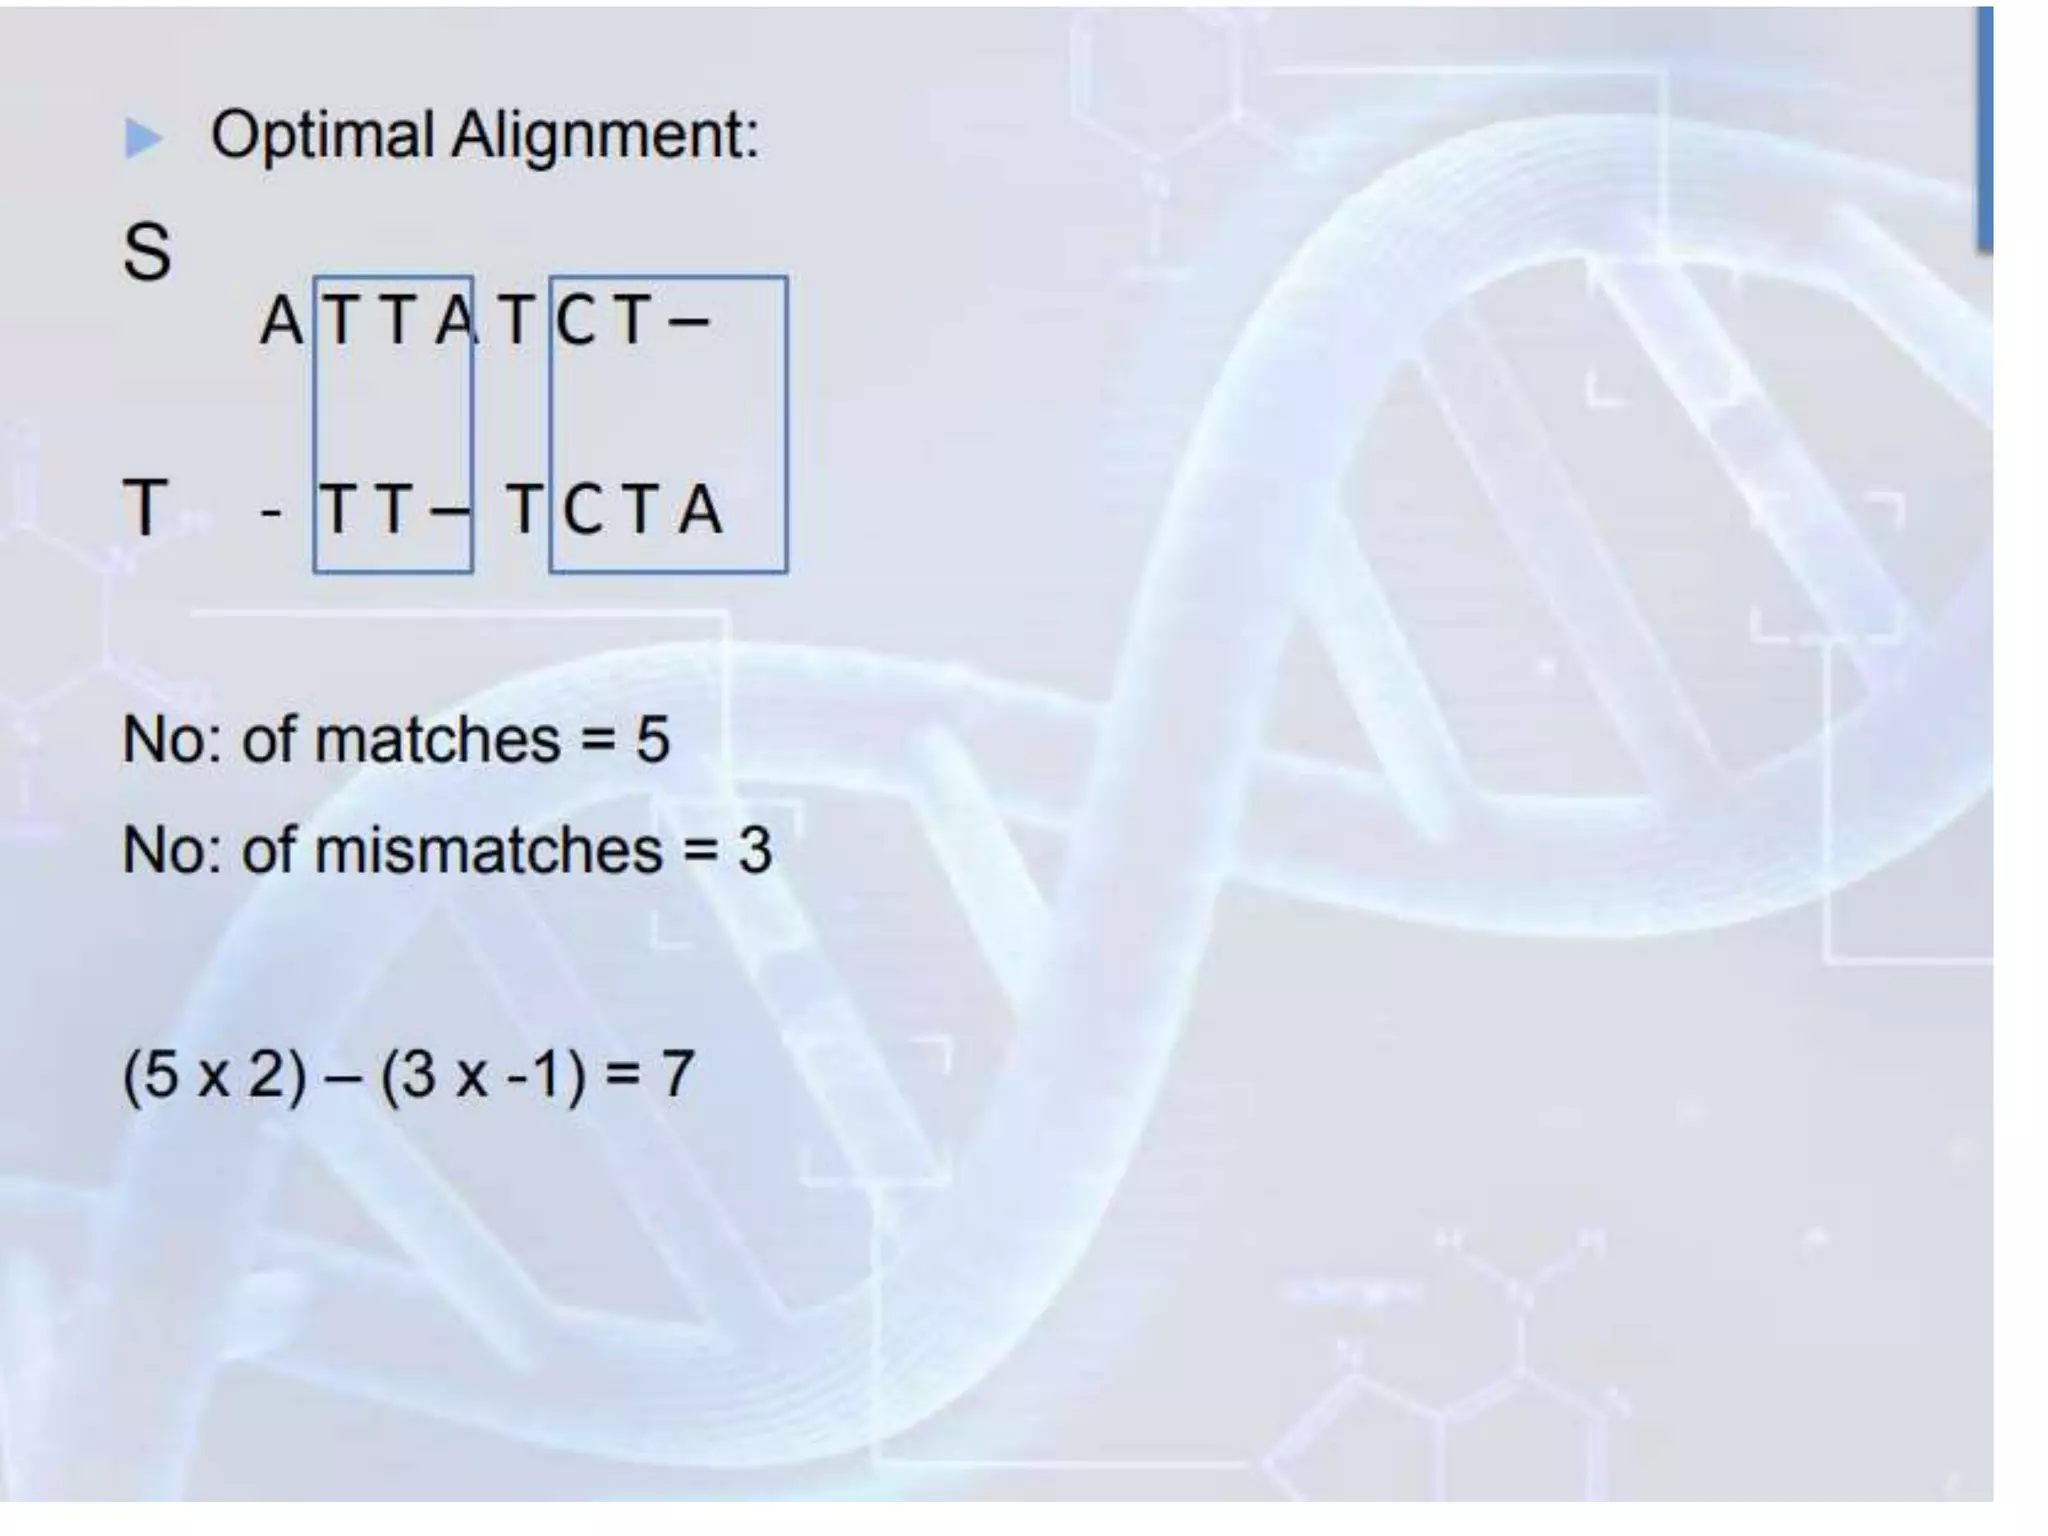
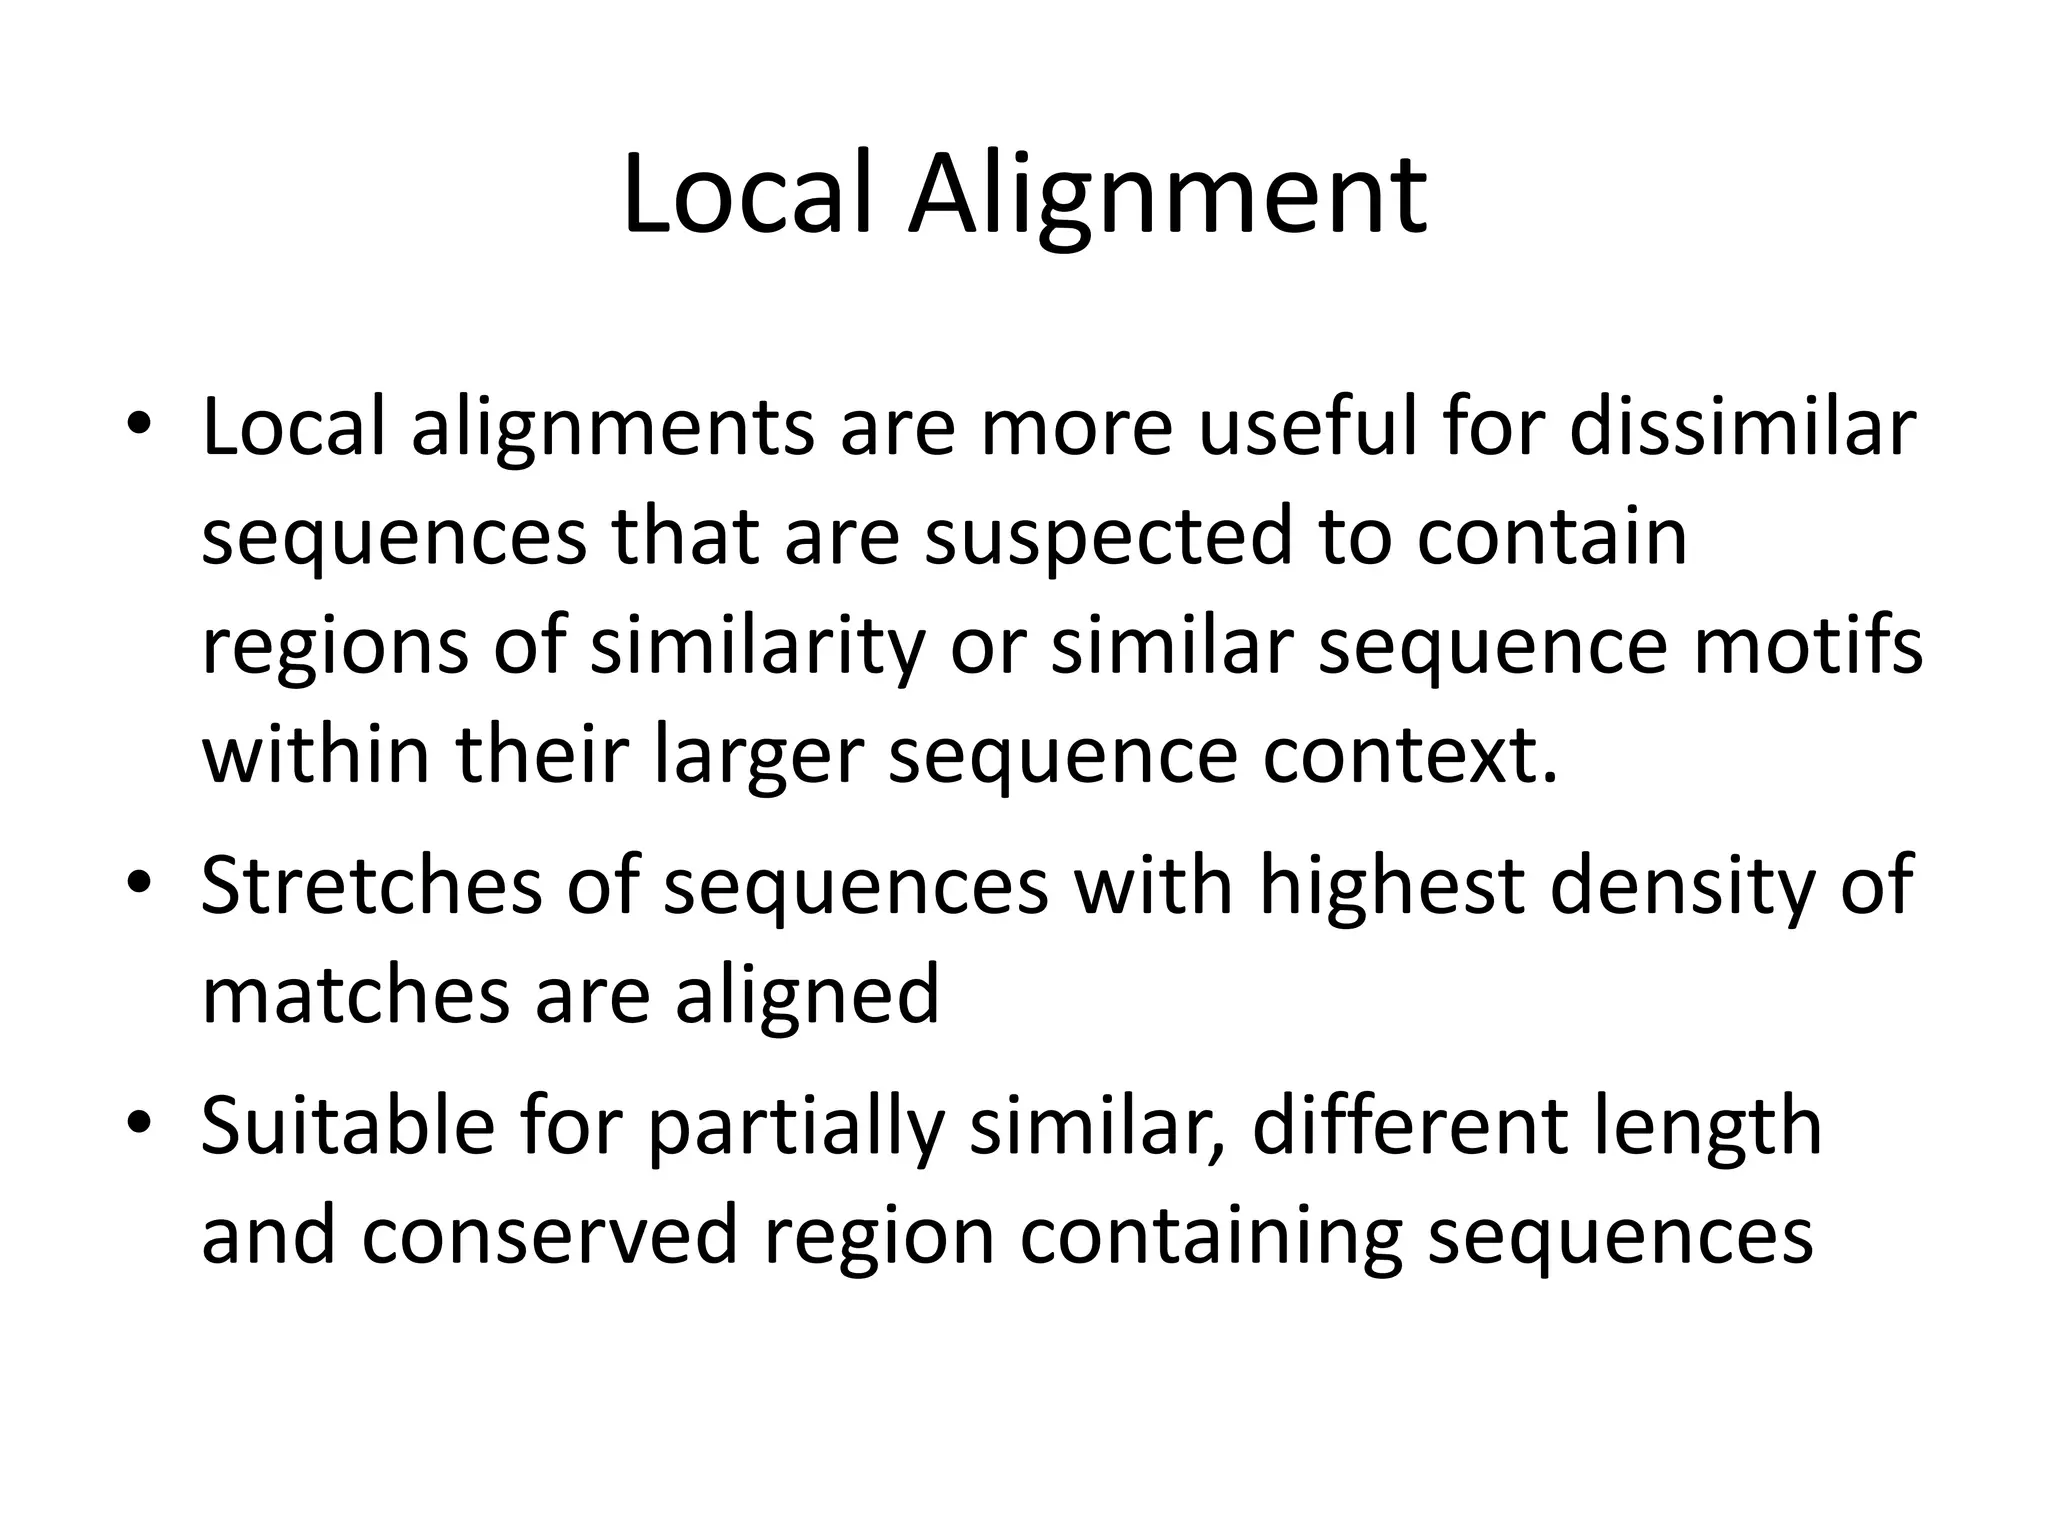
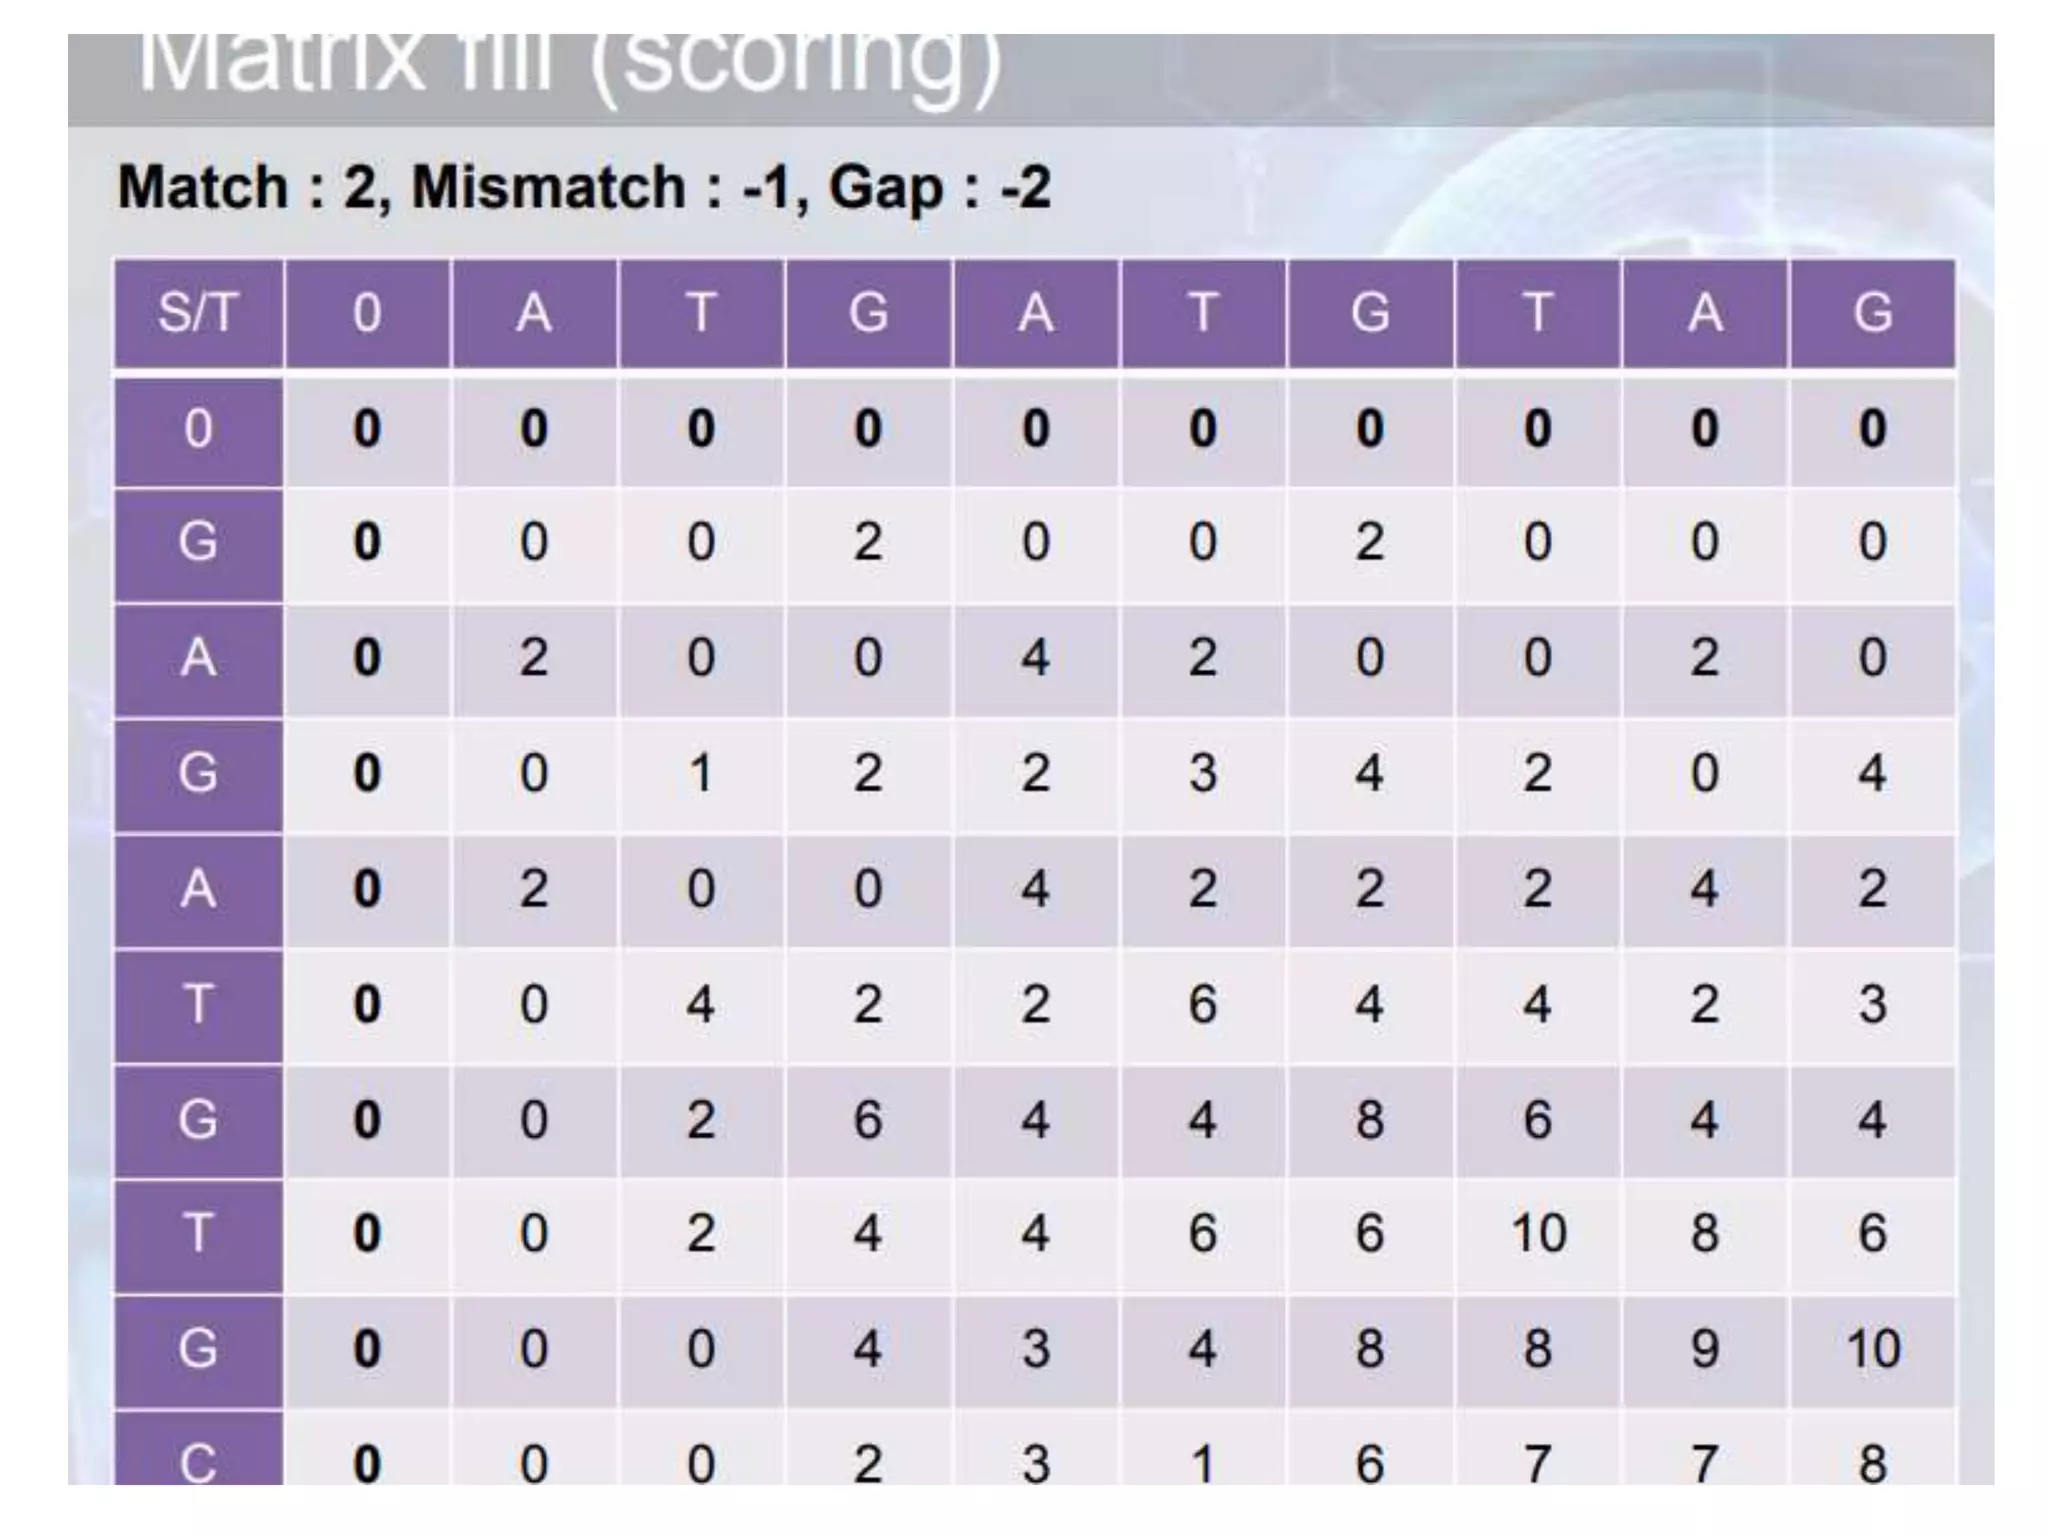
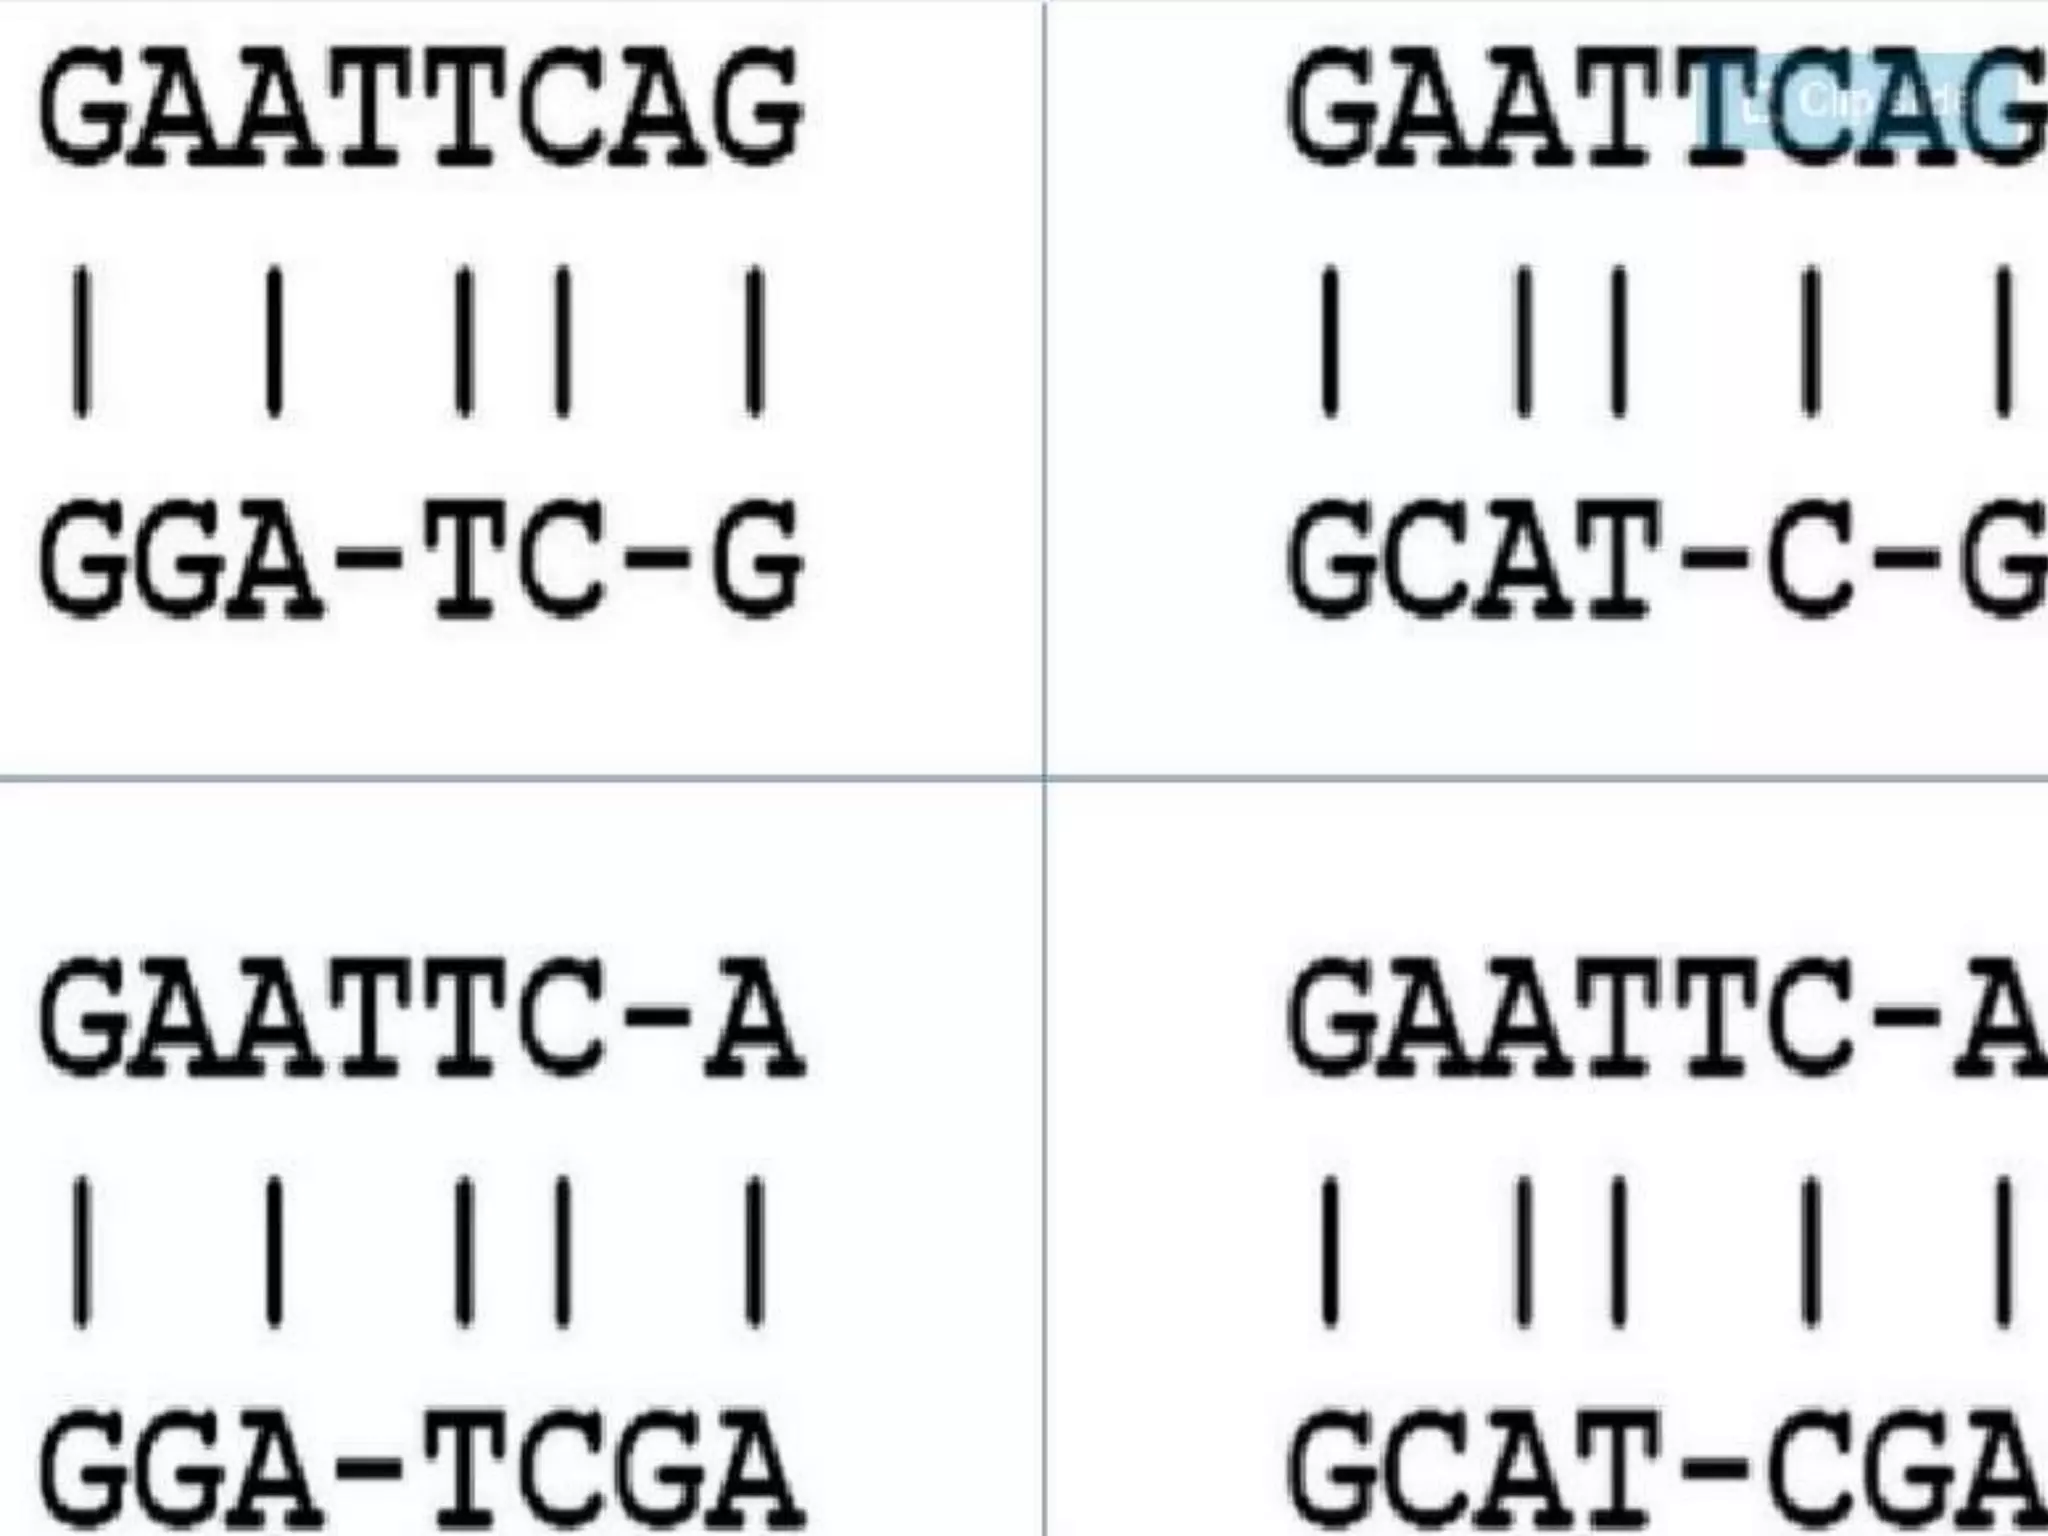
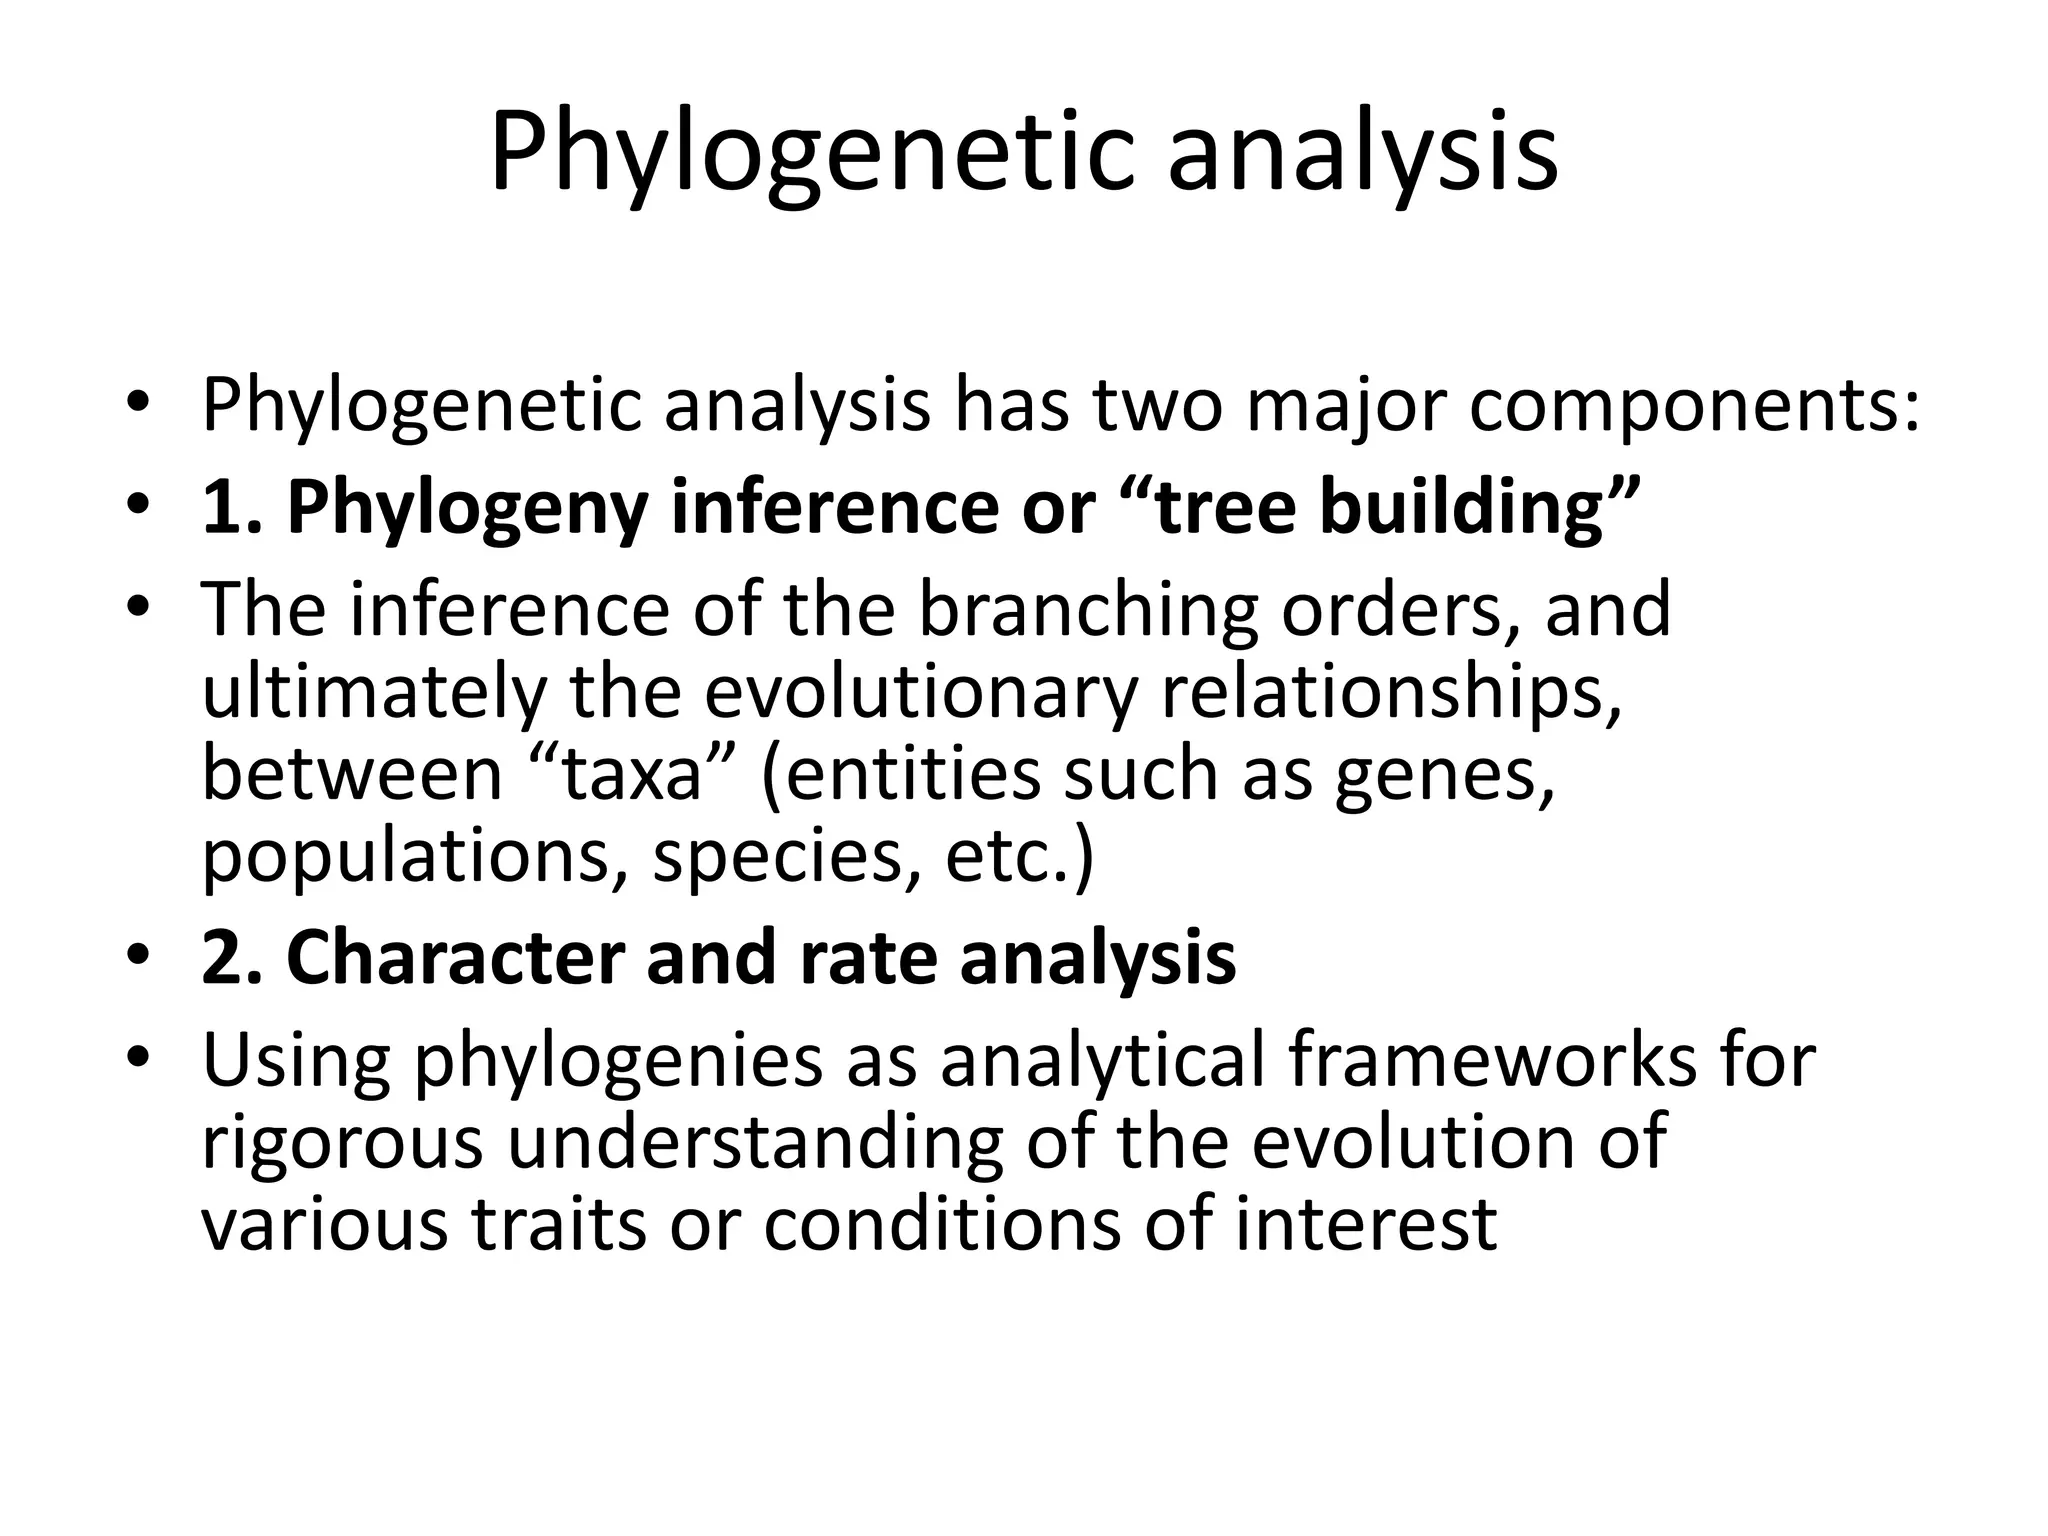
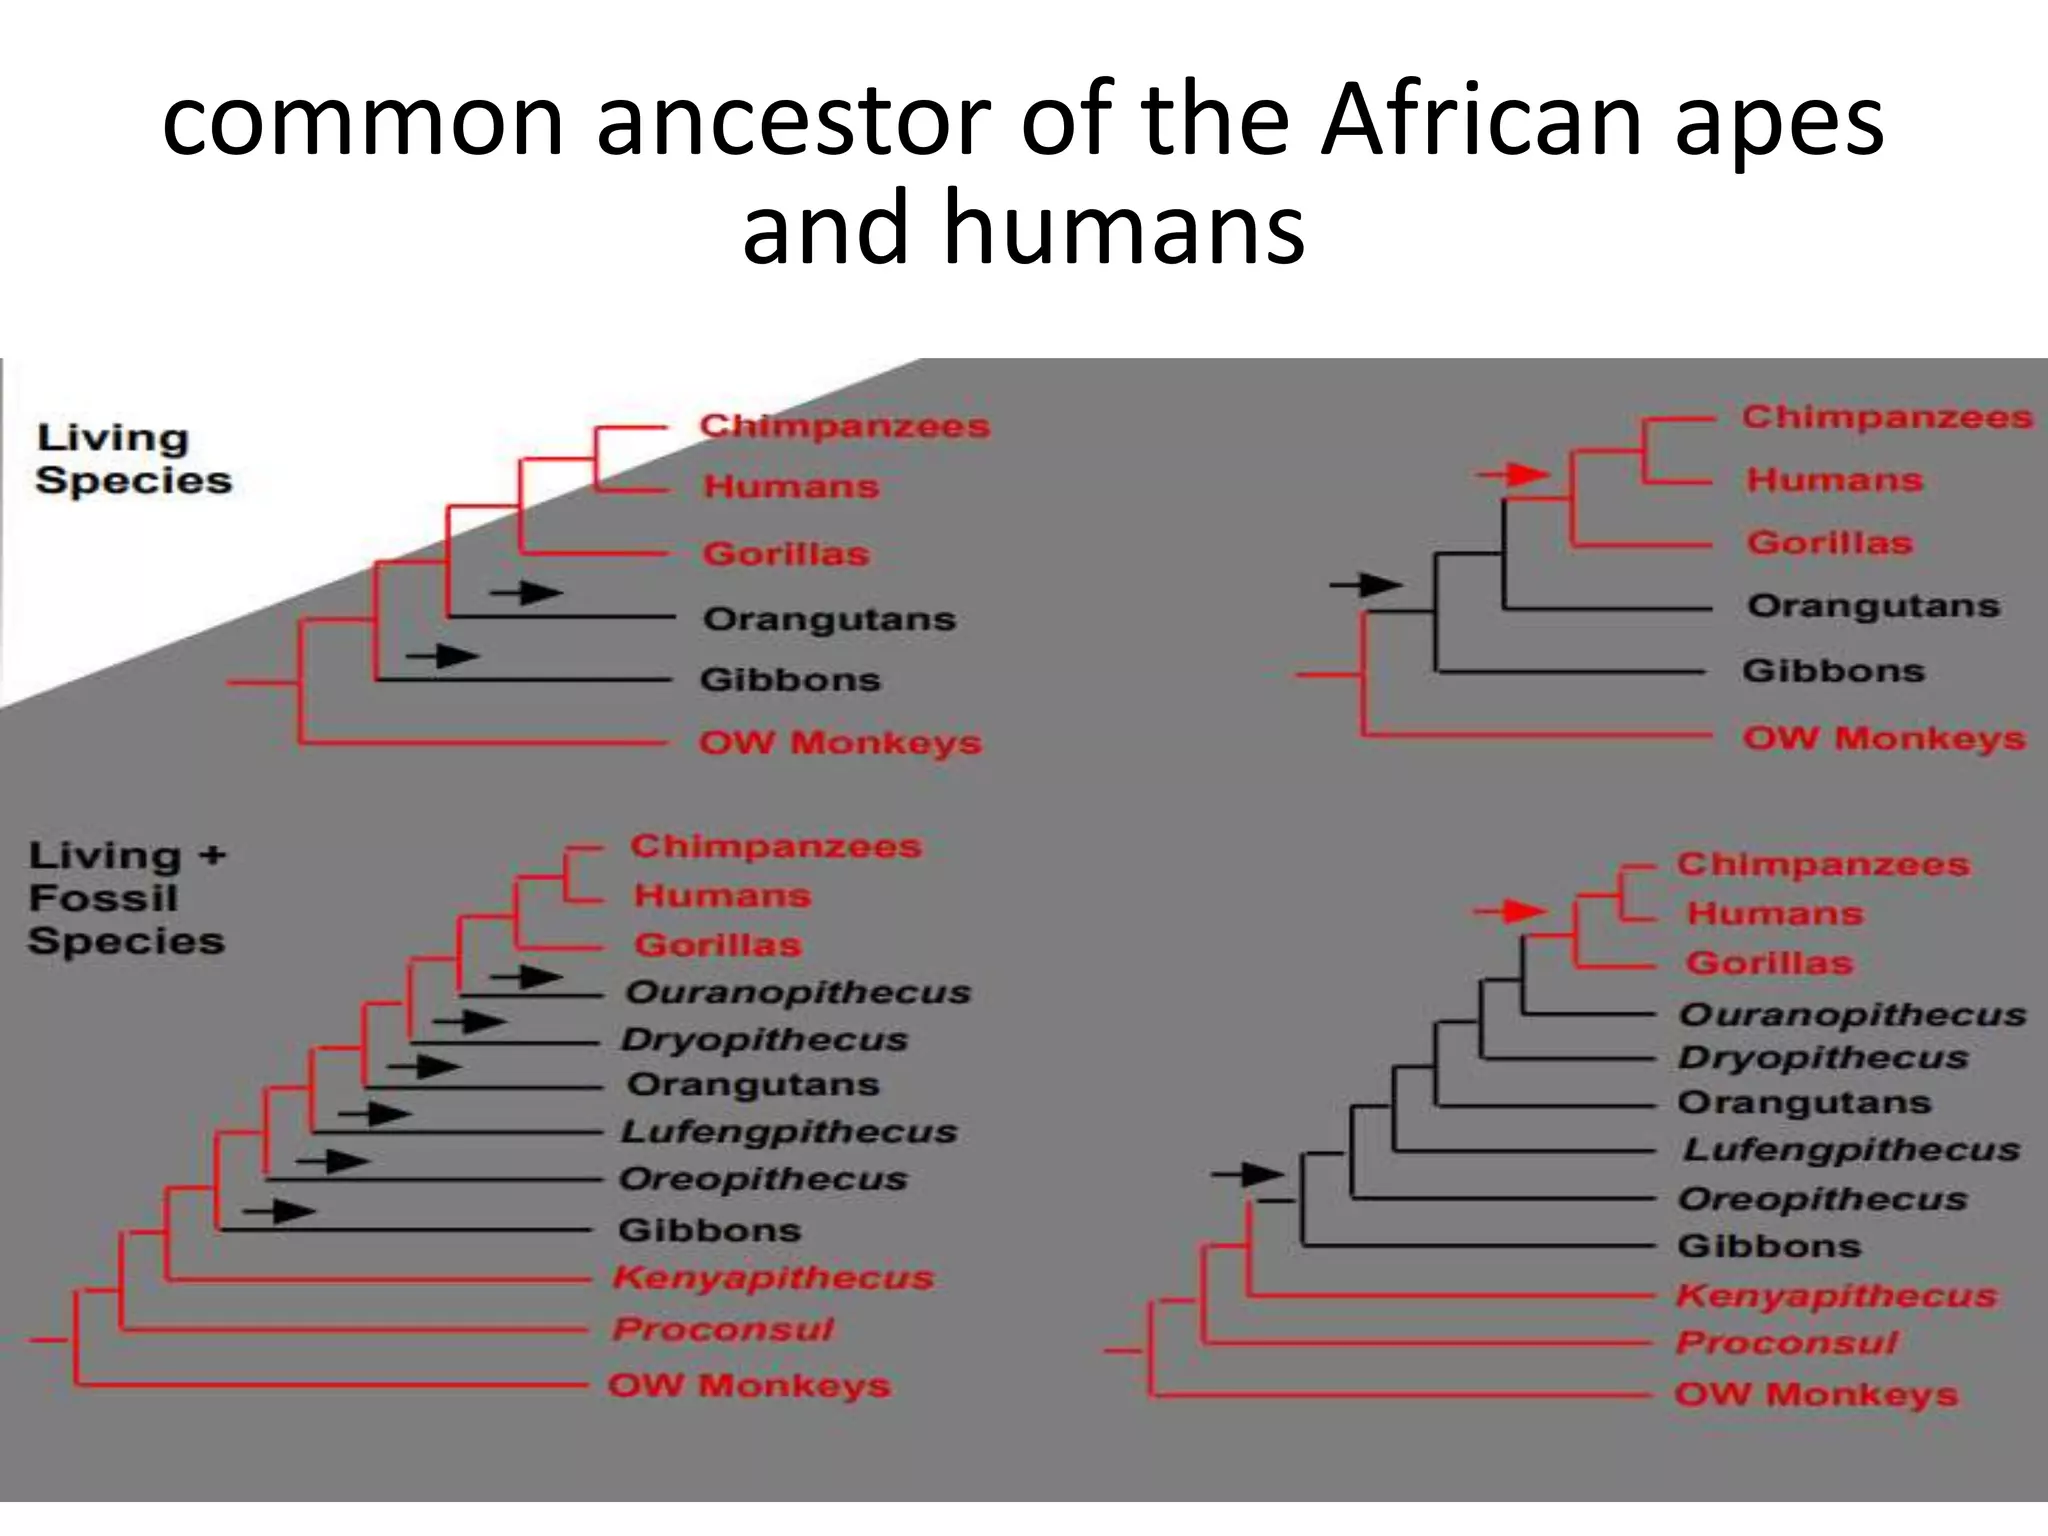
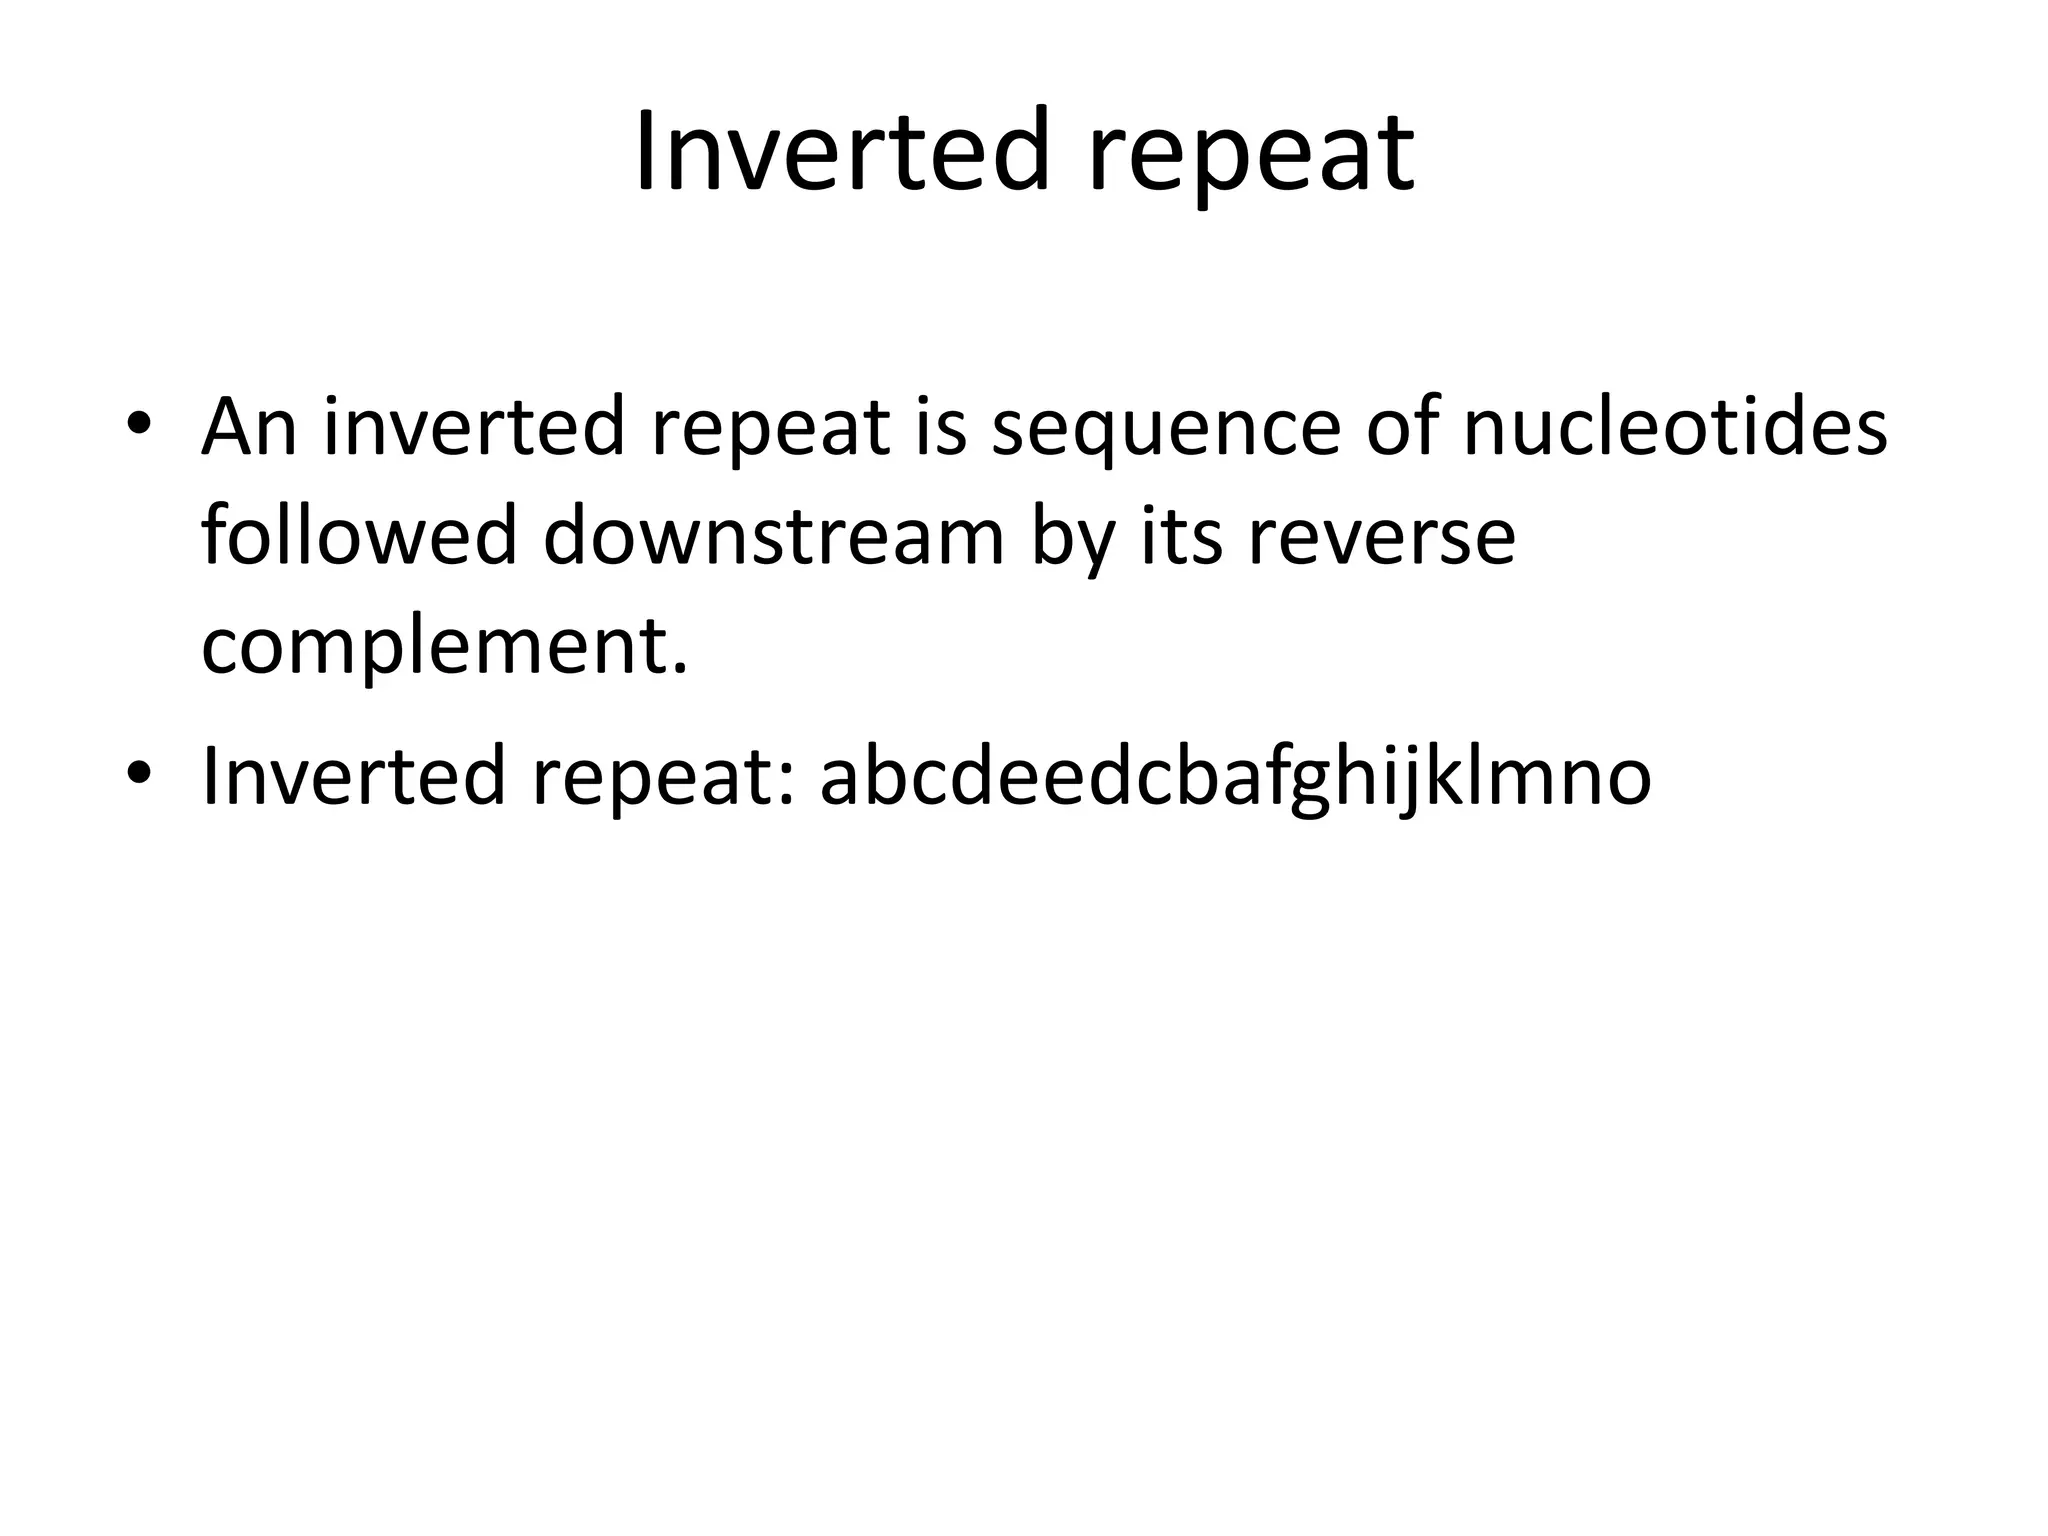
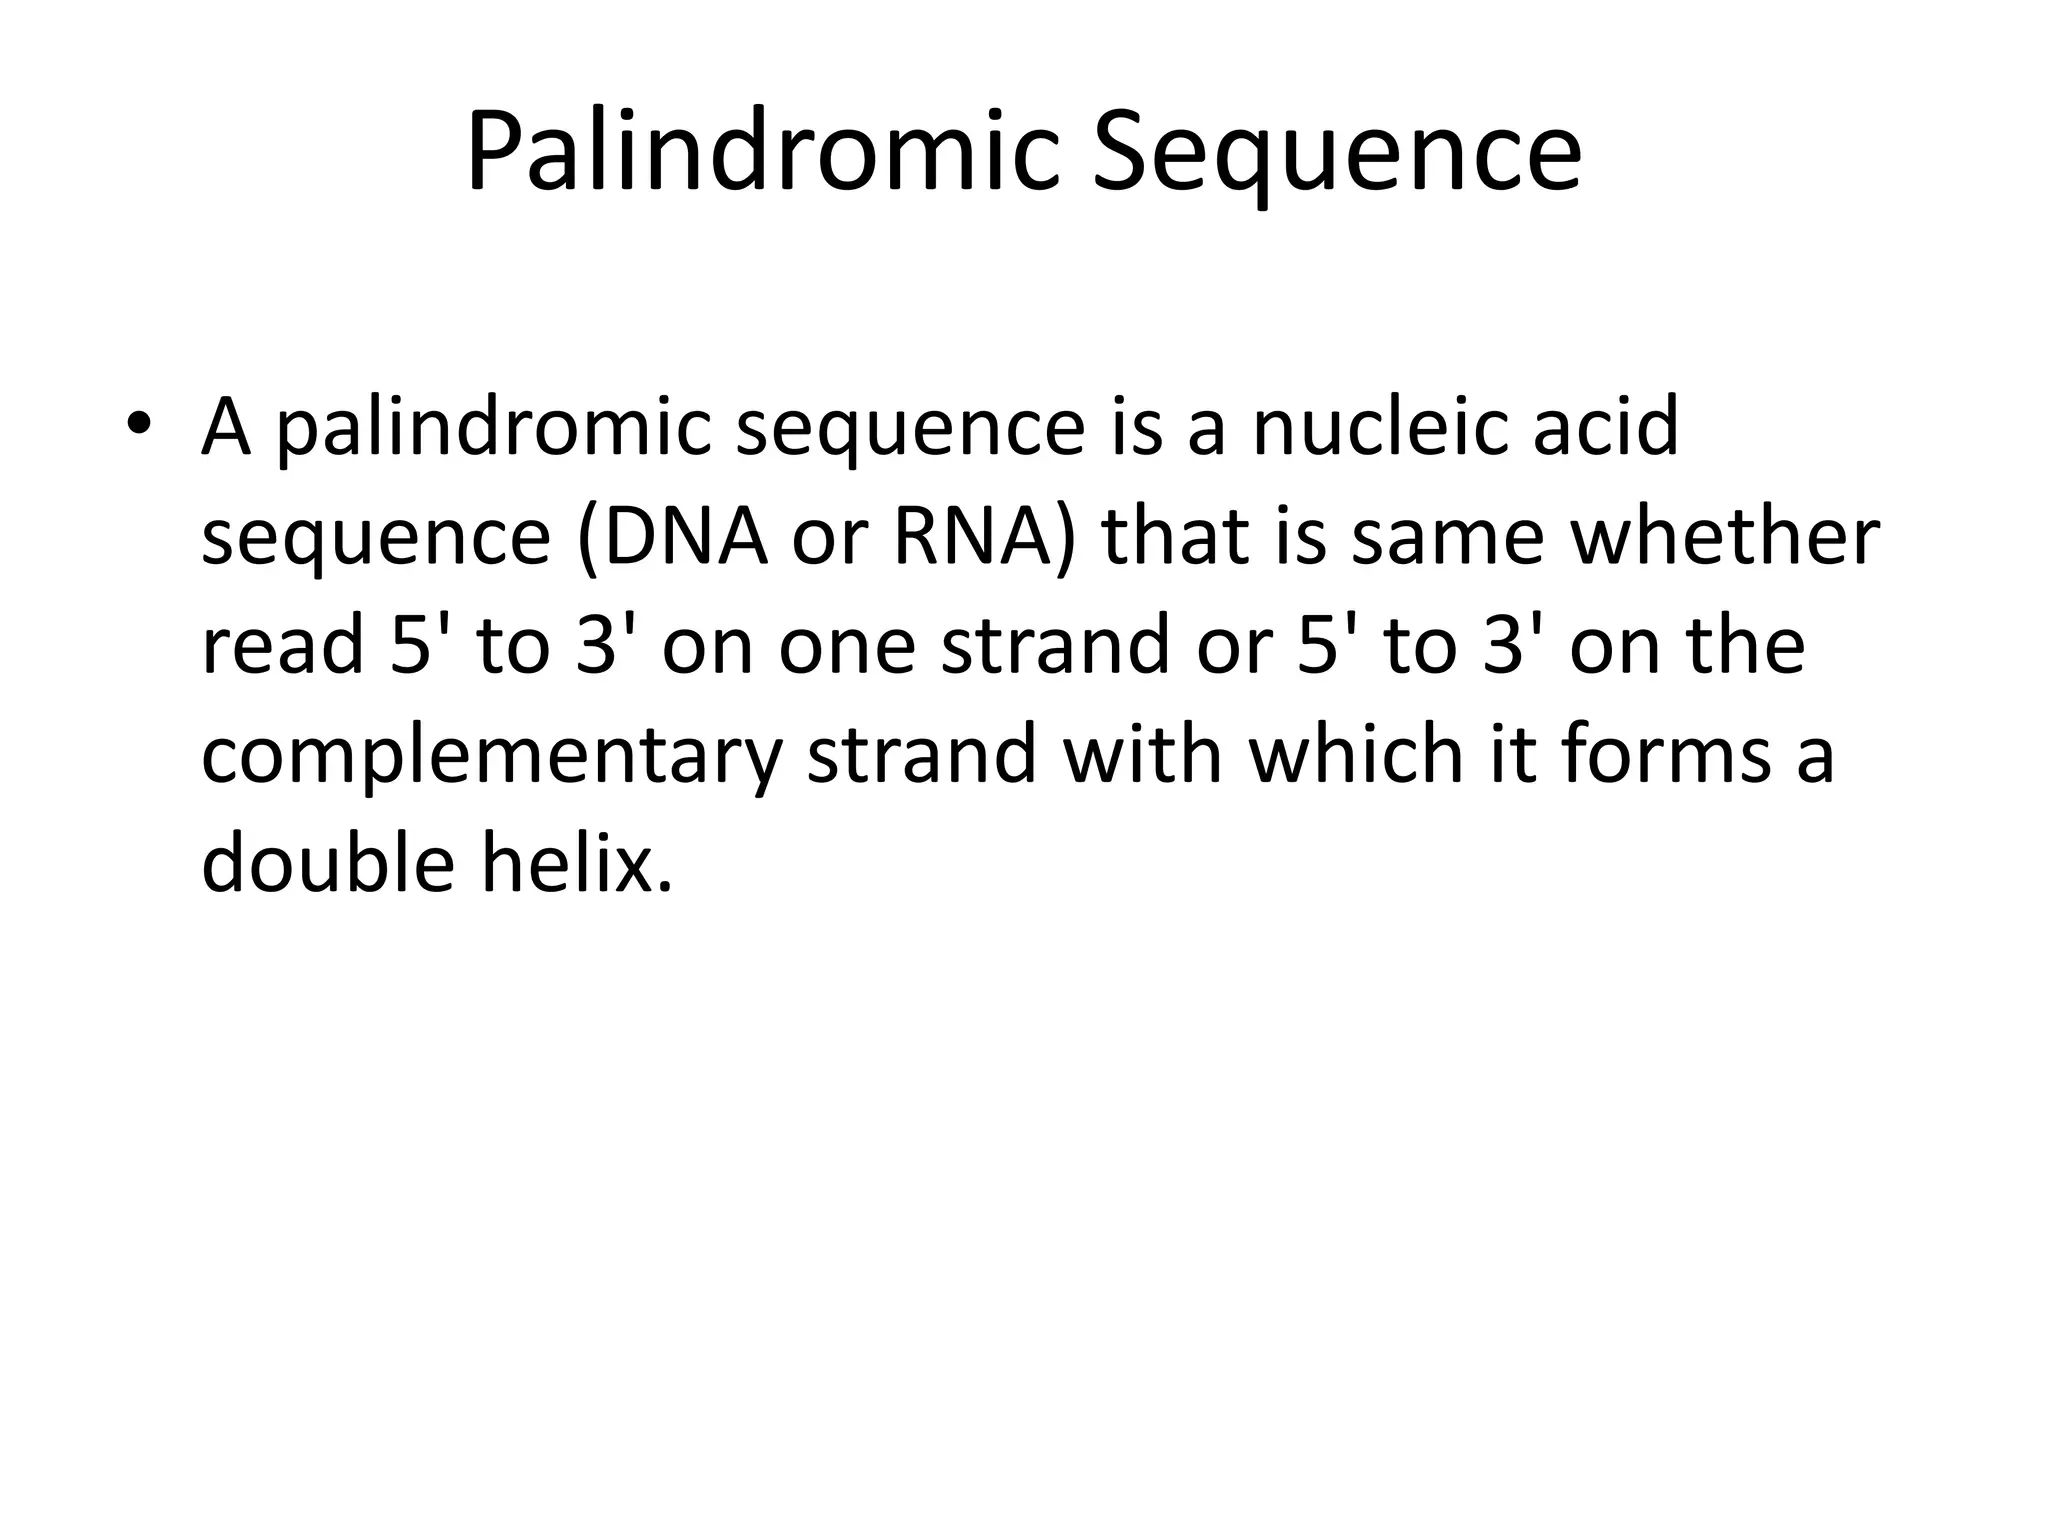
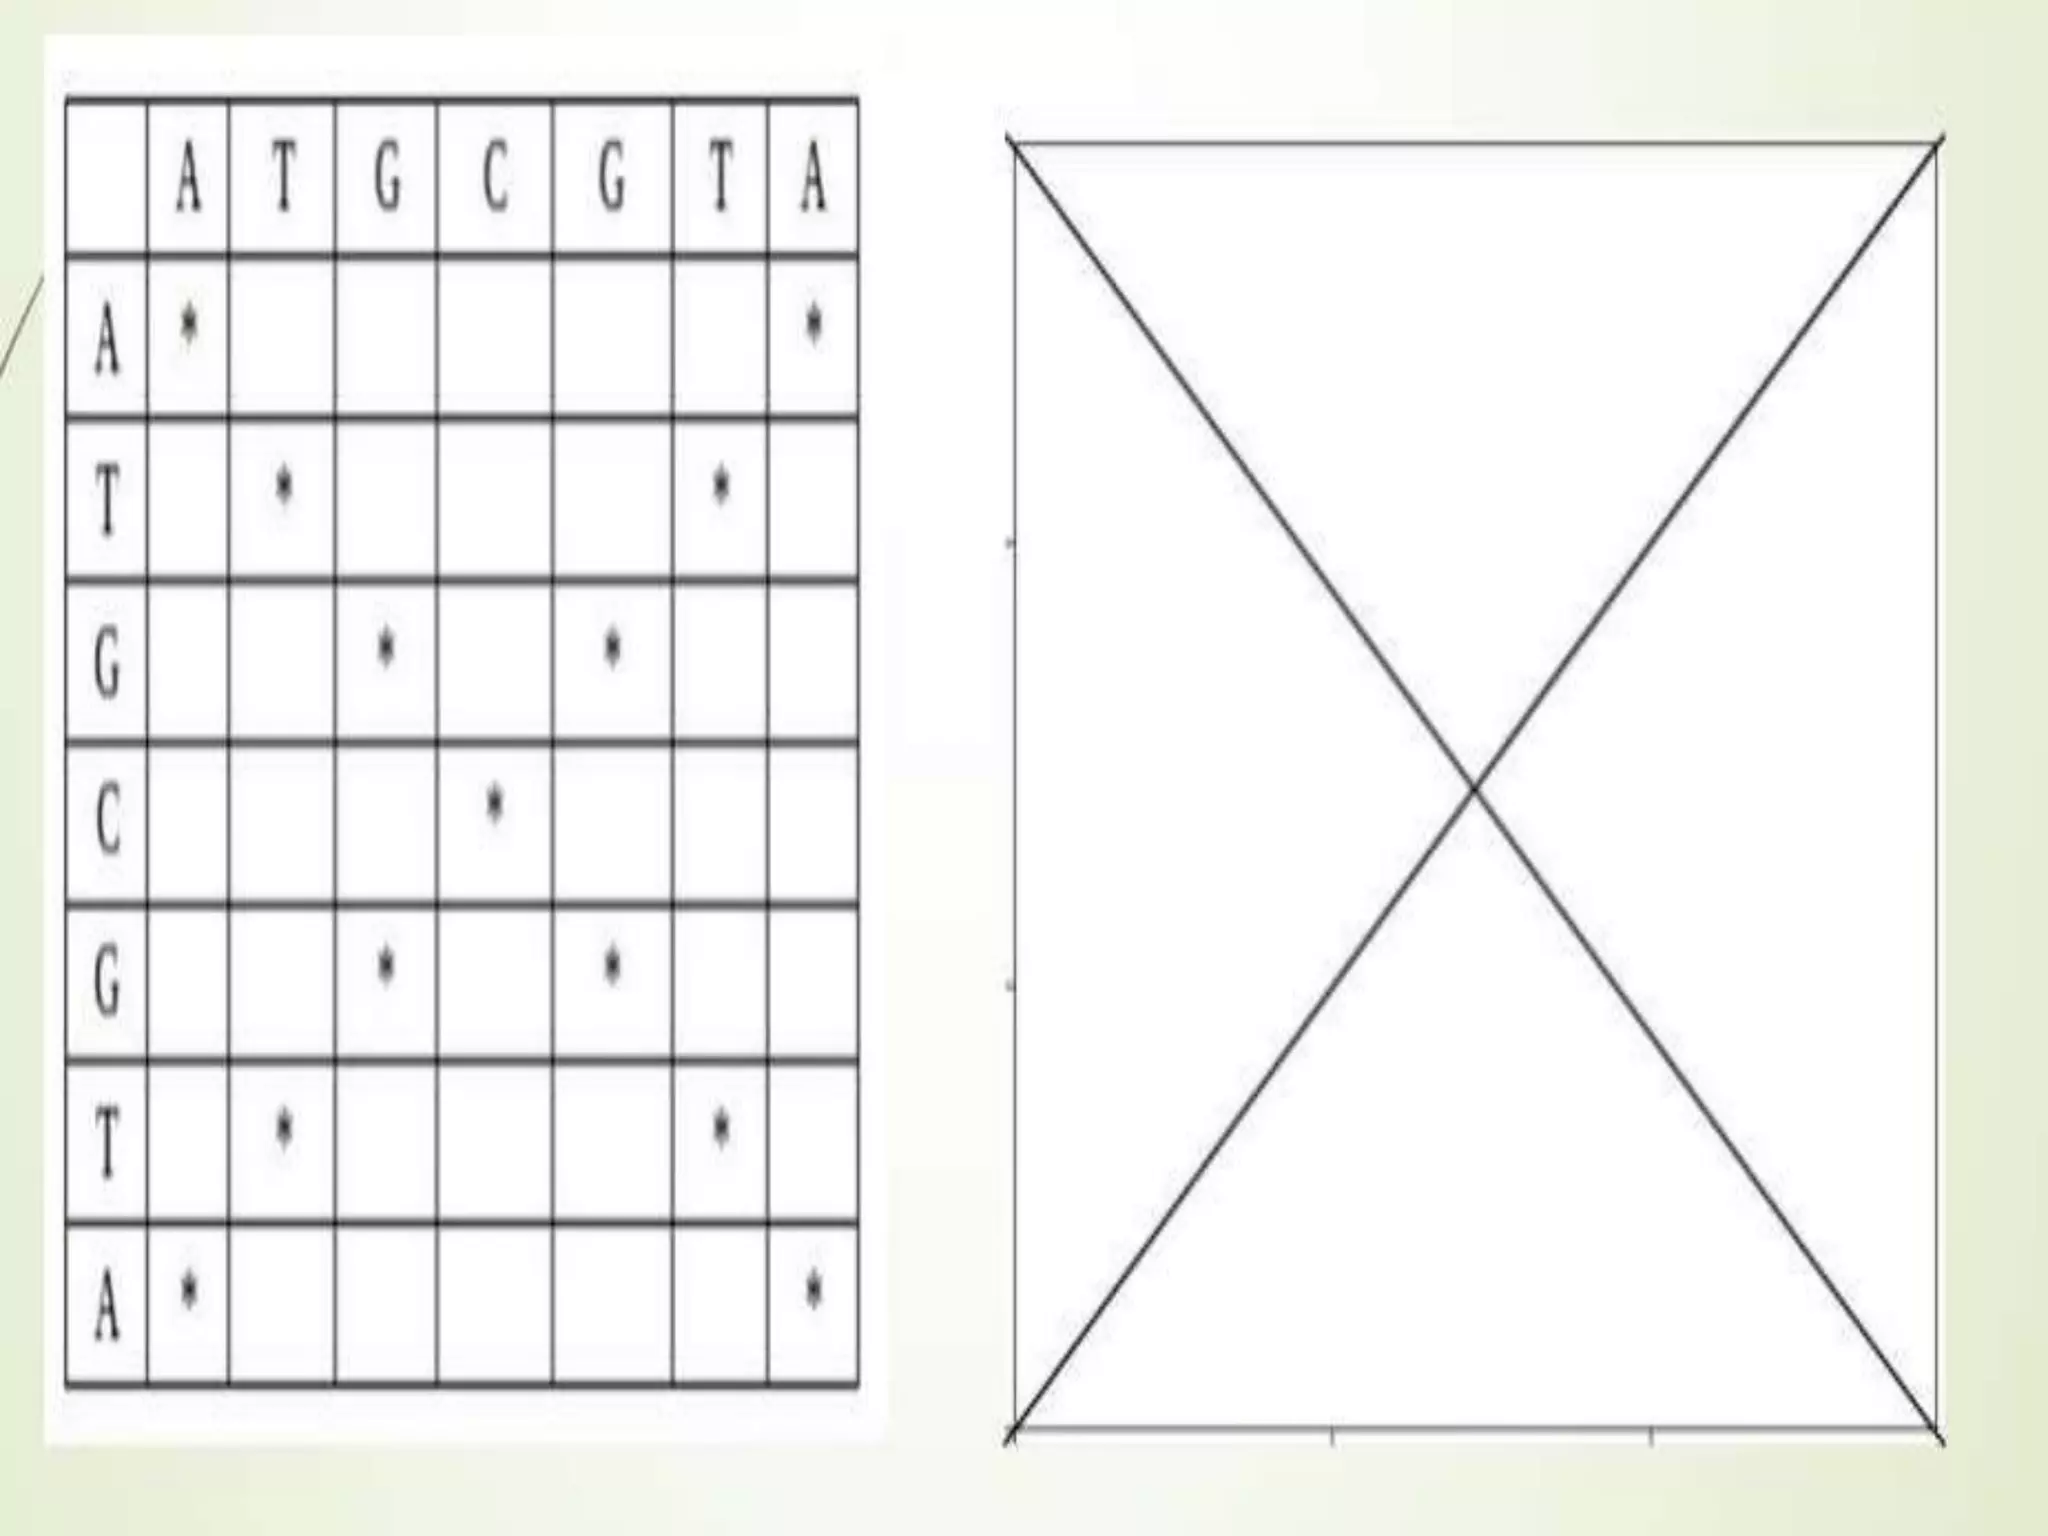
Assignment
• Course title :
• Introduction to bioinformatics
• Submitted to
MR.Saifullah
• Submitted by
Sadia Bibi
• Roll NO: 543
• Department Zoology
• Semester 8th
• Government College University Faisalabad Layyah
Campus
Question No:1
local and global alignment
Global Alignment
• A general global alignment technique is the
Needleman–Wunsch algorithm, which is
based on dynamic programming.
• Attempts to align the maximum of the entire
sequence
• Suitable for similar and equal length
sequences
• Allows obtaining the optimal alignment with
linear gap cost has been proposed by
Needleman and Wunsch by providing a score,
for each position of the aligned sequences.
• Based on the dynamic programming
technique.
• For two sequences of length m and n we
define a matrix of dimensions m+1 and n+1.
Local Alignment
• Local alignments are more useful for dissimilar
sequences that are suspected to contain
regions of similarity or similar sequence motifs
within their larger sequence context.
• Stretches of sequences with highest density of
matches are aligned
• Suitable for partially similar, different length
and conserved region containing sequences
PAIRWISE AND MULTIPLE
SEQUENCE ALLIGNMENT
Question no:2
Pairwise Alignment
• The process of lining up two or more
sequnces
• Inorder to achieve ,maximal level of identity
• For the purpose of assessing the degree of
simmilarity and the possibility of homology
• It is used to find whether the two proteins or
nuclei acids or related structurally or funtionally
• It is used to identify domains or motifs that are
shared b/w proteins
• It is the basis of BLAST searching
• It is used in the analysis of genomes
• In pair wise alignment protein sequences can
be more informative than DNA
• Protein is more informative because many
amino acids share related biophysical
properties
Uniprot
• Uni prot is a comprehensive high quality and
freely accessible database of protein
sequences and functional information
• Many entries being derived from a genome
sequencing projects
• It contains a large amount of information
about the biological functions of proteins
derived from the research literature
Dot Plot
• Ijn bioinformatics a dot plot is a graphical
method that allows the comparison of two
biological sequnces
• Which identify regions of close simmilarity
b/w them
• It is o type of recurrence plot
• These are introduced by Gibbs and Mclntyre
in 1970
• They are two dimensional matrices that have
sequences of proteins being compared along
vertical and horizontal axes
• Individual cells in the matrix can be shaded
black if residues are identical so that matching
sequence segments appear runs of diagonal
lines across the matrix.
Multiple sequnce alignment
• A multiple sequence alignment is a basic tool
for the sequnce alignment of two or more
biological sequences.
• Generally proteins,DNA,or RNA.
• In many cases ,the input set of query
sequences are assumed to have an
evolutionary relationship.
• By which they share lineage and are
descended from a common ancestor.
Example
Question No:3
Phylogenetic analysis in bioinformatics
Phylogenetic analysis
• Phylogenetic analysis has two major components:
• 1. Phylogeny inference or “tree building”
• The inference of the branching orders, and
ultimately the evolutionary relationships,
between “taxa” (entities such as genes,
populations, species, etc.)
• 2. Character and rate analysis
• Using phylogenies as analytical frameworks for
rigorous understanding of the evolution of
various traits or conditions of interest
A few examples of what can be learned from character
analysis using phylogenies as analytical frameworks
• When did specific episodes of positive
Darwinian selection occur during evolutionary
history
• Which genetic changes are unique to the
human lineage
• What was the most likely geographical location
of the common ancestor of the African apes
and humans
• Plus countless others
common ancestor of the African apes
and humans
The goal of phylogeny inference is to resolve the
branching orders of lineages in evolutionary trees
Completely
unresolved or
"star" phylogeny
Partially
resolved
phylogeny
Fully
resolved,
bifurcating
phylogeny
The number of unrooted trees increases in a
greater than exponential manner with number
of taxa
Inferring evolutionary relationships
between the taxa requires rooting the tree
To root a tree mentally, imagine that the tree is
made of string. Grab the string at the root
and tug on it until the ends of the string (the
taxa) fall opposite the root
root at another position
Unrooted tree
Rooted tree
Note that in this rooted tree, taxon A is most
closely related to taxon B, and together they
are equally distantly related to taxa C and D.
There are two major ways to root trees
• By outgroup:
• Uses taxa (the “outgroup”)
that are known to fall outside
of the group of interest (the
“ingroup”).
• Requires some prior
knowledge about the
relationships among the taxa.
The outgroup can either be
species
• (e.g., birds to root a
mammalian tree) or previous
gene duplicates (e.g., α-
globins to root β-globins).
• By midpoint or distance:
Roots the tree at the
midway point between the
two most distant taxa in
the tree, as determined by
branch lengths.
• Assumes that the taxa are
evolving in a clock-like
manner.
• This assumption is built
into some of the distance-
based tree building
methods.
Computational methods for finding
optimal trees
• Exact algorithms
• "Guarantee" to find the
optimal or "best" tree for the
method of choice. Two types
used in tree building:
• Exhaustive search: Evaluates
all possible unrooted trees,
choosing the one with the best
score for the method.
• Branch-and-bound search:
Eliminates the parts of the
search tree that only contain
suboptimal solutions.
• Heuristic algorithms
• Approximate or “quick-and-
dirty” methods that attempt
to find the optimal tree for
the method of choice, but
cannot guarantee to do so.
• Heuristic searches often
operate by “hill-climbing”
methods.
Heuristic search algorithms are input order
dependent and can get stuck in local minima
or maxima
Rerunning heuristic searches using
different input orders of taxa can
help find global minima or maxima
Question No:4
Dot Matrix Plot
Dot Matrix
• A dot plot is a visual representation of the similarities
between two sequences.
• One sequence (A) is listed across the top of the matrix and
the other (B) is listed down the left side
• Starting from the first character in B, one moves across the
page keeping in the first row and placing a dot in many
column where the character in A is the same
• The process is continued until all possible comparisons
between A and B are made
• Any region of similarity is revealed by a diagonal row of
dots
• Isolated dots not on diagonal represent random matches
Dot plot interpretation
Seq1: ATGATAT
Seq2: ATGATAT
Bioinformatic Softwares for dot plot
analysis
• LALIGN
• DOTLET
• DOTMATCHER
• SIM
FACTORS COMPUTED BY THE
SOFTWARES
• Gap open penalty
• Pairwise alignment score for the first residue in a gap.
• Default value is: -12
• Gap Extend Penalty
• Pairwise alignment score for each additional residue in a
gap
• Default value is: -2
• Expectation Threshold
• Limits the number of scores and alignments reported based
on the expectation value.
• This is the maximum number of times the match is
expected to occur by chance
SIM
LALIGN
DOTLET
DotMatcher
Inverted repeat
• An inverted repeat is sequence of nucleotides
followed downstream by its reverse
complement.
• Inverted repeat: abcdeedcbafghijklmno
Palindromic Sequence
• A palindromic sequence is a nucleic acid
sequence (DNA or RNA) that is same whether
read 5' to 3' on one strand or 5' to 3' on the
complementary strand with which it forms a
double helix.
local and global allignment

local and global allignment

  • 1.
    Assignment • Course title: • Introduction to bioinformatics • Submitted to MR.Saifullah • Submitted by Sadia Bibi • Roll NO: 543 • Department Zoology • Semester 8th • Government College University Faisalabad Layyah Campus
  • 2.
    Question No:1 local andglobal alignment
  • 3.
    Global Alignment • Ageneral global alignment technique is the Needleman–Wunsch algorithm, which is based on dynamic programming. • Attempts to align the maximum of the entire sequence • Suitable for similar and equal length sequences
  • 4.
    • Allows obtainingthe optimal alignment with linear gap cost has been proposed by Needleman and Wunsch by providing a score, for each position of the aligned sequences. • Based on the dynamic programming technique. • For two sequences of length m and n we define a matrix of dimensions m+1 and n+1.
  • 8.
    Local Alignment • Localalignments are more useful for dissimilar sequences that are suspected to contain regions of similarity or similar sequence motifs within their larger sequence context. • Stretches of sequences with highest density of matches are aligned • Suitable for partially similar, different length and conserved region containing sequences
  • 12.
    PAIRWISE AND MULTIPLE SEQUENCEALLIGNMENT Question no:2
  • 13.
    Pairwise Alignment • Theprocess of lining up two or more sequnces • Inorder to achieve ,maximal level of identity • For the purpose of assessing the degree of simmilarity and the possibility of homology
  • 15.
    • It isused to find whether the two proteins or nuclei acids or related structurally or funtionally • It is used to identify domains or motifs that are shared b/w proteins • It is the basis of BLAST searching • It is used in the analysis of genomes
  • 16.
    • In pairwise alignment protein sequences can be more informative than DNA • Protein is more informative because many amino acids share related biophysical properties
  • 17.
    Uniprot • Uni protis a comprehensive high quality and freely accessible database of protein sequences and functional information • Many entries being derived from a genome sequencing projects • It contains a large amount of information about the biological functions of proteins derived from the research literature
  • 18.
    Dot Plot • Ijnbioinformatics a dot plot is a graphical method that allows the comparison of two biological sequnces • Which identify regions of close simmilarity b/w them • It is o type of recurrence plot
  • 19.
    • These areintroduced by Gibbs and Mclntyre in 1970 • They are two dimensional matrices that have sequences of proteins being compared along vertical and horizontal axes • Individual cells in the matrix can be shaded black if residues are identical so that matching sequence segments appear runs of diagonal lines across the matrix.
  • 20.
    Multiple sequnce alignment •A multiple sequence alignment is a basic tool for the sequnce alignment of two or more biological sequences. • Generally proteins,DNA,or RNA. • In many cases ,the input set of query sequences are assumed to have an evolutionary relationship. • By which they share lineage and are descended from a common ancestor.
  • 21.
  • 22.
  • 23.
    Phylogenetic analysis • Phylogeneticanalysis has two major components: • 1. Phylogeny inference or “tree building” • The inference of the branching orders, and ultimately the evolutionary relationships, between “taxa” (entities such as genes, populations, species, etc.) • 2. Character and rate analysis • Using phylogenies as analytical frameworks for rigorous understanding of the evolution of various traits or conditions of interest
  • 24.
    A few examplesof what can be learned from character analysis using phylogenies as analytical frameworks • When did specific episodes of positive Darwinian selection occur during evolutionary history • Which genetic changes are unique to the human lineage • What was the most likely geographical location of the common ancestor of the African apes and humans • Plus countless others
  • 25.
    common ancestor ofthe African apes and humans
  • 26.
    The goal ofphylogeny inference is to resolve the branching orders of lineages in evolutionary trees Completely unresolved or "star" phylogeny Partially resolved phylogeny Fully resolved, bifurcating phylogeny
  • 27.
    The number ofunrooted trees increases in a greater than exponential manner with number of taxa
  • 28.
    Inferring evolutionary relationships betweenthe taxa requires rooting the tree To root a tree mentally, imagine that the tree is made of string. Grab the string at the root and tug on it until the ends of the string (the taxa) fall opposite the root
  • 29.
    root at anotherposition Unrooted tree Rooted tree Note that in this rooted tree, taxon A is most closely related to taxon B, and together they are equally distantly related to taxa C and D.
  • 30.
    There are twomajor ways to root trees • By outgroup: • Uses taxa (the “outgroup”) that are known to fall outside of the group of interest (the “ingroup”). • Requires some prior knowledge about the relationships among the taxa. The outgroup can either be species • (e.g., birds to root a mammalian tree) or previous gene duplicates (e.g., α- globins to root β-globins).
  • 31.
    • By midpointor distance: Roots the tree at the midway point between the two most distant taxa in the tree, as determined by branch lengths. • Assumes that the taxa are evolving in a clock-like manner. • This assumption is built into some of the distance- based tree building methods.
  • 32.
    Computational methods forfinding optimal trees • Exact algorithms • "Guarantee" to find the optimal or "best" tree for the method of choice. Two types used in tree building: • Exhaustive search: Evaluates all possible unrooted trees, choosing the one with the best score for the method. • Branch-and-bound search: Eliminates the parts of the search tree that only contain suboptimal solutions. • Heuristic algorithms • Approximate or “quick-and- dirty” methods that attempt to find the optimal tree for the method of choice, but cannot guarantee to do so. • Heuristic searches often operate by “hill-climbing” methods.
  • 33.
    Heuristic search algorithmsare input order dependent and can get stuck in local minima or maxima Rerunning heuristic searches using different input orders of taxa can help find global minima or maxima
  • 34.
  • 35.
    Dot Matrix • Adot plot is a visual representation of the similarities between two sequences. • One sequence (A) is listed across the top of the matrix and the other (B) is listed down the left side • Starting from the first character in B, one moves across the page keeping in the first row and placing a dot in many column where the character in A is the same • The process is continued until all possible comparisons between A and B are made • Any region of similarity is revealed by a diagonal row of dots • Isolated dots not on diagonal represent random matches
  • 37.
    Dot plot interpretation Seq1:ATGATAT Seq2: ATGATAT
  • 38.
    Bioinformatic Softwares fordot plot analysis • LALIGN • DOTLET • DOTMATCHER • SIM
  • 39.
    FACTORS COMPUTED BYTHE SOFTWARES • Gap open penalty • Pairwise alignment score for the first residue in a gap. • Default value is: -12 • Gap Extend Penalty • Pairwise alignment score for each additional residue in a gap • Default value is: -2 • Expectation Threshold • Limits the number of scores and alignments reported based on the expectation value. • This is the maximum number of times the match is expected to occur by chance
  • 40.
  • 41.
  • 42.
  • 43.
  • 44.
    Inverted repeat • Aninverted repeat is sequence of nucleotides followed downstream by its reverse complement. • Inverted repeat: abcdeedcbafghijklmno
  • 45.
    Palindromic Sequence • Apalindromic sequence is a nucleic acid sequence (DNA or RNA) that is same whether read 5' to 3' on one strand or 5' to 3' on the complementary strand with which it forms a double helix.