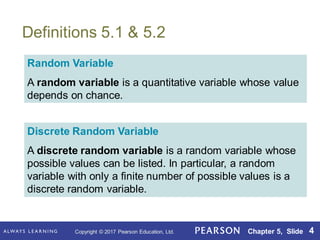
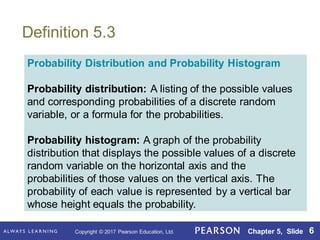
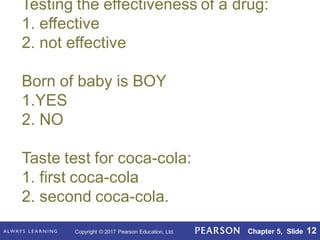
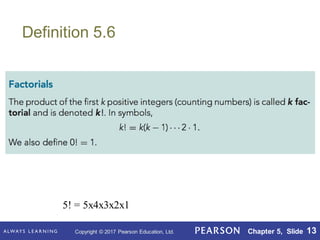
Copyright © 2017 Pearson Education, Ltd. Chapter 5, Slide 1
Chapter 5
Discrete Random
Variables
Copyright © 2017 Pearson Education, Ltd. Chapter 5, Slide 1
Copyright © 2017 Pearson Education, Ltd. Chapter 5, Slide 2
Chapter 5
Discrete Random Variables
Copyright © 2017 Pearson Education, Ltd. Chapter 5, Slide 3
Section 5.1
Discrete Random Variables
and Probability Distributions
Copyright © 2017 Pearson Education, Ltd. Chapter 5, Slide 4
Definitions 5.1 & 5.2
Random Variable
A random variable is a quantitative variable whose value
depends on chance.
Discrete Random Variable
A discrete random variable is a random variable whose
possible values can be listed. In particular, a random
variable with only a finite number of possible values is a
discrete random variable.
Copyright © 2017 Pearson Education, Ltd. Chapter 5, Slide 5
{X = 4}
X = number of siblings of a randomly selected
student.
P(X=4)
Copyright © 2017 Pearson Education, Ltd. Chapter 5, Slide 6
Definition 5.3
Probability Distribution and Probability Histogram
Probability distribution: A listing of the possible values
and corresponding probabilities of a discrete random
variable, or a formula for the probabilities.
Probability histogram: A graph of the probability
distribution that displays the possible values of a discrete
random variable on the horizontal axis and the
probabilities of those values on the vertical axis. The
probability of each value is represented by a vertical bar
whose height equals the probability.
Copyright © 2017 Pearson Education, Ltd. Chapter 5, Slide 7
Table 5.2 & Figure 5.1
Probability distribution of the
random variable X, the number
of siblings of a randomly
selected student
Probability histogram for the random
variable X, the number of siblings of
a randomly selected student
Copyright © 2017 Pearson Education, Ltd. Chapter 5, Slide 8
Key Fact 5.1
Copyright © 2017 Pearson Education, Ltd. Chapter 5, Slide 9
Key Fact 5.2
Interpretation of a Probability Distribution
In a large number of independent observations of a random
variable X, the proportion of times each possible value occurs
will approximate the probability distribution of X; or,
equivalently, the proportion histogram will approximate the
probability histogram for X.
Copyright © 2017 Pearson Education, Ltd. Chapter 5, Slide 10
Figure 5.2
(a) Histogramof proportions for the numbers of heads obtained in three tosses of
a balanced dime for 1000 observations; (b) probability histogram for the number
of heads obtained in three tosses of a balanced dime
Copyright © 2017 Pearson Education, Ltd. Chapter 5, Slide 11
Section 5.3
The Binomial Distribution
Copyright © 2017 Pearson Education, Ltd. Chapter 5, Slide 12
Testing the effectiveness of a drug:
1. effective
2. not effective
Born of baby is BOY
1.YES
2. NO
Taste test for coca-cola:
1. first coca-cola
2. second coca-cola.
Copyright © 2017 Pearson Education, Ltd. Chapter 5, Slide 13
Definition 5.6
5! = 5x4x3x2x1
Copyright © 2017 Pearson Education, Ltd. Chapter 5, Slide 14
Definition 5.7
(a+b)n
Copyright © 2017 Pearson Education, Ltd. Chapter 5, Slide 15
Section 5.4
The Poisson Distribution
Copyright © 2017 Pearson Education, Ltd. Chapter 5, Slide 16
Formula 5.3
Copyright © 2017 Pearson Education, Ltd. Chapter 5, Slide 17
ƛ = 6.9
P(X≤2) = P(X=0)+P(X=1)+P(X=2) = 0.032
e(2.718) -6.9 (6.9)0
0!

Discrete Random Variables.pdf

  • 1.
    Copyright © 2017Pearson Education, Ltd. Chapter 5, Slide 1 Chapter 5 Discrete Random Variables Copyright © 2017 Pearson Education, Ltd. Chapter 5, Slide 1
  • 2.
    Copyright © 2017Pearson Education, Ltd. Chapter 5, Slide 2 Chapter 5 Discrete Random Variables
  • 3.
    Copyright © 2017Pearson Education, Ltd. Chapter 5, Slide 3 Section 5.1 Discrete Random Variables and Probability Distributions
  • 4.
    Copyright © 2017Pearson Education, Ltd. Chapter 5, Slide 4 Definitions 5.1 & 5.2 Random Variable A random variable is a quantitative variable whose value depends on chance. Discrete Random Variable A discrete random variable is a random variable whose possible values can be listed. In particular, a random variable with only a finite number of possible values is a discrete random variable.
  • 5.
    Copyright © 2017Pearson Education, Ltd. Chapter 5, Slide 5 {X = 4} X = number of siblings of a randomly selected student. P(X=4)
  • 6.
    Copyright © 2017Pearson Education, Ltd. Chapter 5, Slide 6 Definition 5.3 Probability Distribution and Probability Histogram Probability distribution: A listing of the possible values and corresponding probabilities of a discrete random variable, or a formula for the probabilities. Probability histogram: A graph of the probability distribution that displays the possible values of a discrete random variable on the horizontal axis and the probabilities of those values on the vertical axis. The probability of each value is represented by a vertical bar whose height equals the probability.
  • 7.
    Copyright © 2017Pearson Education, Ltd. Chapter 5, Slide 7 Table 5.2 & Figure 5.1 Probability distribution of the random variable X, the number of siblings of a randomly selected student Probability histogram for the random variable X, the number of siblings of a randomly selected student
  • 8.
    Copyright © 2017Pearson Education, Ltd. Chapter 5, Slide 8 Key Fact 5.1
  • 9.
    Copyright © 2017Pearson Education, Ltd. Chapter 5, Slide 9 Key Fact 5.2 Interpretation of a Probability Distribution In a large number of independent observations of a random variable X, the proportion of times each possible value occurs will approximate the probability distribution of X; or, equivalently, the proportion histogram will approximate the probability histogram for X.
  • 10.
    Copyright © 2017Pearson Education, Ltd. Chapter 5, Slide 10 Figure 5.2 (a) Histogramof proportions for the numbers of heads obtained in three tosses of a balanced dime for 1000 observations; (b) probability histogram for the number of heads obtained in three tosses of a balanced dime
  • 11.
    Copyright © 2017Pearson Education, Ltd. Chapter 5, Slide 11 Section 5.3 The Binomial Distribution
  • 12.
    Copyright © 2017Pearson Education, Ltd. Chapter 5, Slide 12 Testing the effectiveness of a drug: 1. effective 2. not effective Born of baby is BOY 1.YES 2. NO Taste test for coca-cola: 1. first coca-cola 2. second coca-cola.
  • 13.
    Copyright © 2017Pearson Education, Ltd. Chapter 5, Slide 13 Definition 5.6 5! = 5x4x3x2x1
  • 14.
    Copyright © 2017Pearson Education, Ltd. Chapter 5, Slide 14 Definition 5.7 (a+b)n
  • 15.
    Copyright © 2017Pearson Education, Ltd. Chapter 5, Slide 15 Section 5.4 The Poisson Distribution
  • 16.
    Copyright © 2017Pearson Education, Ltd. Chapter 5, Slide 16 Formula 5.3
  • 17.
    Copyright © 2017Pearson Education, Ltd. Chapter 5, Slide 17 ƛ = 6.9 P(X≤2) = P(X=0)+P(X=1)+P(X=2) = 0.032 e(2.718) -6.9 (6.9)0 0!