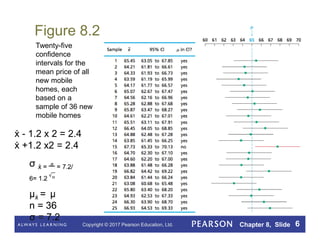
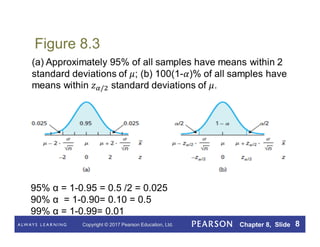
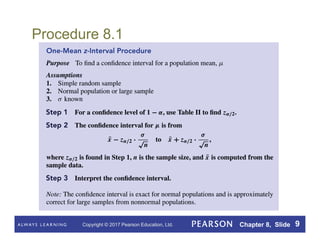
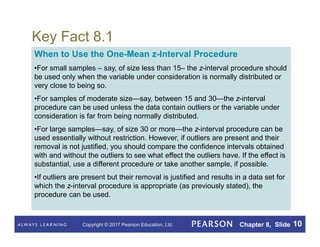
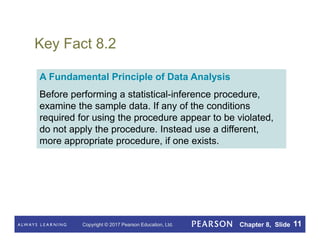
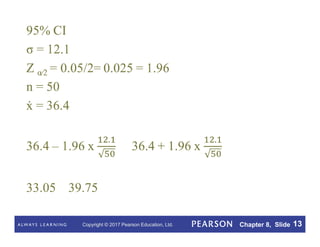
Copyright © 2017 Pearson Education, Ltd. Chapter 8, Slide 1
Chapter 8
Confidence
Intervals for One
Population Mean
Copyright © 2017 Pearson Education, Ltd. Chapter 8, Slide 1
Copyright © 2017 Pearson Education, Ltd. Chapter 8, Slide 2
Chapter 8
Confidence Intervals for One
Population Mean
Copyright © 2017 Pearson Education, Ltd. Chapter 8, Slide 3
Section 8.1
Estimating a Population Mean
Copyright © 2017 Pearson Education, Ltd. Chapter 8, Slide 4
Definition 8.1
Point Estimate
A point estimate of a parameter is the value of a
statistic used to estimate the parameter.
Copyright © 2017 Pearson Education, Ltd. Chapter 8, Slide 5
Definition 8.2
Confidence-Interval Estimate
Confidence interval (CI): An interval of numbers
obtained from a point estimate of a parameter.
Confidence level: The confidence we have that the
parameter lies in the confidence interval (i.e., that the
confidence interval contains the parameter).
Confidence-interval estimate: The confidence level
and confidence interval.
Copyright © 2017 Pearson Education, Ltd. Chapter 8, Slide 6
Figure 8.2
Twenty-five
confidence
intervals for the
mean price of all
new mobile
homes, each
based on a
sample of 36 new
mobile homes
ẋ - 1.2 x 2 = 2.4
ẋ +1.2 x2 = 2.4
Copyright © 2017 Pearson Education, Ltd. Chapter 8, Slide 7
Copyright © 2017 Pearson Education, Ltd. Chapter 8, Slide 8
Figure 8.3
95% α = 1-0.95 = 0.5 /2 = 0.025
90% α = 1-0.90= 0.10 = 0.5
99% α = 1-0.99= 0.01
0.5
Copyright © 2017 Pearson Education, Ltd. Chapter 8, Slide 9
Procedure 8.1
Copyright © 2017 Pearson Education, Ltd. Chapter 8, Slide 10
Key Fact 8.1
When to Use the One-Mean z-Interval Procedure
•For small samples – say, of size less than 15– the z-interval procedure should
be used only when the variable under consideration is normally distributed or
very close to being so.
•For samples of moderate size—say, between 15 and 30—the z-interval
procedure can be used unless the data contain outliers or the variable under
consideration is far from being normally distributed.
•For large samples—say, of size 30 or more—the z-interval procedure can be
used essentially without restriction. However, if outliers are present and their
removal is not justified, you should compare the confidence intervals obtained
with and without the outliers to see what effect the outliers have. If the effect is
substantial, use a different procedure or take another sample, if possible.
•If outliers are present but their removal is justified and results in a data set for
which the z-interval procedure is appropriate (as previously stated), the
procedure can be used.
Copyright © 2017 Pearson Education, Ltd. Chapter 8, Slide 11
Key Fact 8.2
A Fundamental Principle of Data Analysis
Before performing a statistical-inference procedure,
examine the sample data. If any of the conditions
required for using the procedure appear to be violated,
do not apply the procedure. Instead use a different,
more appropriate procedure, if one exists.
Copyright © 2017 Pearson Education, Ltd. Chapter 8, Slide 12
Table 8.4
Ages, in years, of 50
randomly selected people
in the civilian labor force
Copyright © 2017 Pearson Education, Ltd. Chapter 8, Slide 13

confidence intervals for one popular mean.pdf

  • 1.
    Copyright © 2017Pearson Education, Ltd. Chapter 8, Slide 1 Chapter 8 Confidence Intervals for One Population Mean Copyright © 2017 Pearson Education, Ltd. Chapter 8, Slide 1
  • 2.
    Copyright © 2017Pearson Education, Ltd. Chapter 8, Slide 2 Chapter 8 Confidence Intervals for One Population Mean
  • 3.
    Copyright © 2017Pearson Education, Ltd. Chapter 8, Slide 3 Section 8.1 Estimating a Population Mean
  • 4.
    Copyright © 2017Pearson Education, Ltd. Chapter 8, Slide 4 Definition 8.1 Point Estimate A point estimate of a parameter is the value of a statistic used to estimate the parameter.
  • 5.
    Copyright © 2017Pearson Education, Ltd. Chapter 8, Slide 5 Definition 8.2 Confidence-Interval Estimate Confidence interval (CI): An interval of numbers obtained from a point estimate of a parameter. Confidence level: The confidence we have that the parameter lies in the confidence interval (i.e., that the confidence interval contains the parameter). Confidence-interval estimate: The confidence level and confidence interval.
  • 6.
    Copyright © 2017Pearson Education, Ltd. Chapter 8, Slide 6 Figure 8.2 Twenty-five confidence intervals for the mean price of all new mobile homes, each based on a sample of 36 new mobile homes ẋ - 1.2 x 2 = 2.4 ẋ +1.2 x2 = 2.4
  • 7.
    Copyright © 2017Pearson Education, Ltd. Chapter 8, Slide 7
  • 8.
    Copyright © 2017Pearson Education, Ltd. Chapter 8, Slide 8 Figure 8.3 95% α = 1-0.95 = 0.5 /2 = 0.025 90% α = 1-0.90= 0.10 = 0.5 99% α = 1-0.99= 0.01 0.5
  • 9.
    Copyright © 2017Pearson Education, Ltd. Chapter 8, Slide 9 Procedure 8.1
  • 10.
    Copyright © 2017Pearson Education, Ltd. Chapter 8, Slide 10 Key Fact 8.1 When to Use the One-Mean z-Interval Procedure •For small samples – say, of size less than 15– the z-interval procedure should be used only when the variable under consideration is normally distributed or very close to being so. •For samples of moderate size—say, between 15 and 30—the z-interval procedure can be used unless the data contain outliers or the variable under consideration is far from being normally distributed. •For large samples—say, of size 30 or more—the z-interval procedure can be used essentially without restriction. However, if outliers are present and their removal is not justified, you should compare the confidence intervals obtained with and without the outliers to see what effect the outliers have. If the effect is substantial, use a different procedure or take another sample, if possible. •If outliers are present but their removal is justified and results in a data set for which the z-interval procedure is appropriate (as previously stated), the procedure can be used.
  • 11.
    Copyright © 2017Pearson Education, Ltd. Chapter 8, Slide 11 Key Fact 8.2 A Fundamental Principle of Data Analysis Before performing a statistical-inference procedure, examine the sample data. If any of the conditions required for using the procedure appear to be violated, do not apply the procedure. Instead use a different, more appropriate procedure, if one exists.
  • 12.
    Copyright © 2017Pearson Education, Ltd. Chapter 8, Slide 12 Table 8.4 Ages, in years, of 50 randomly selected people in the civilian labor force
  • 13.
    Copyright © 2017Pearson Education, Ltd. Chapter 8, Slide 13