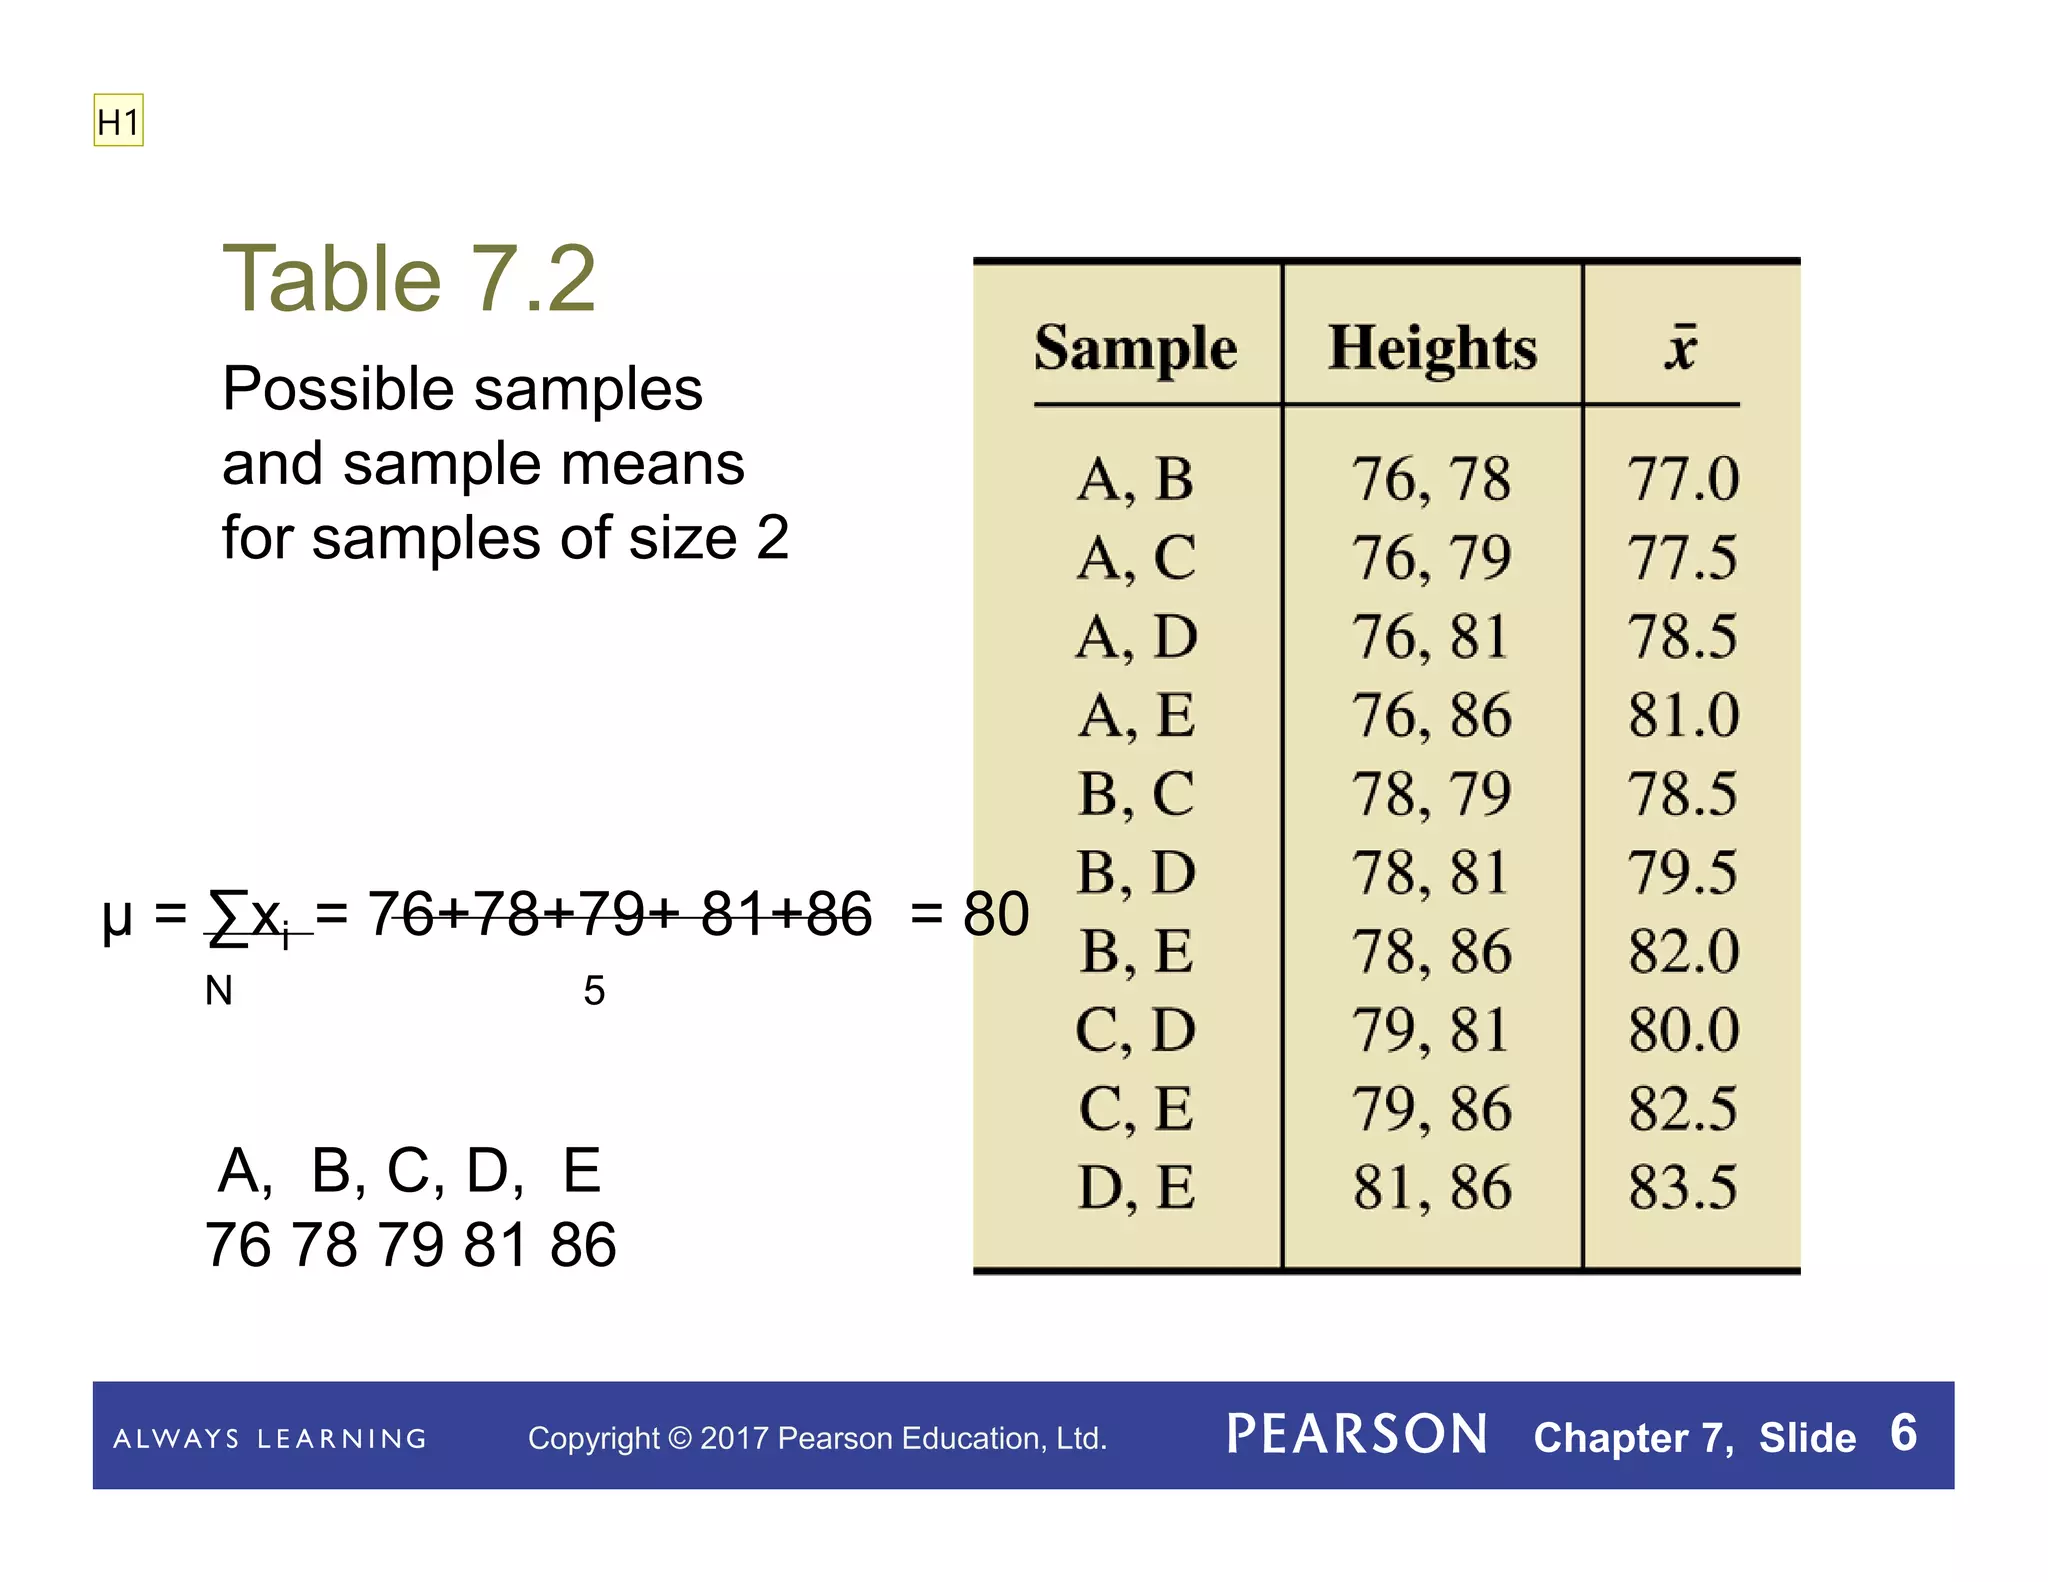
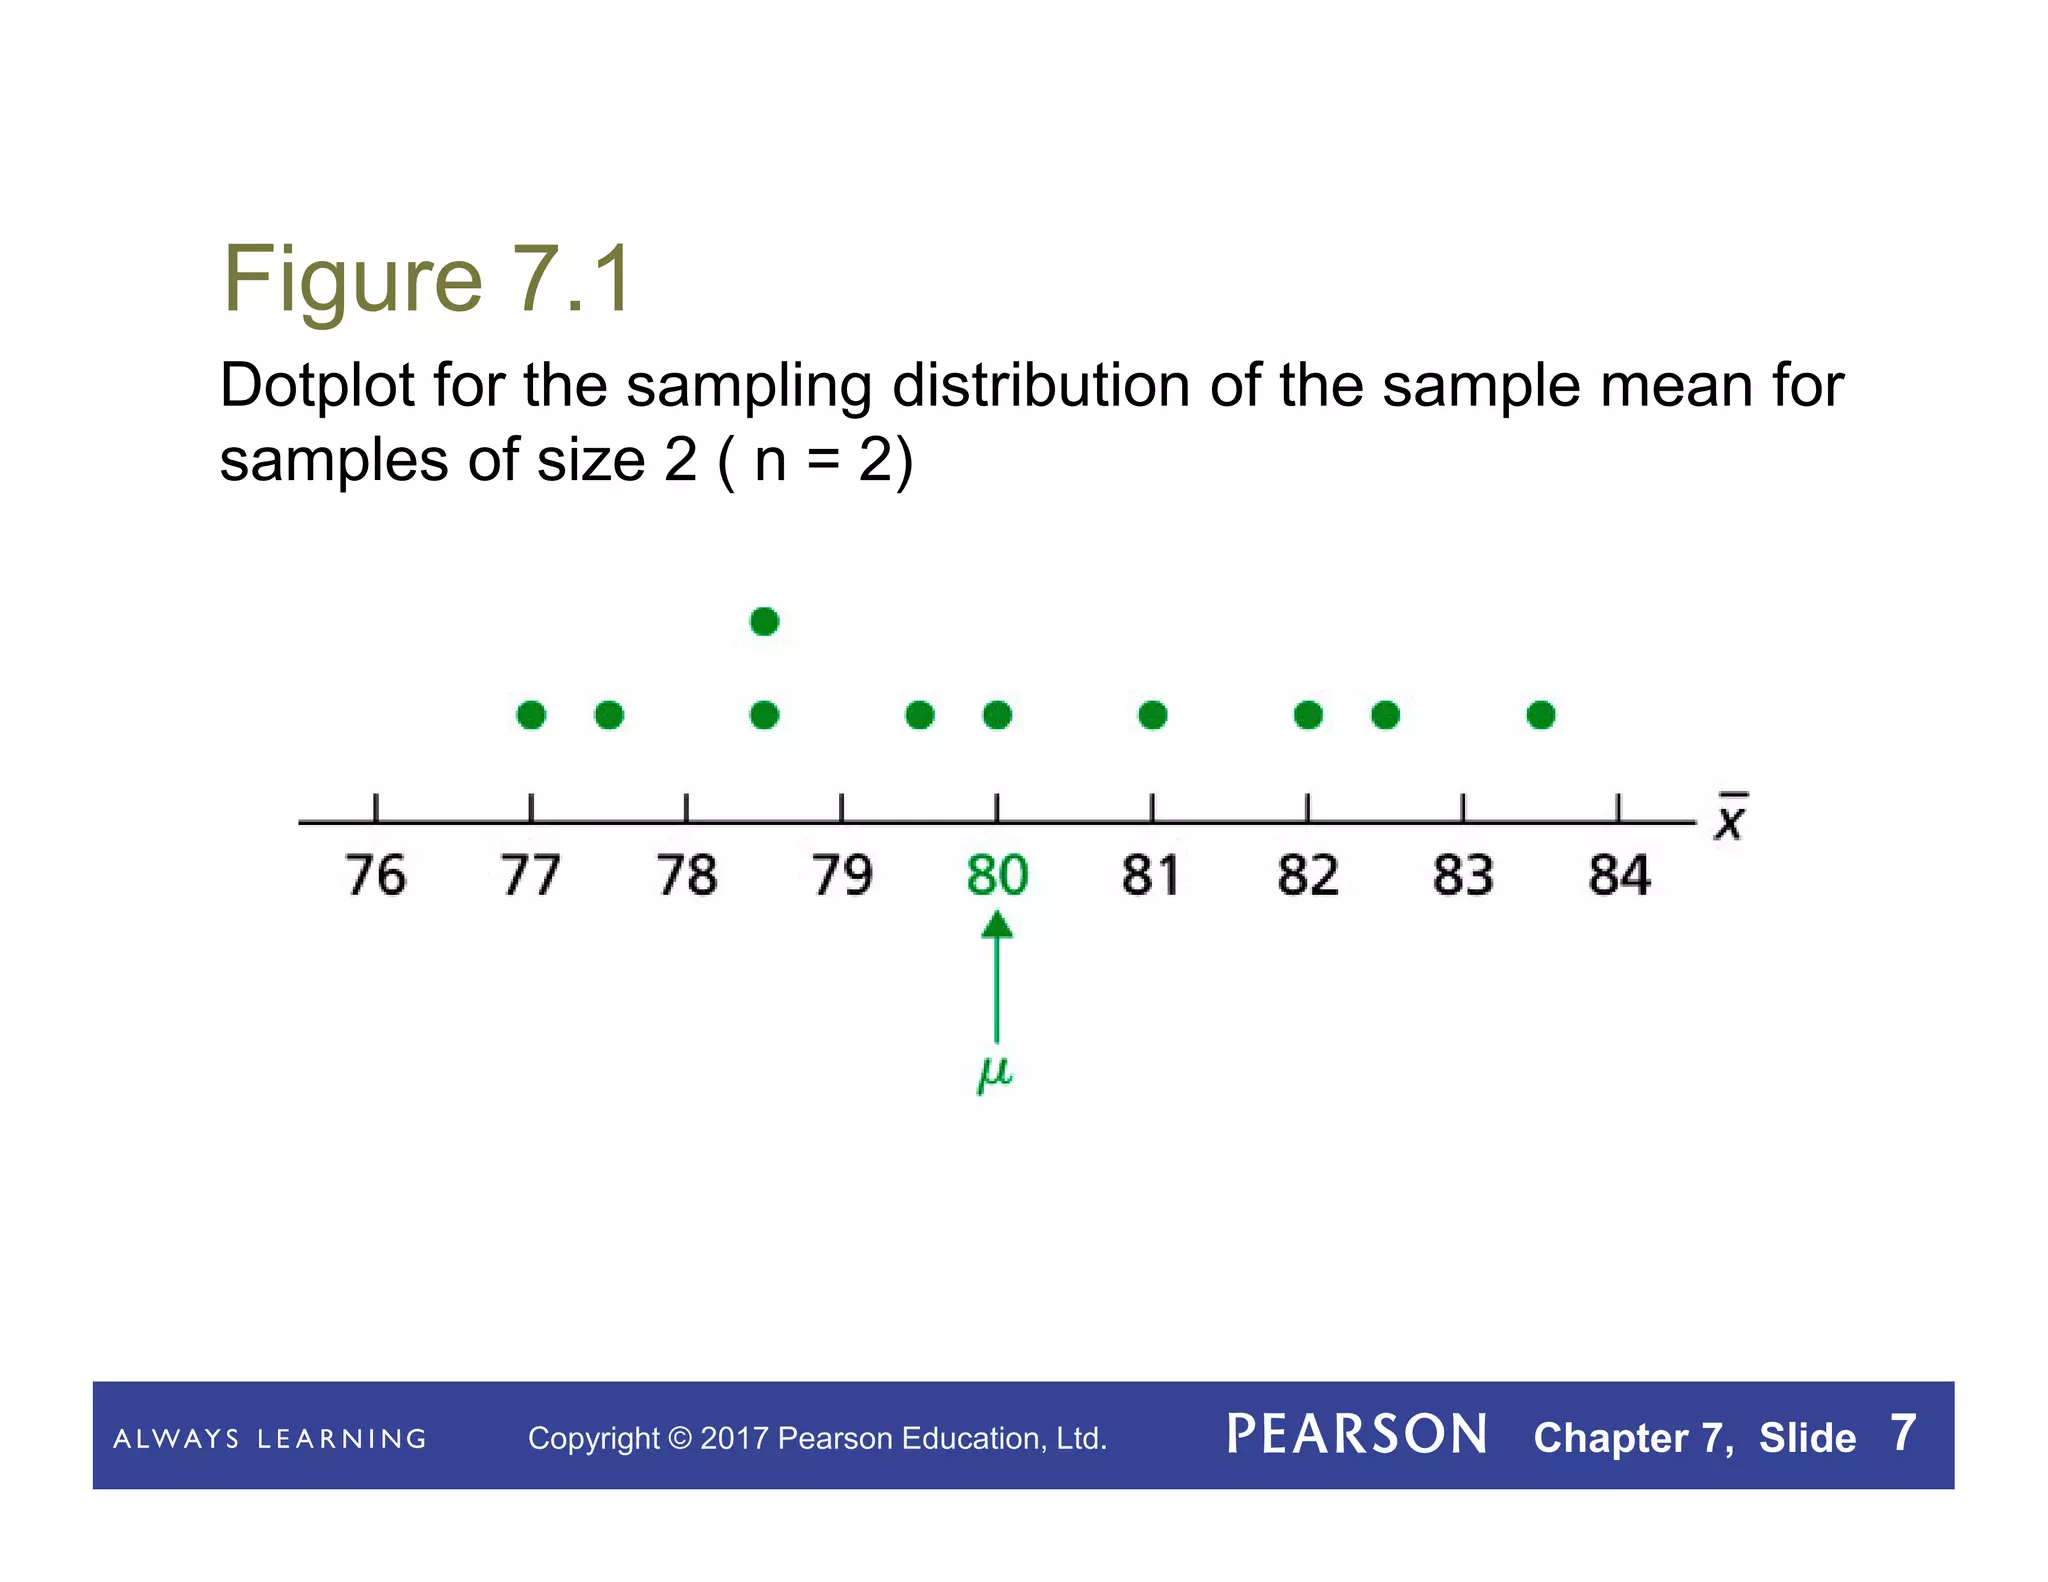
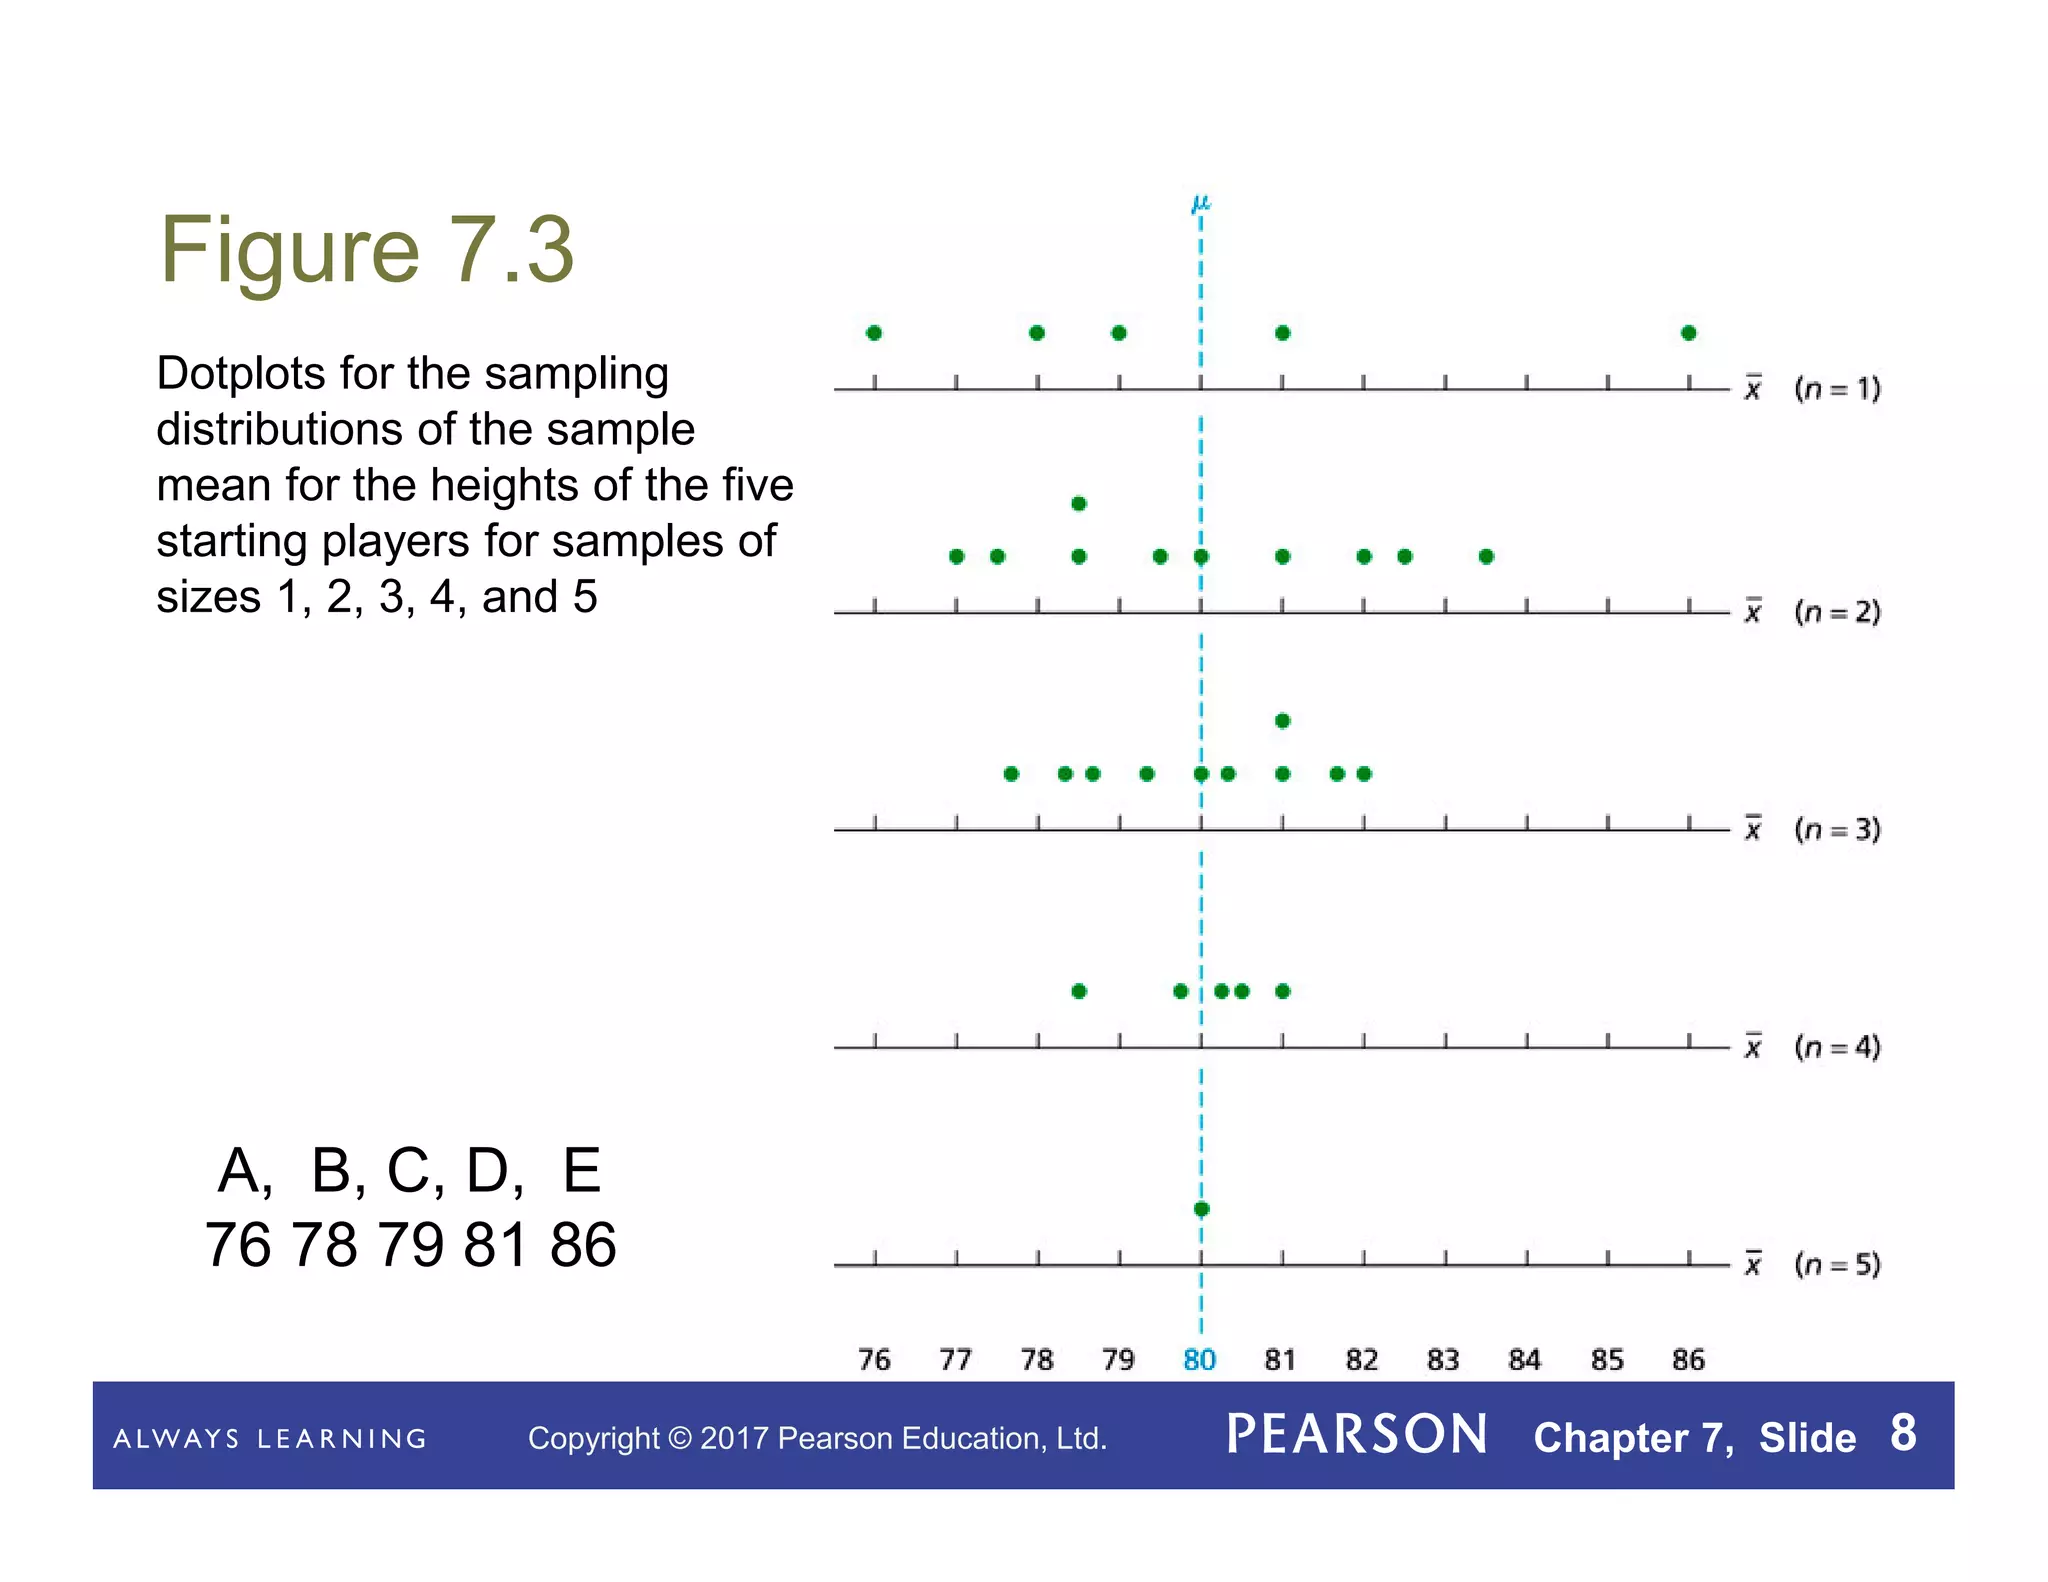
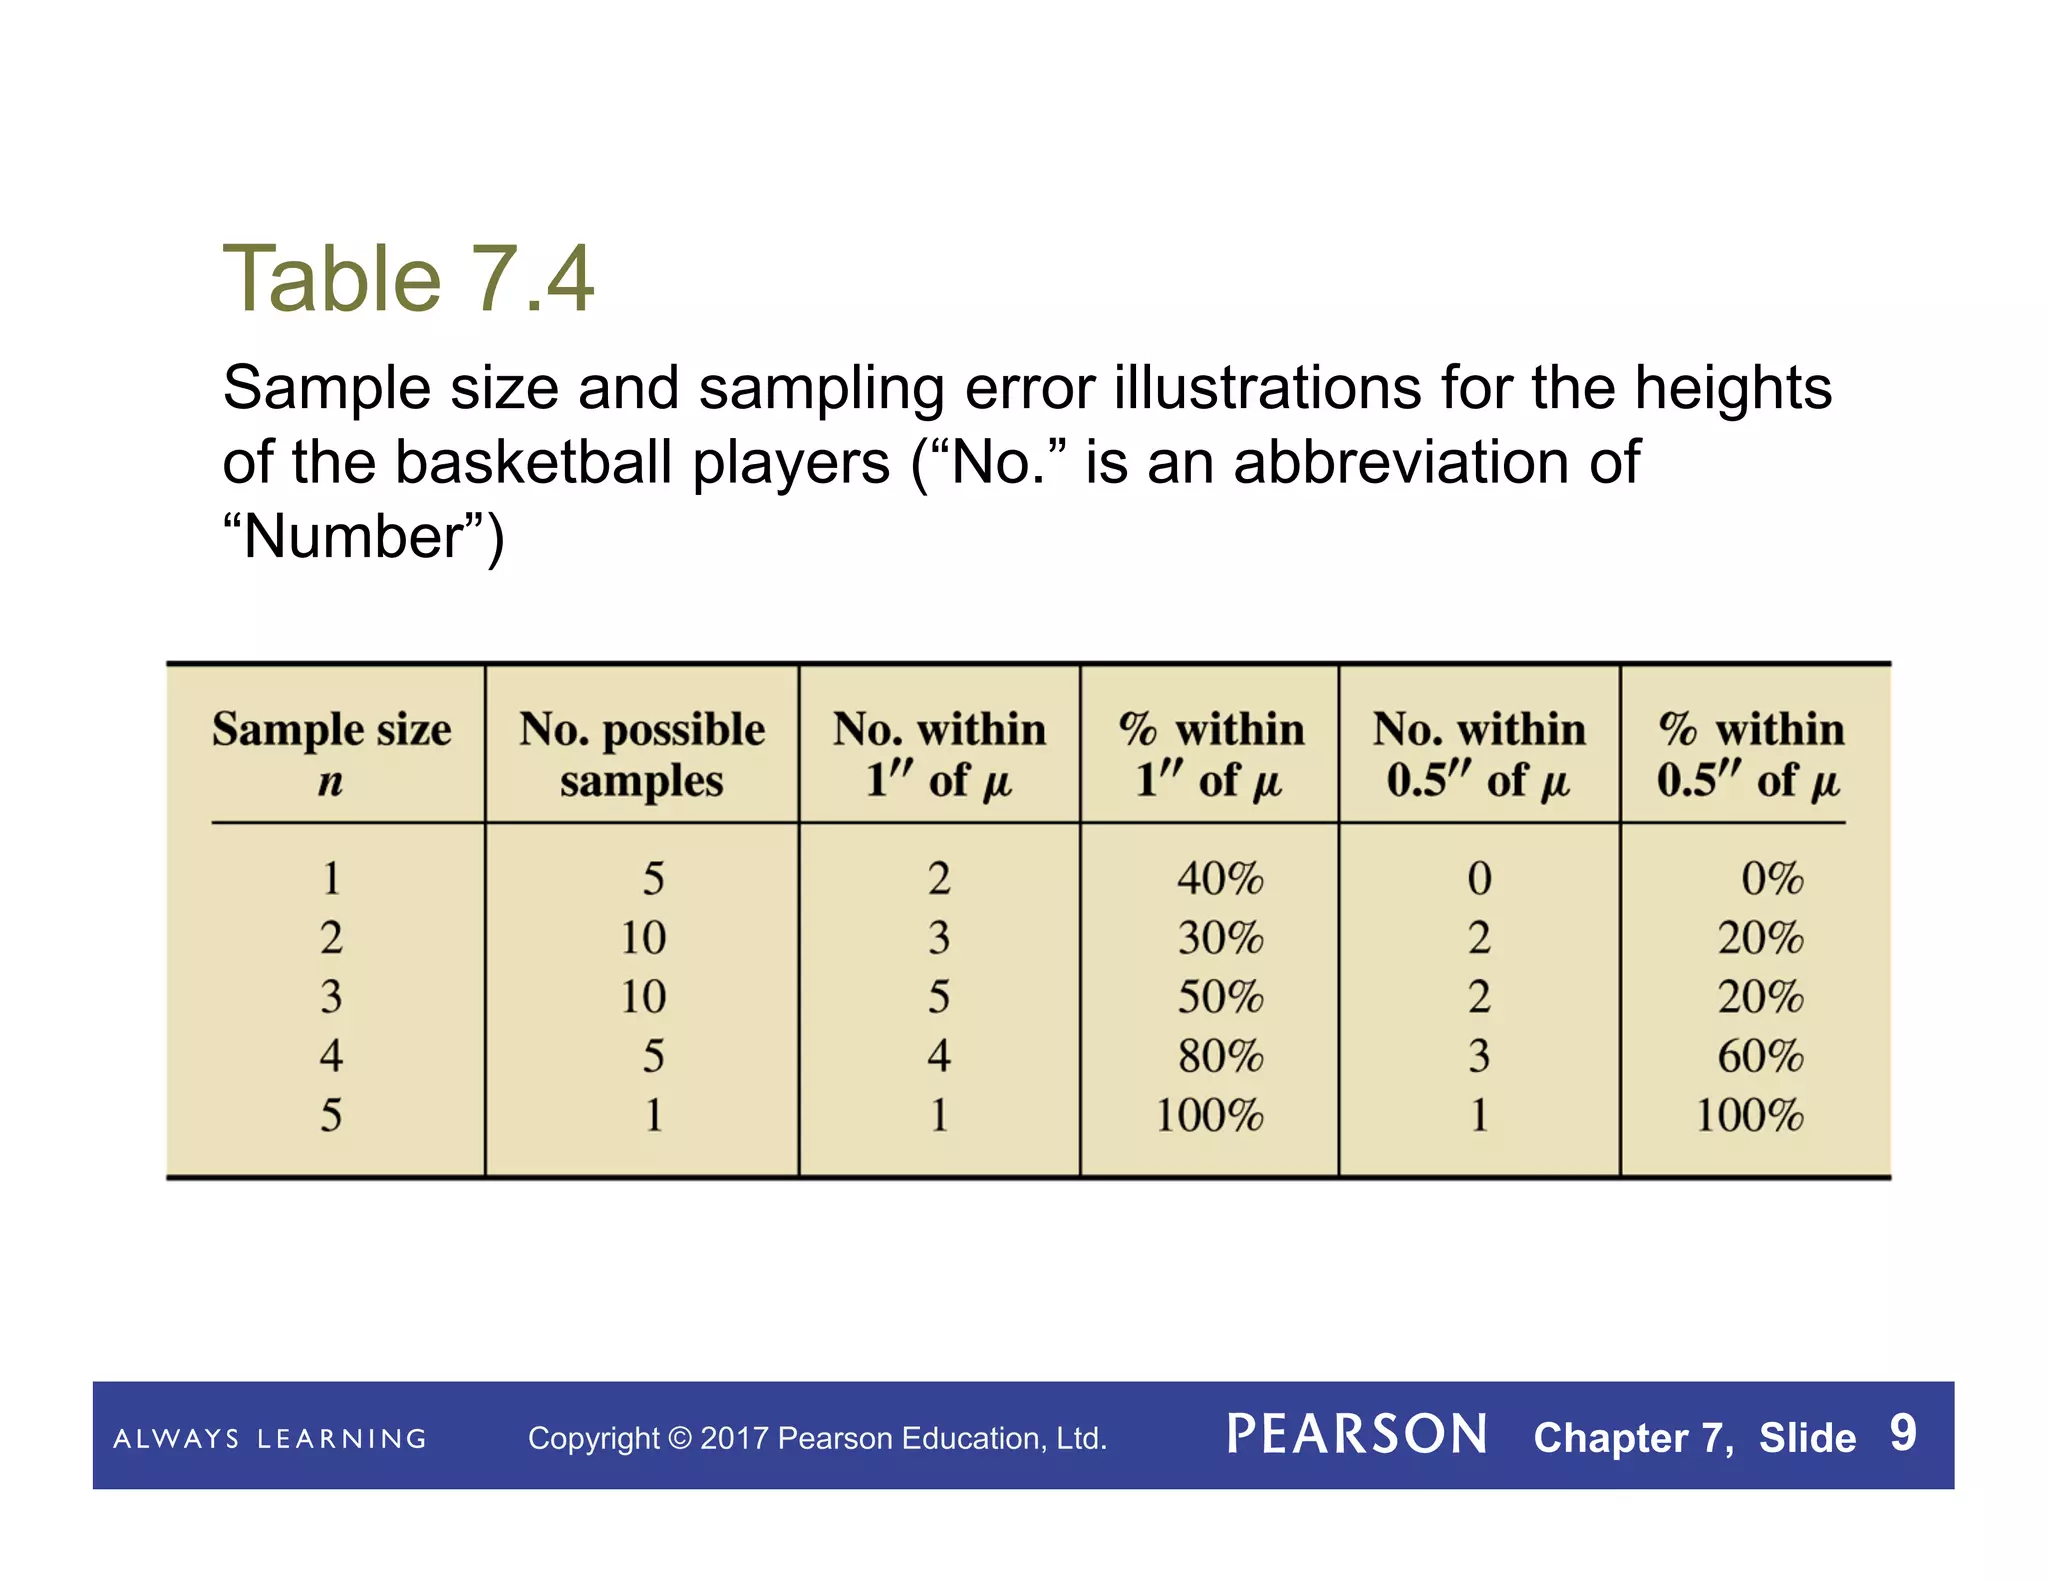
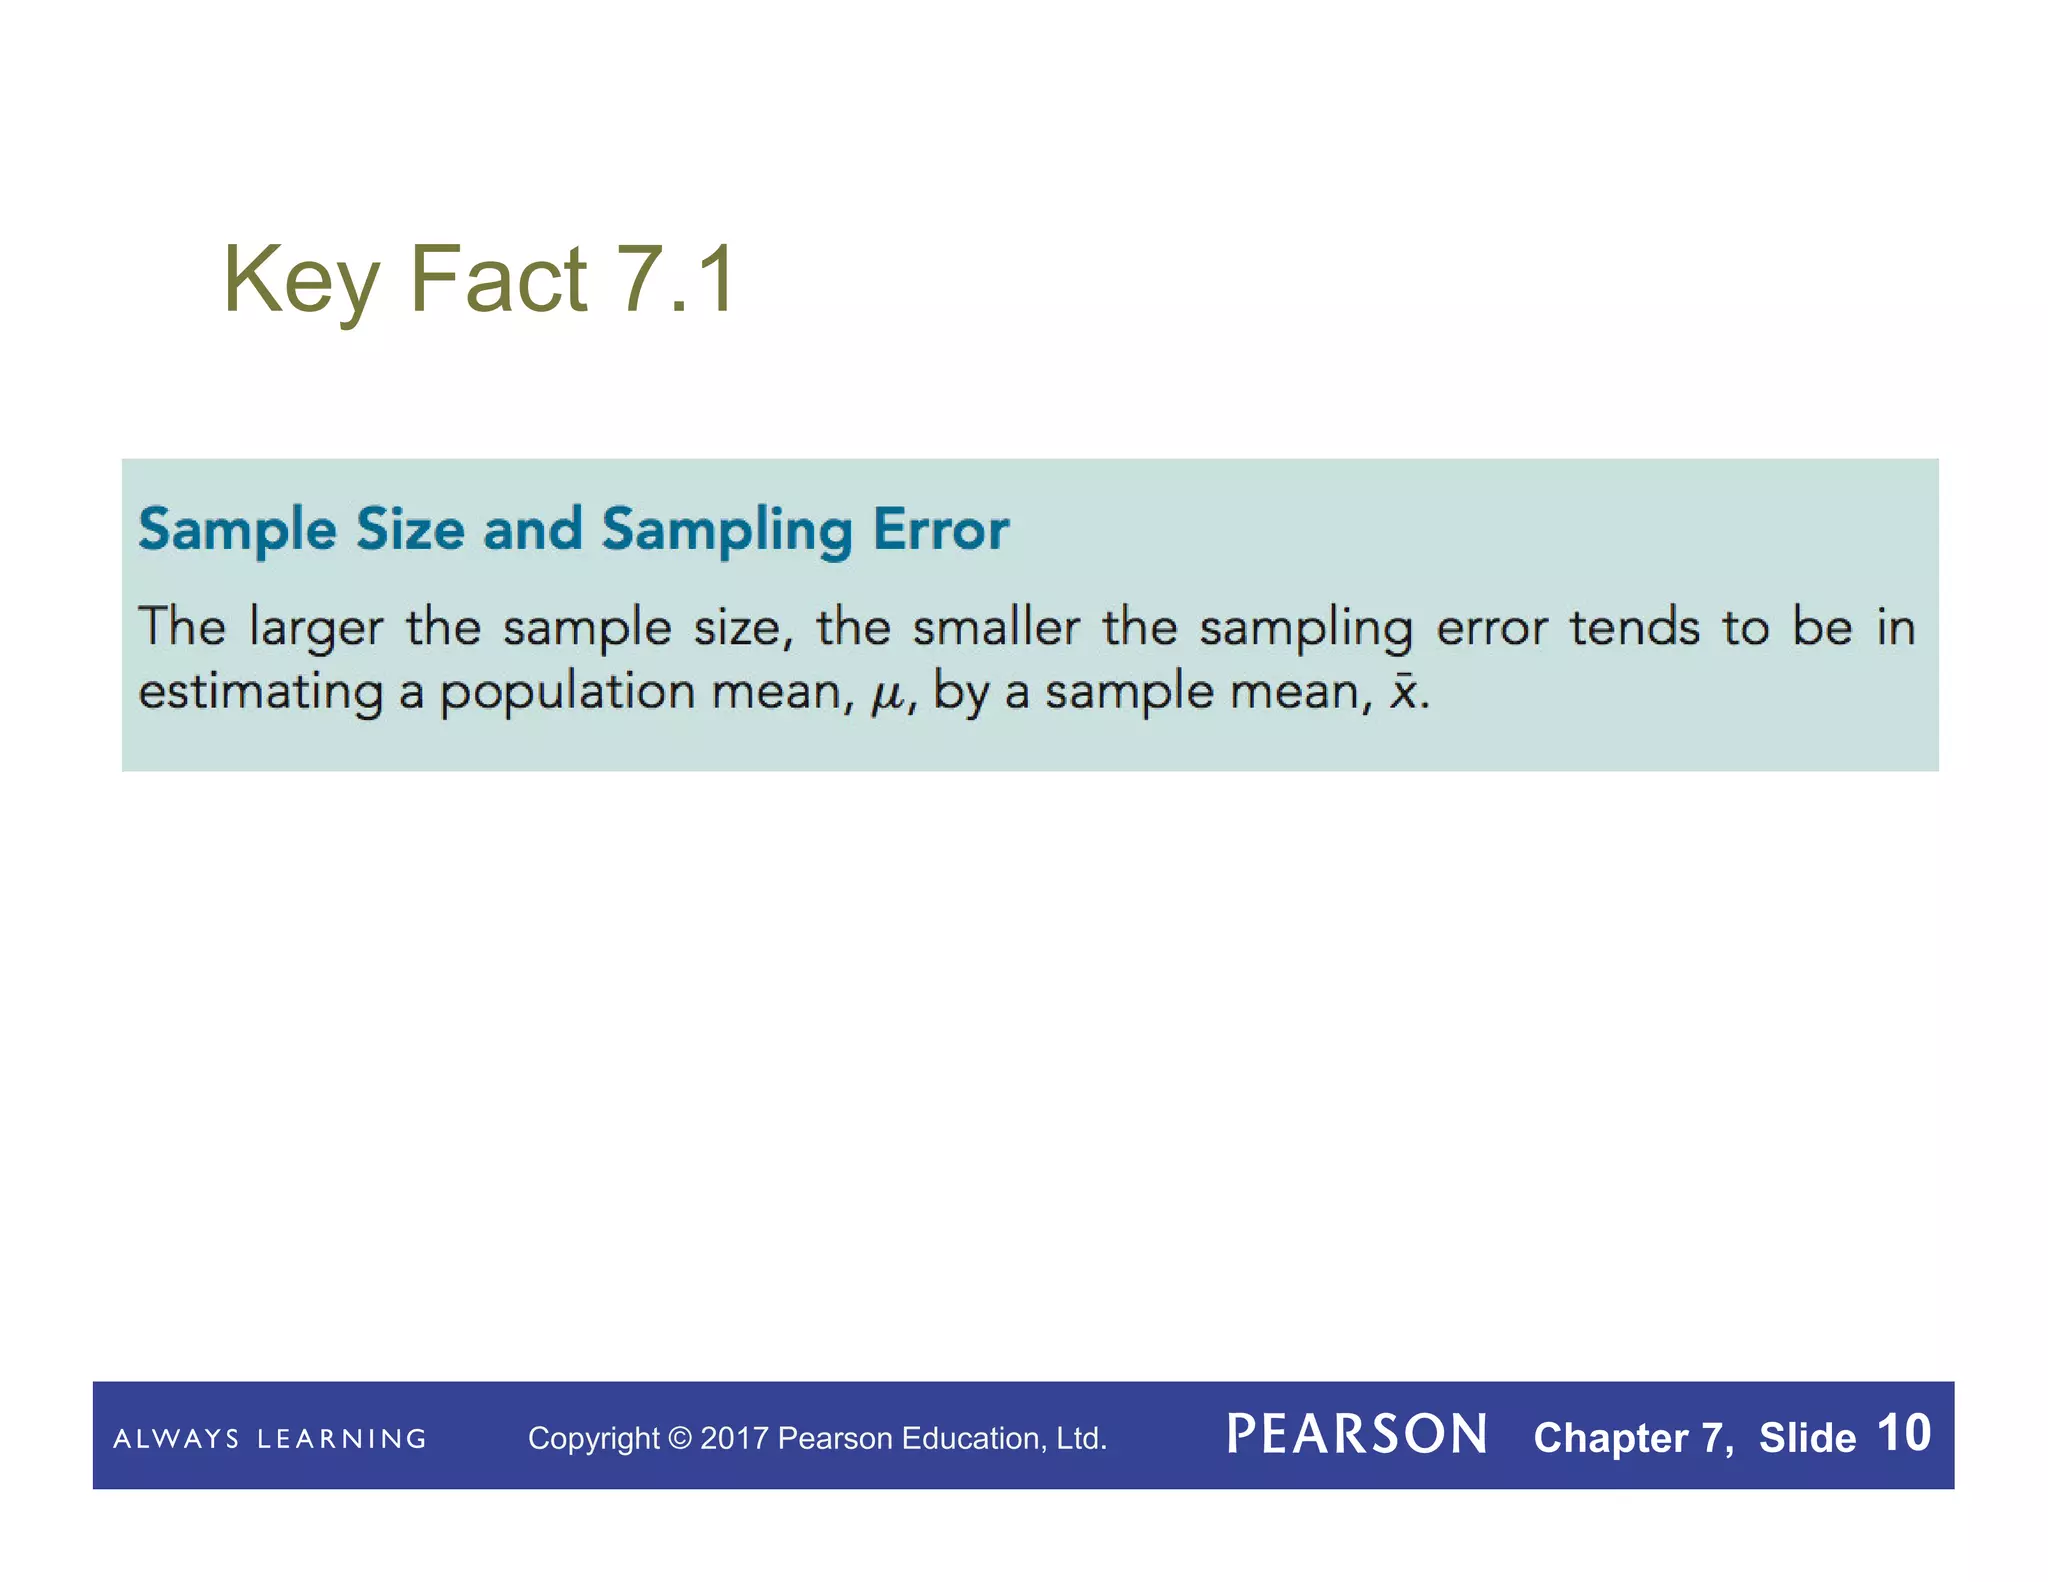
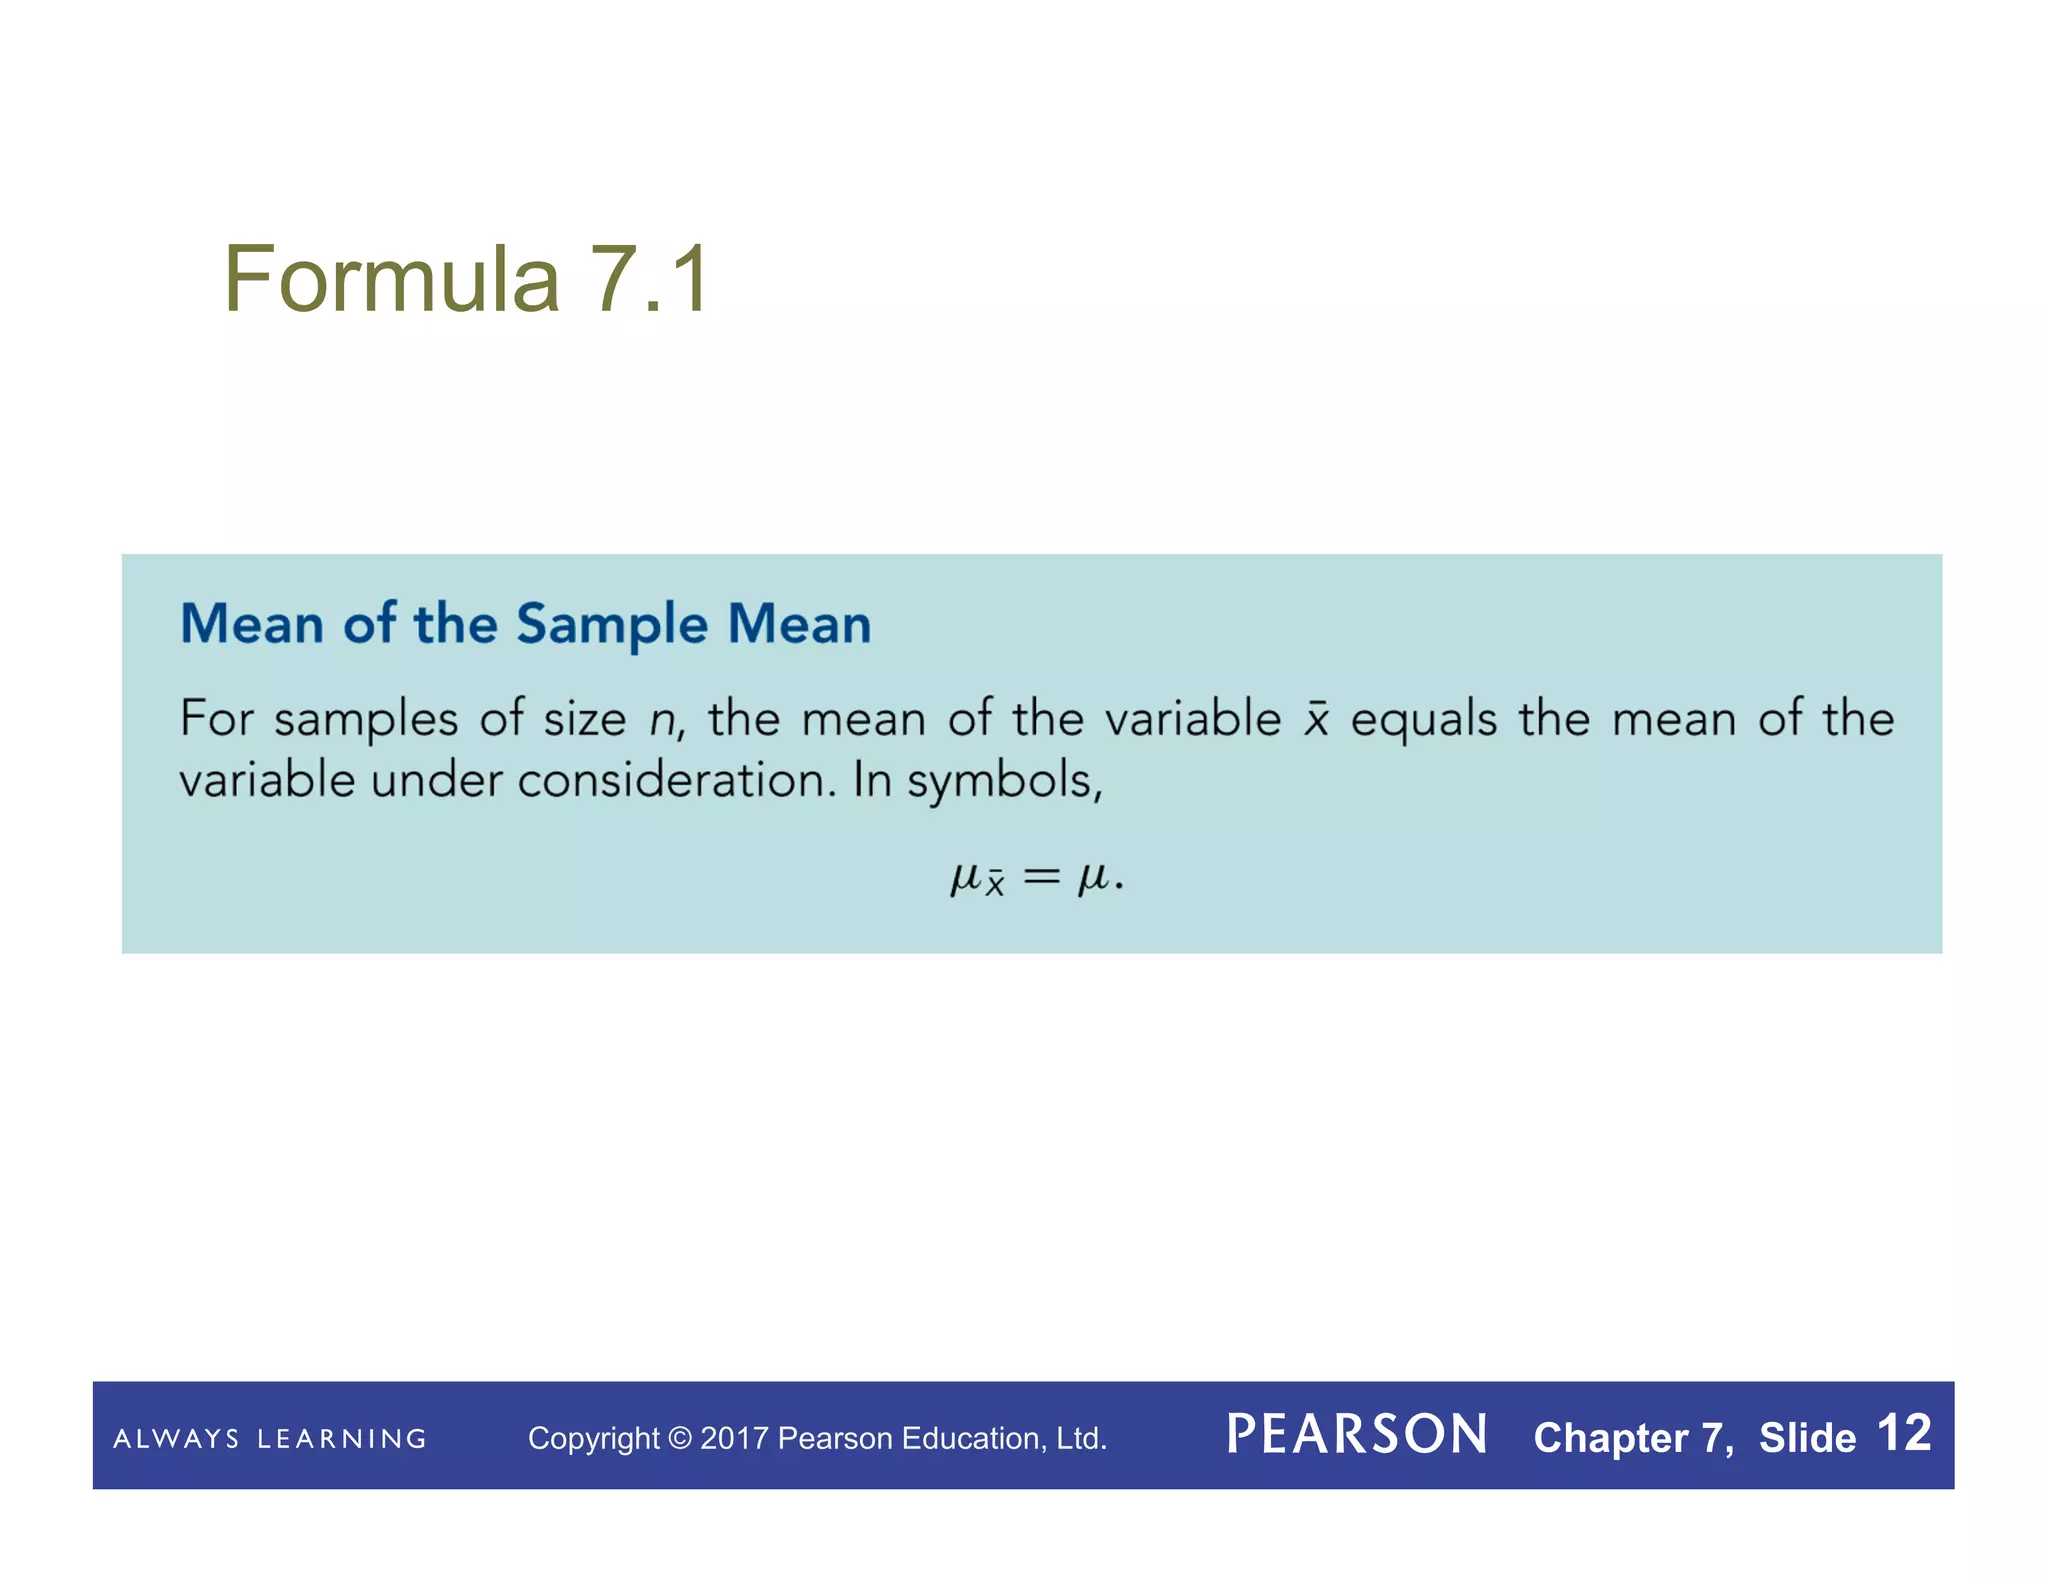
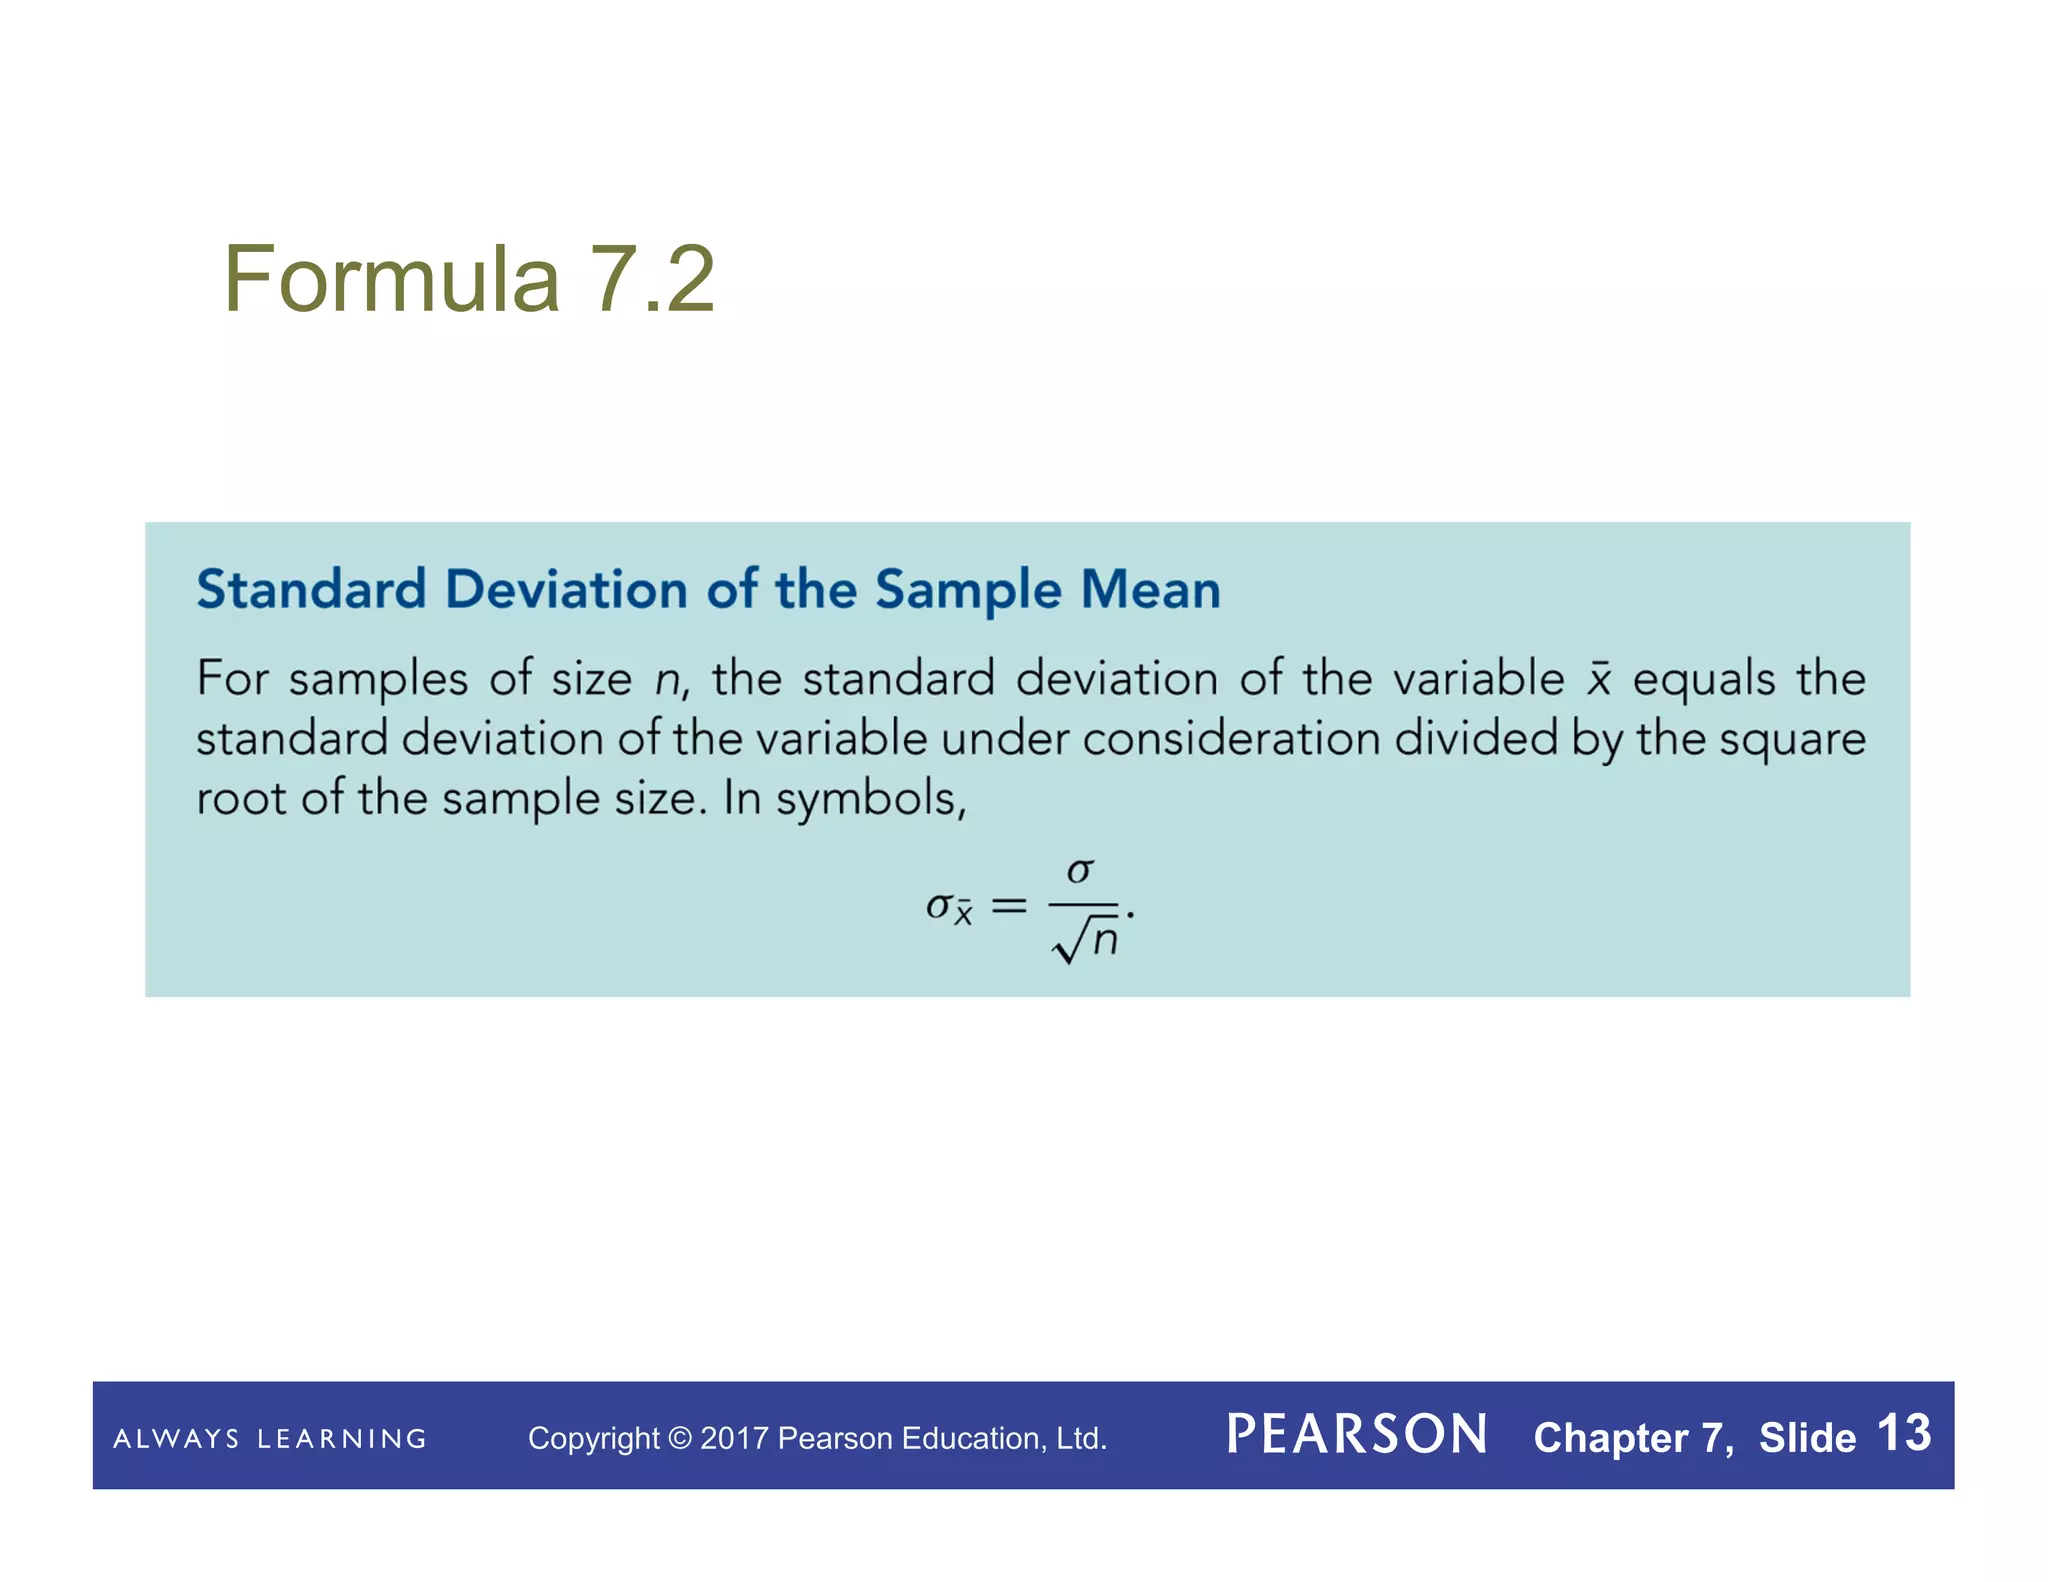
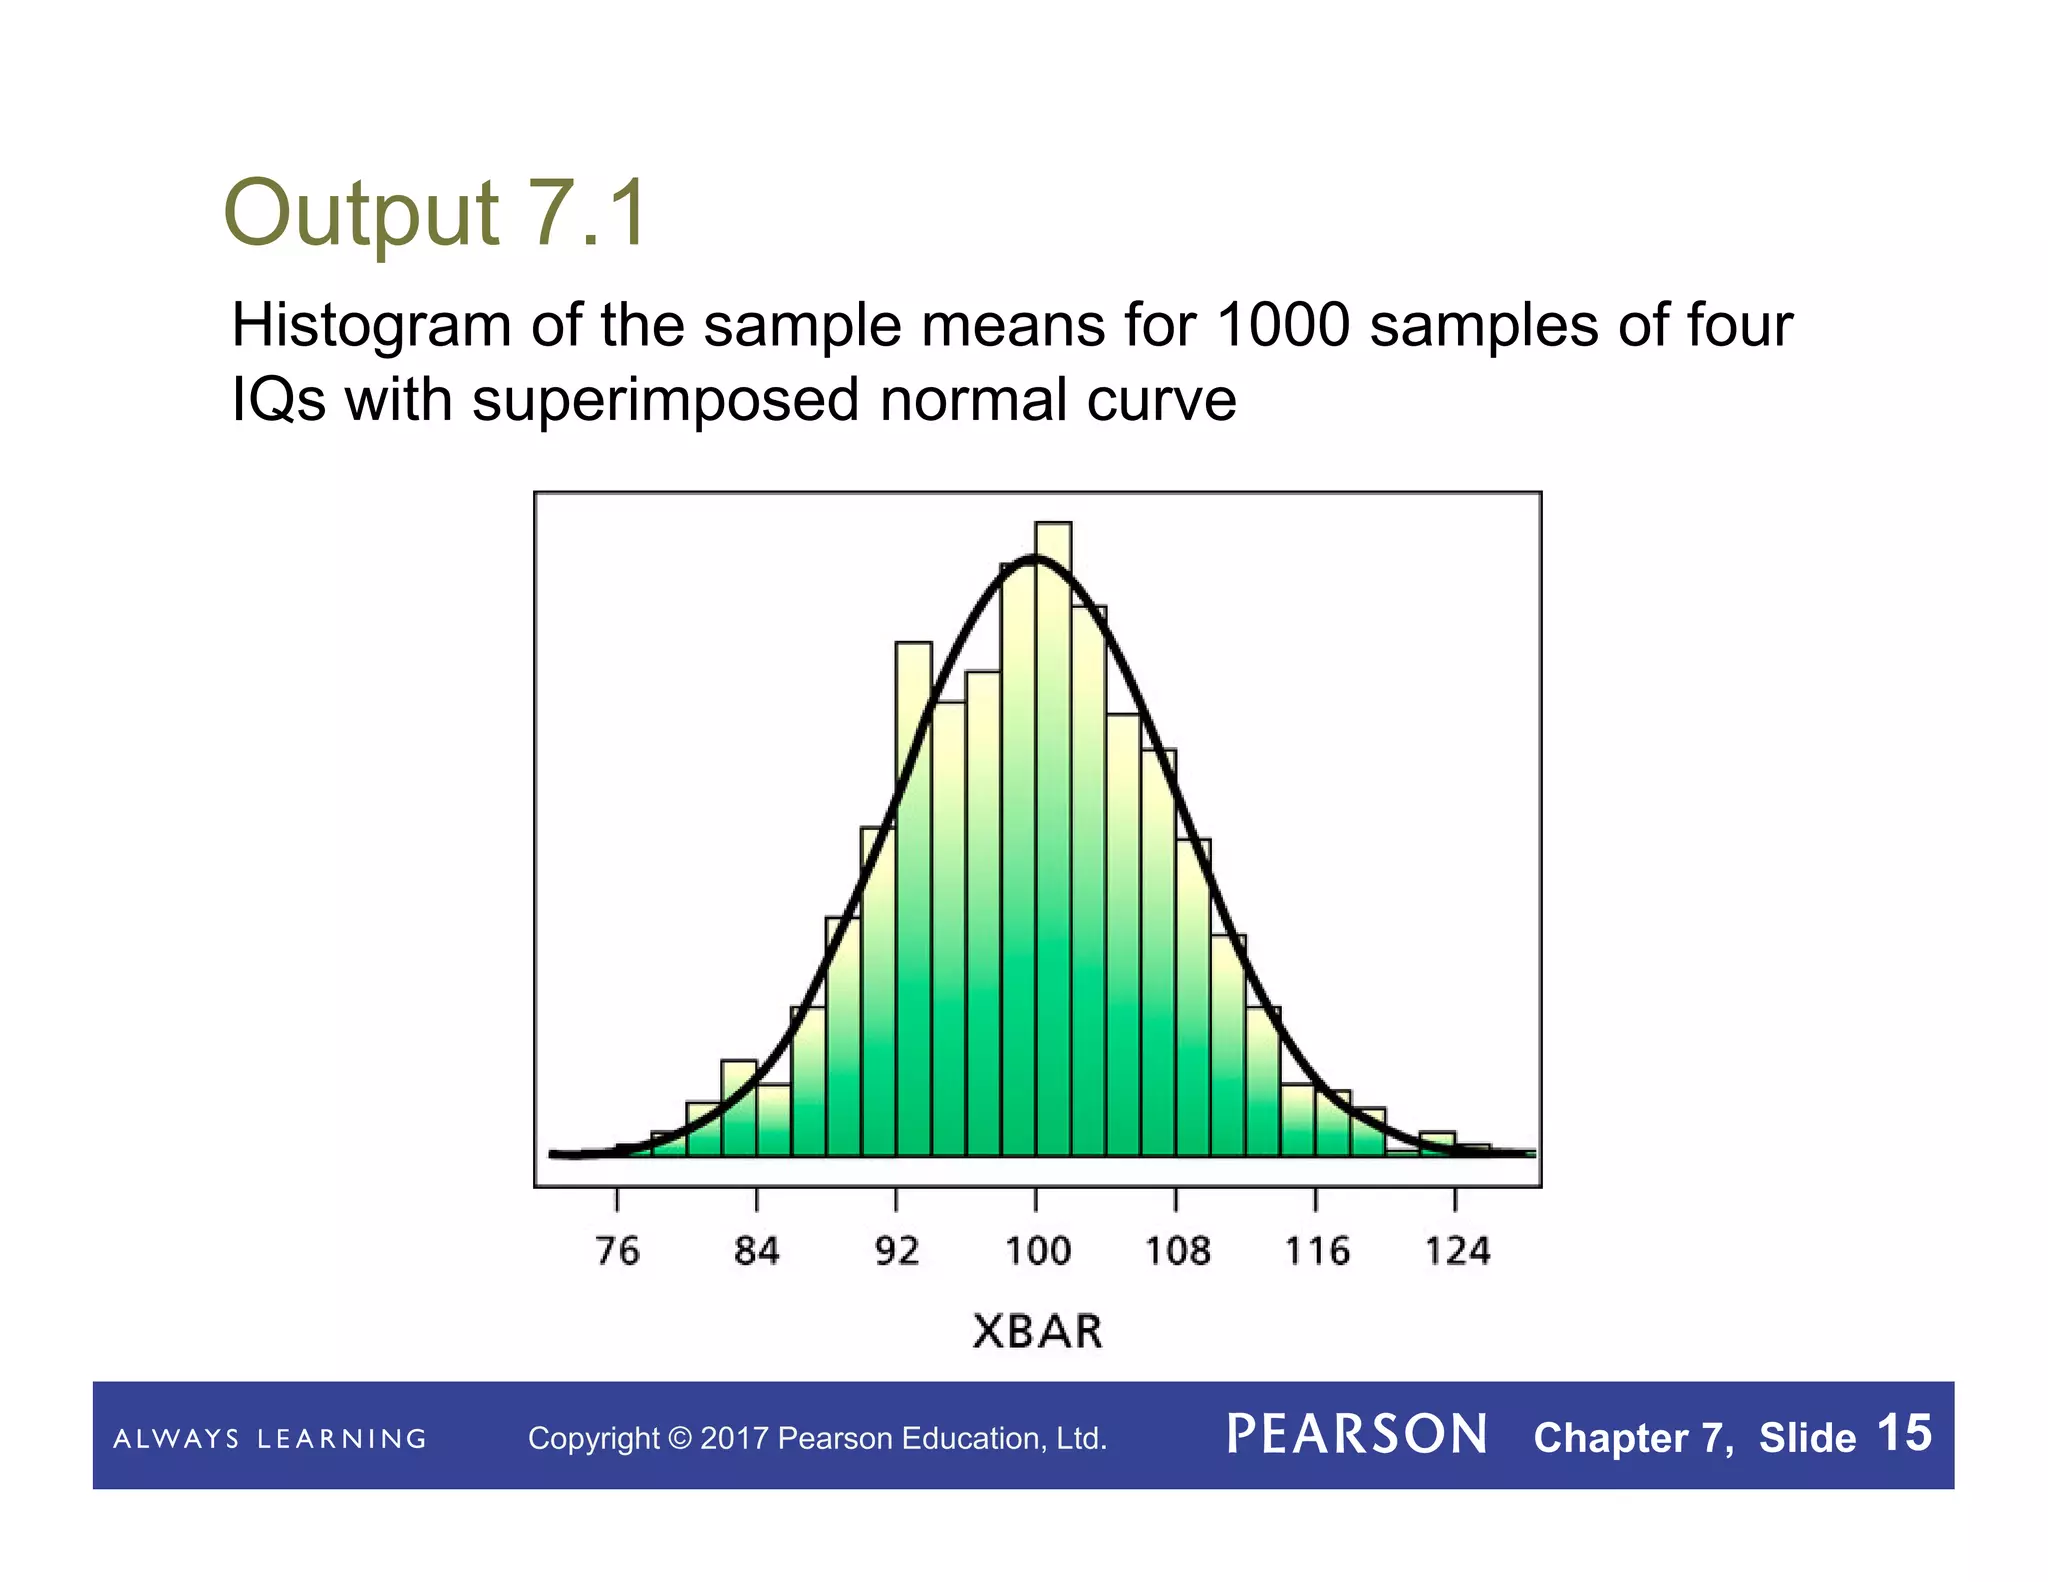
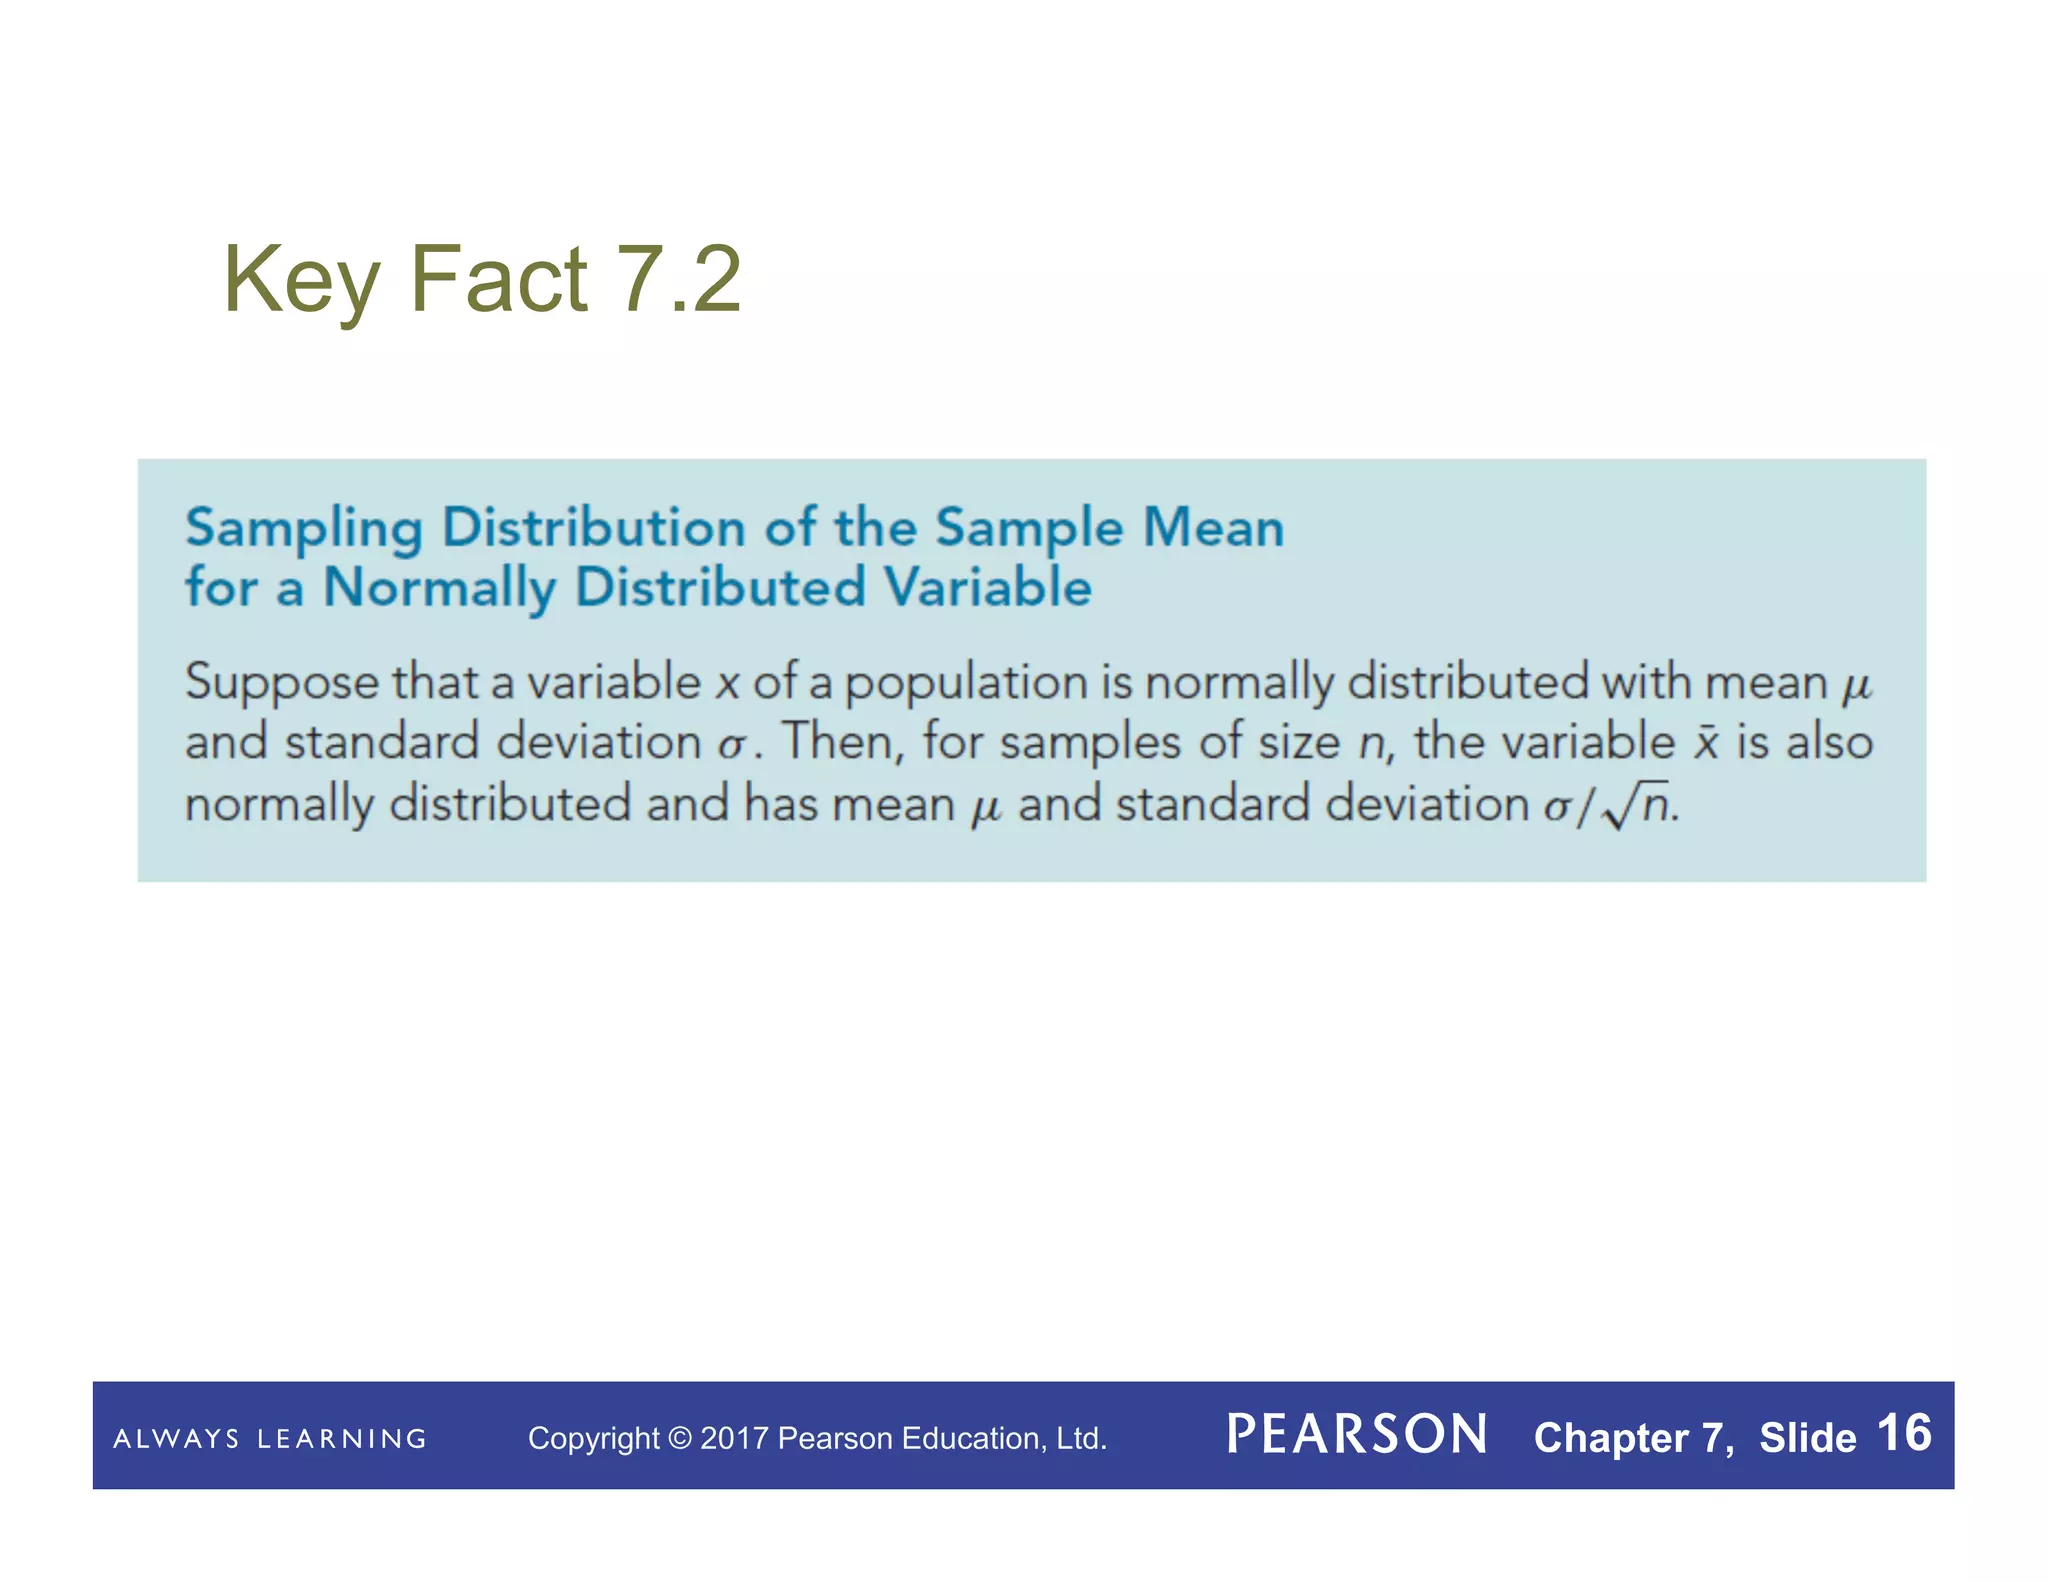
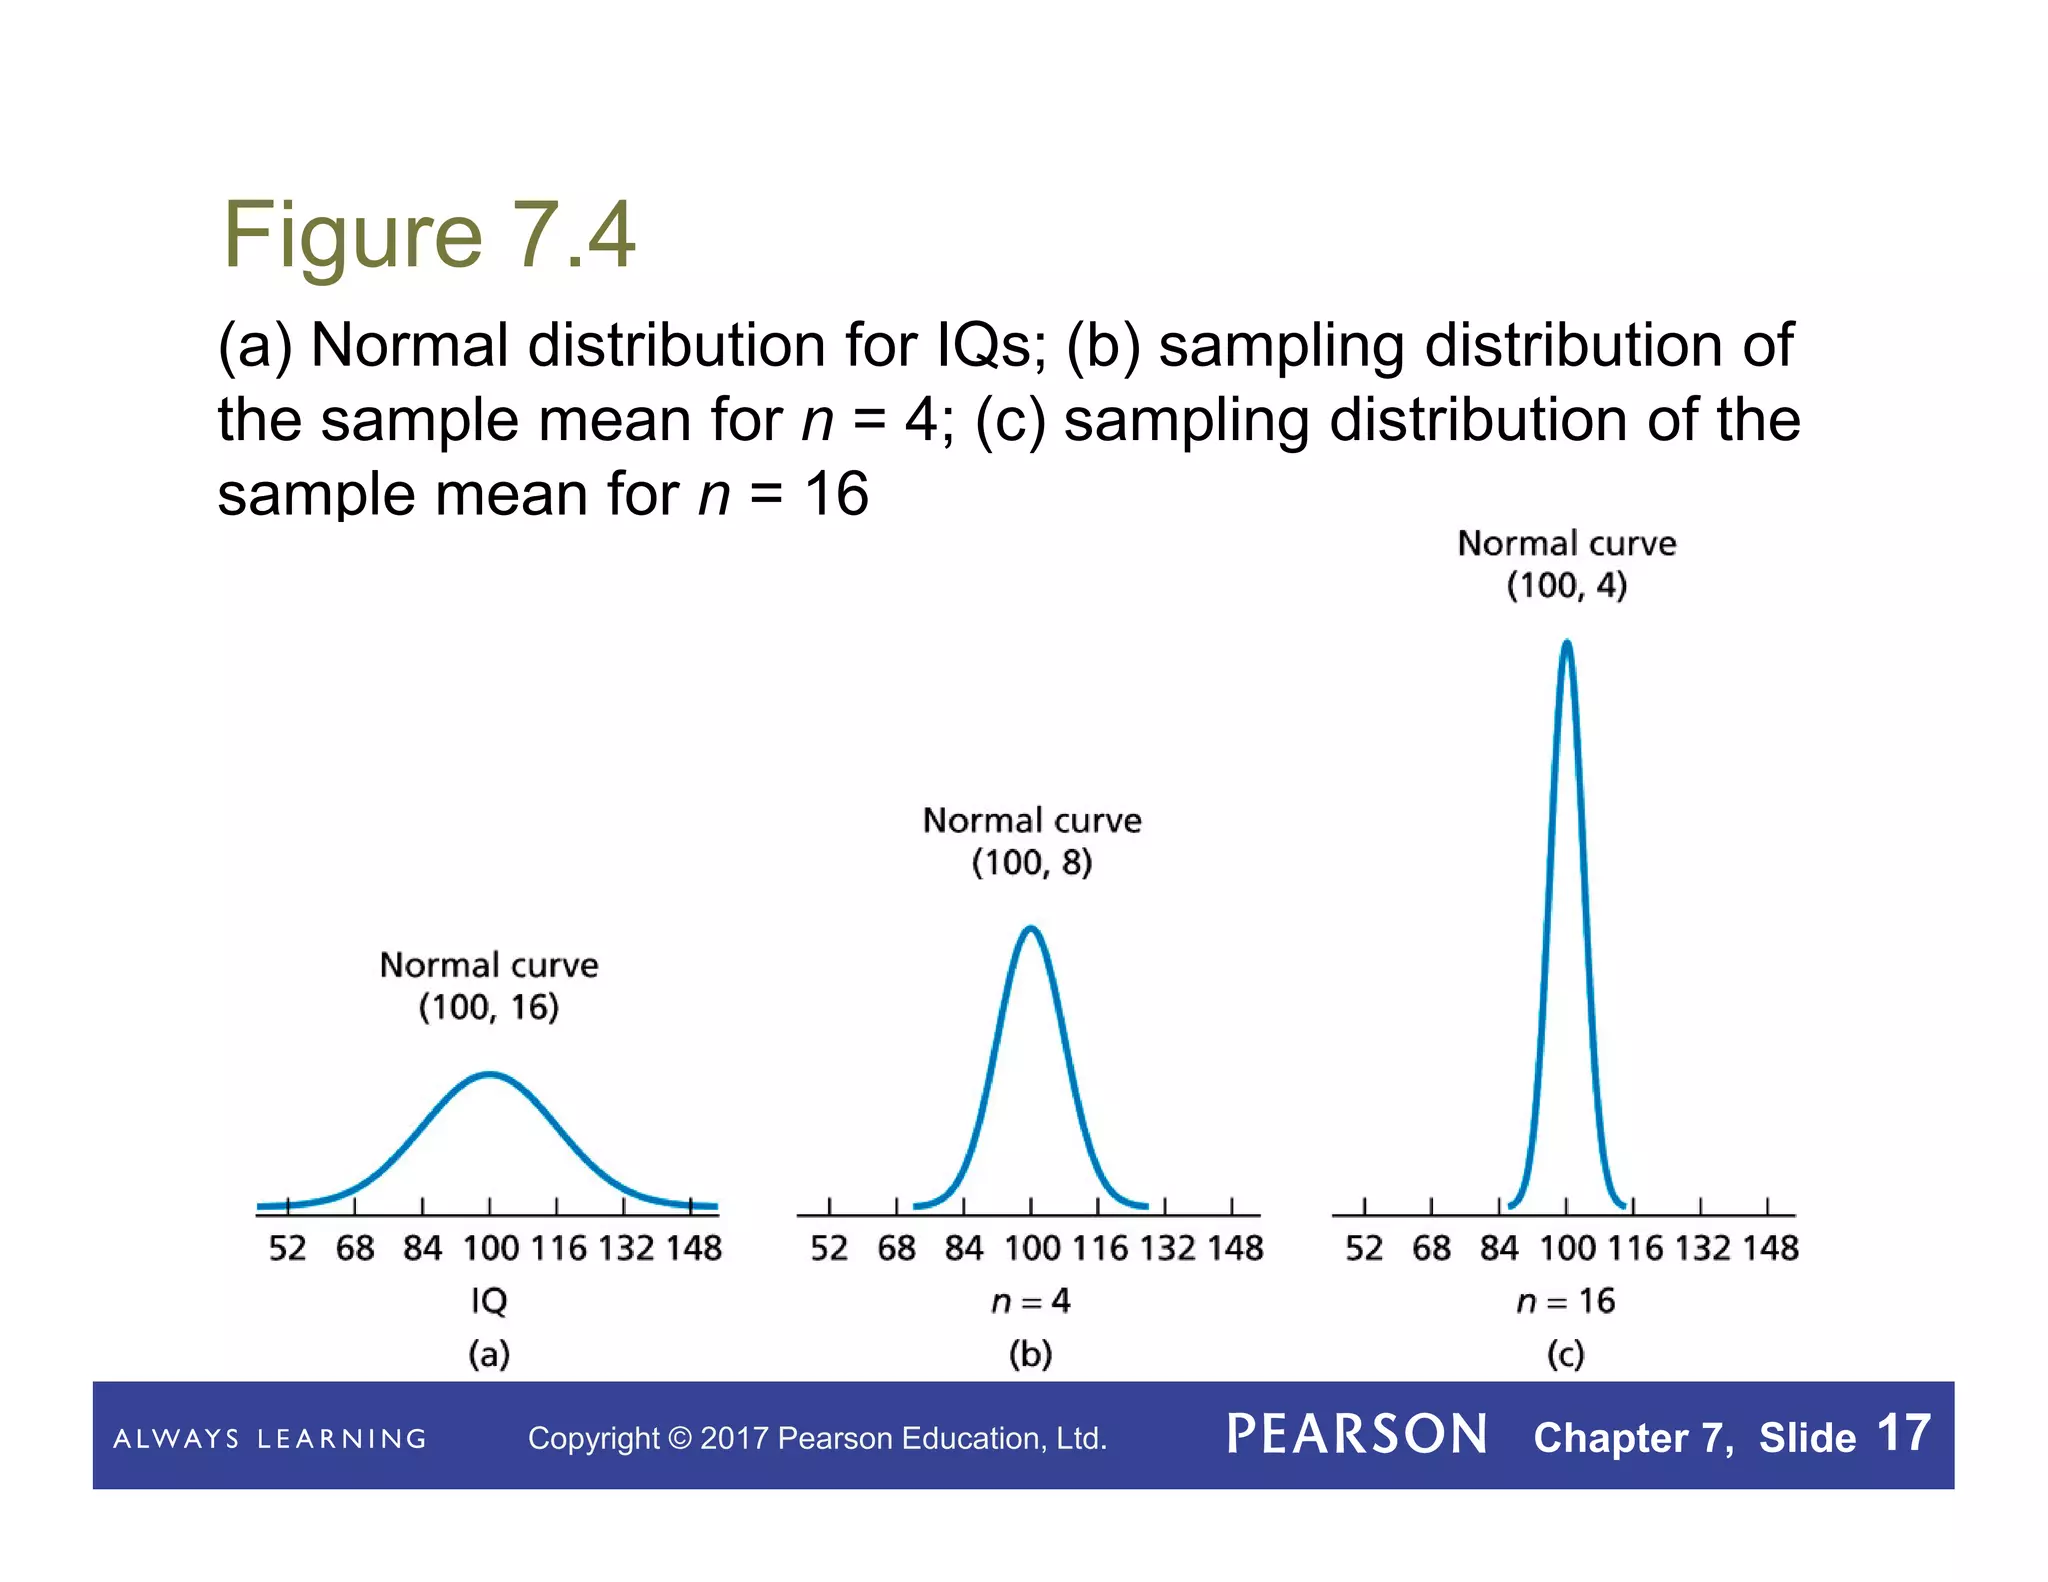
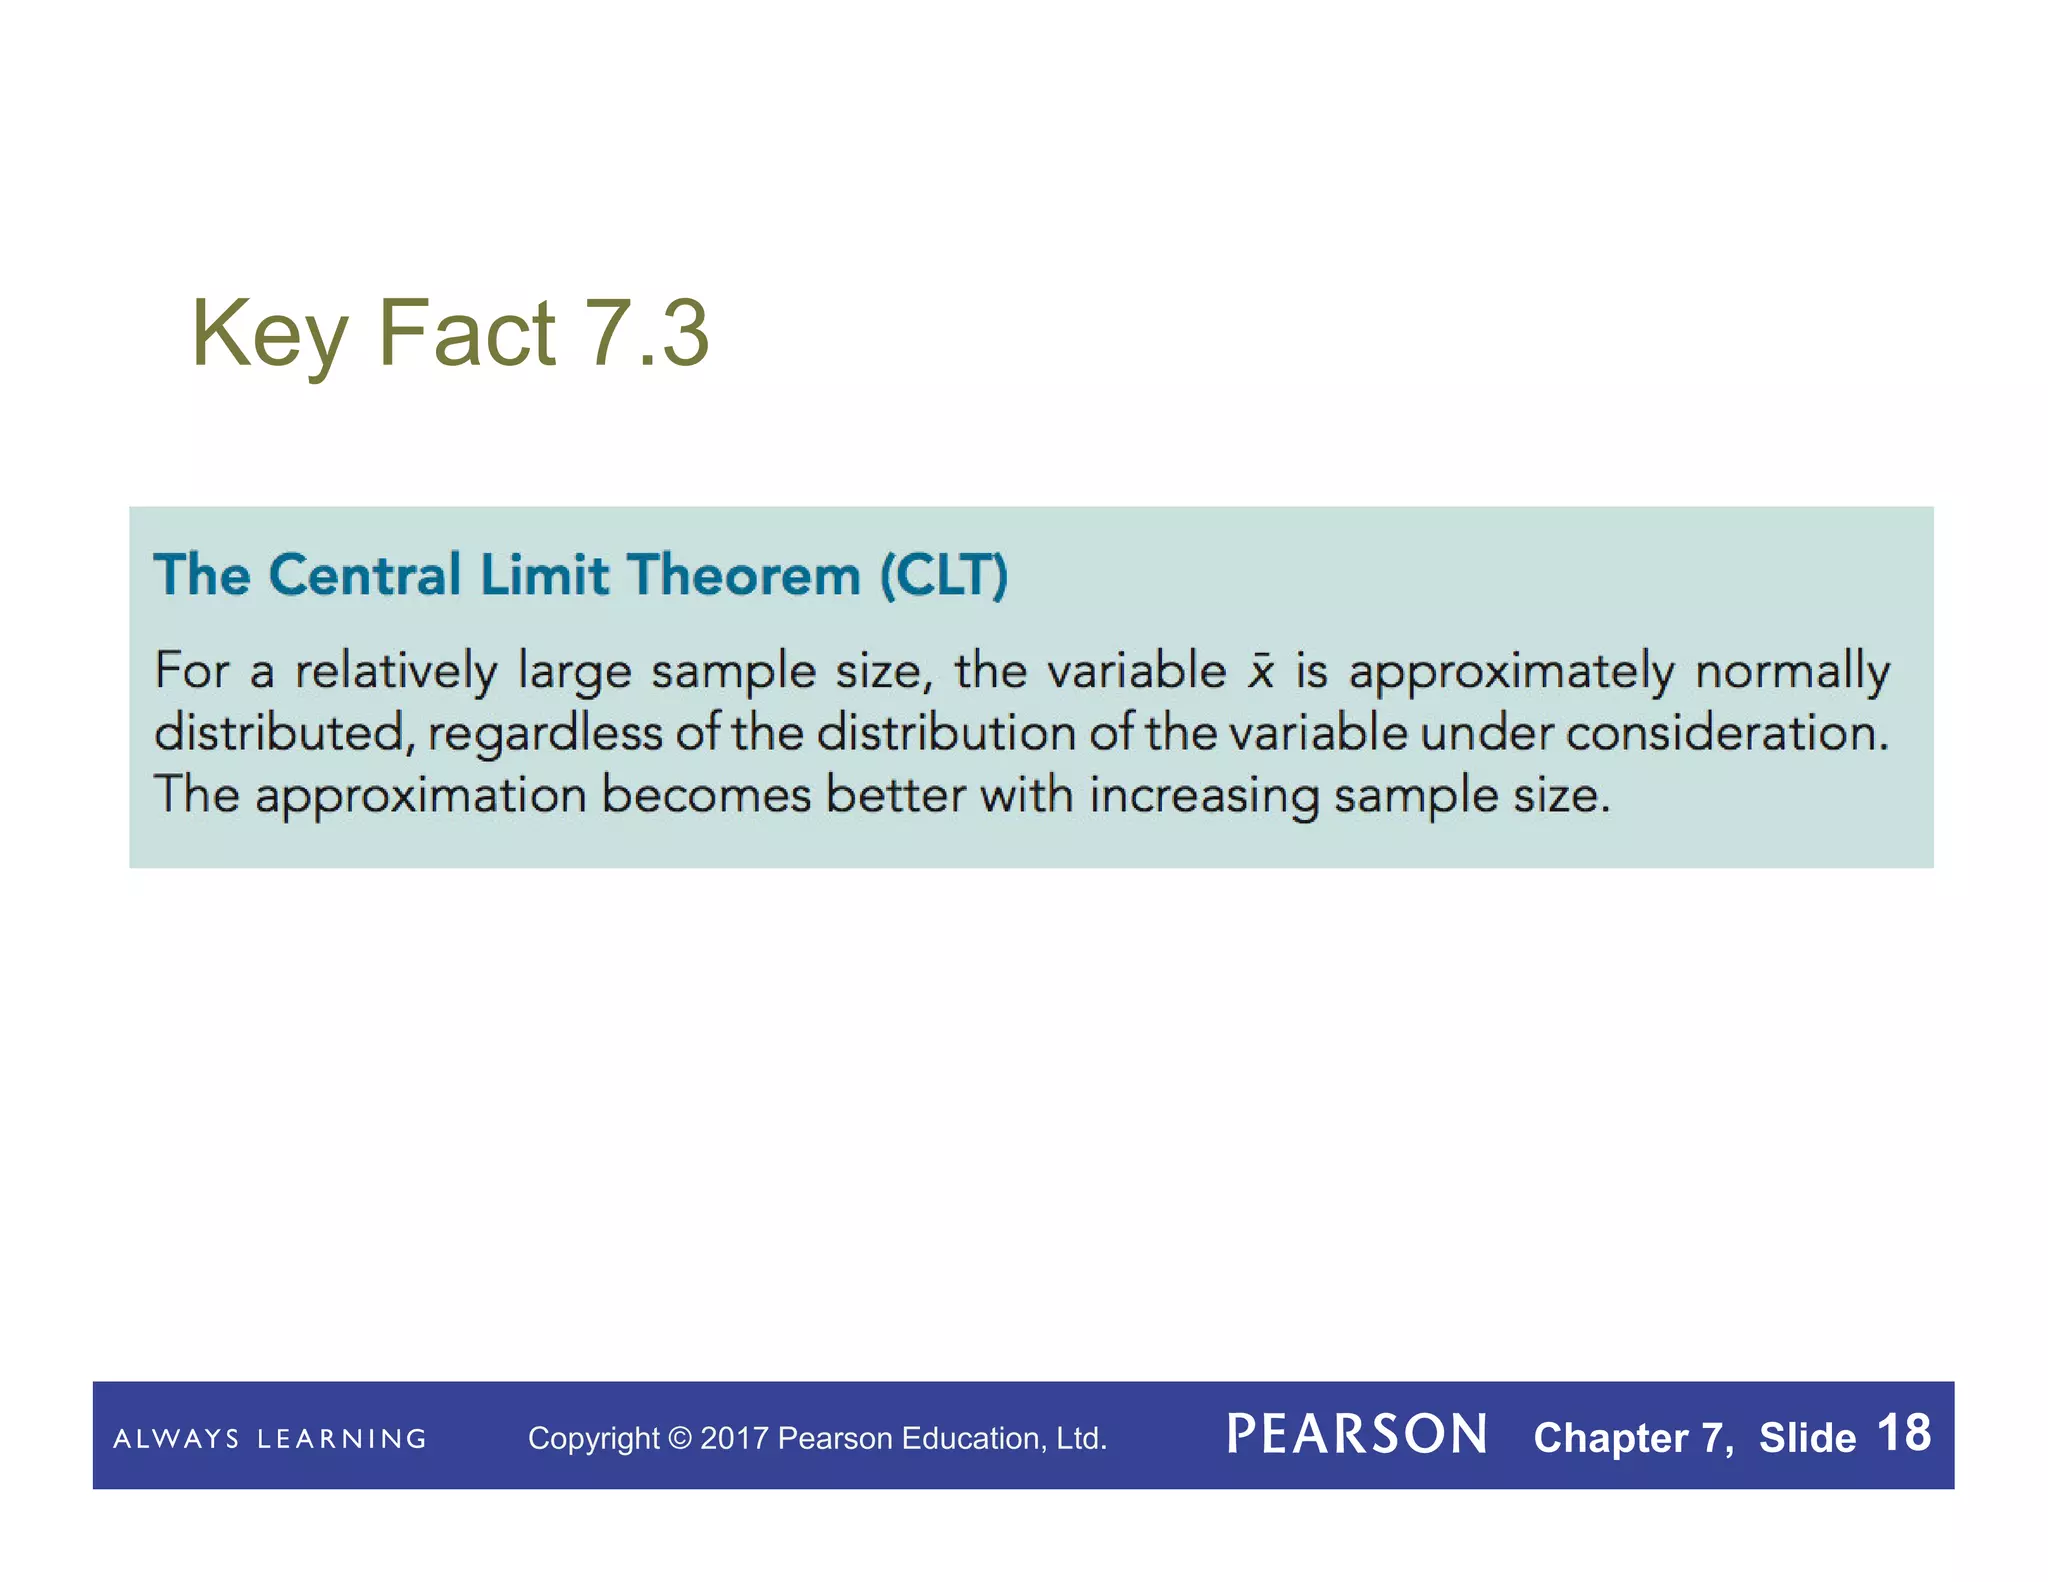
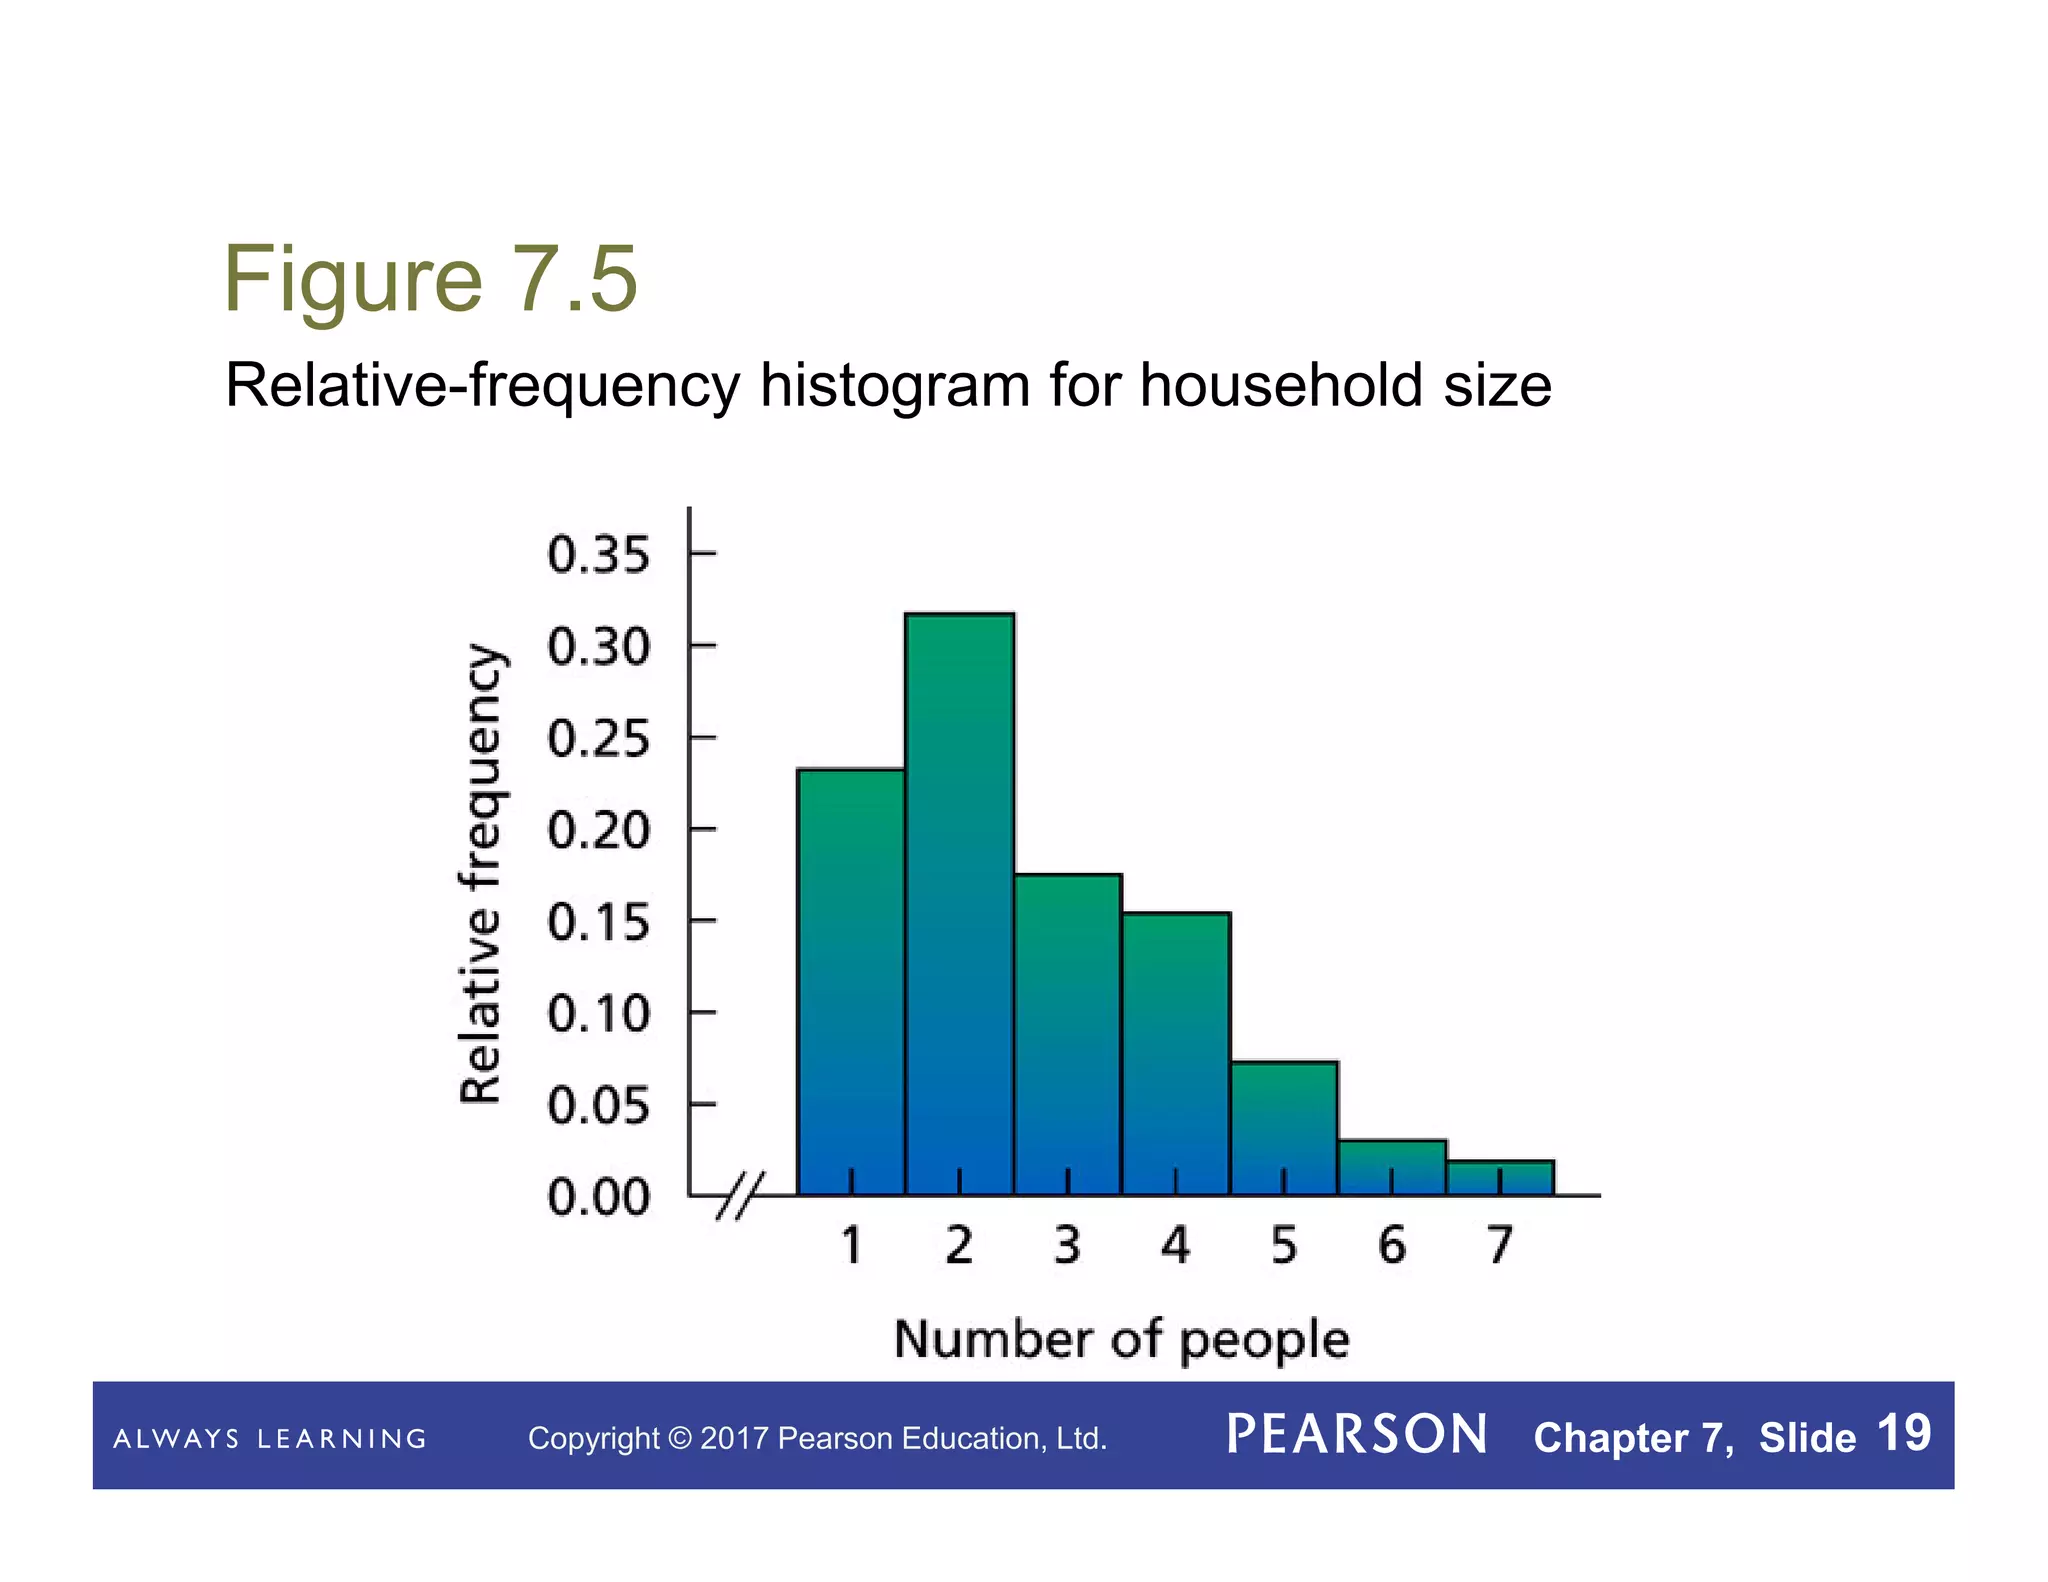
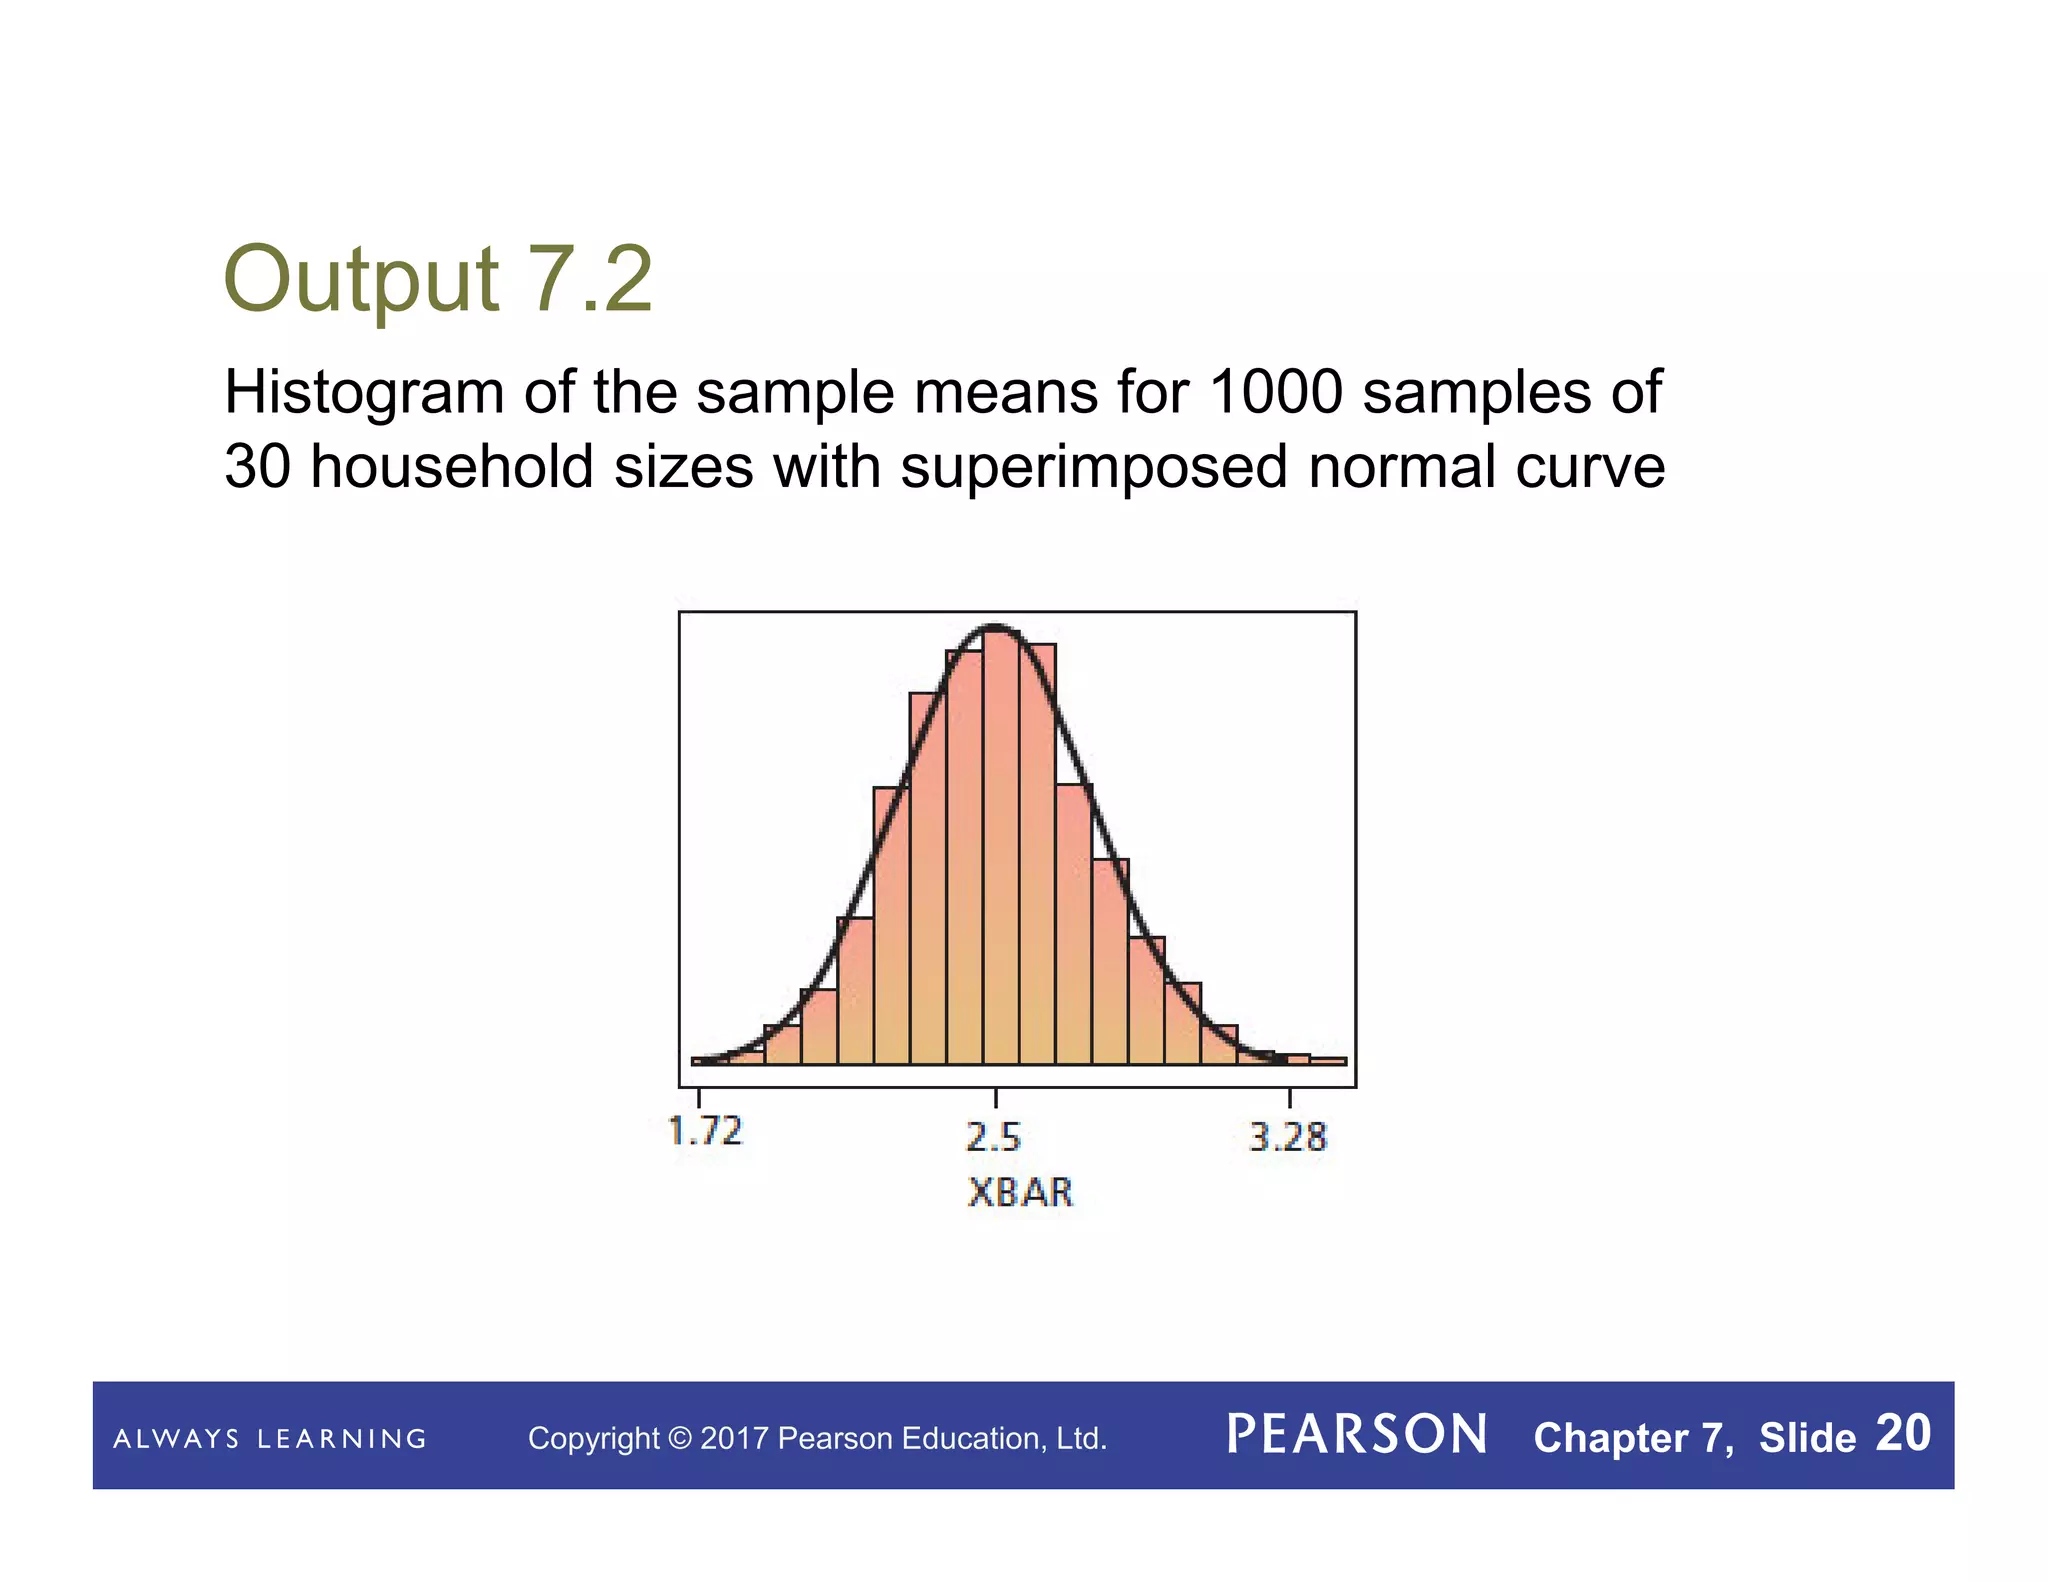
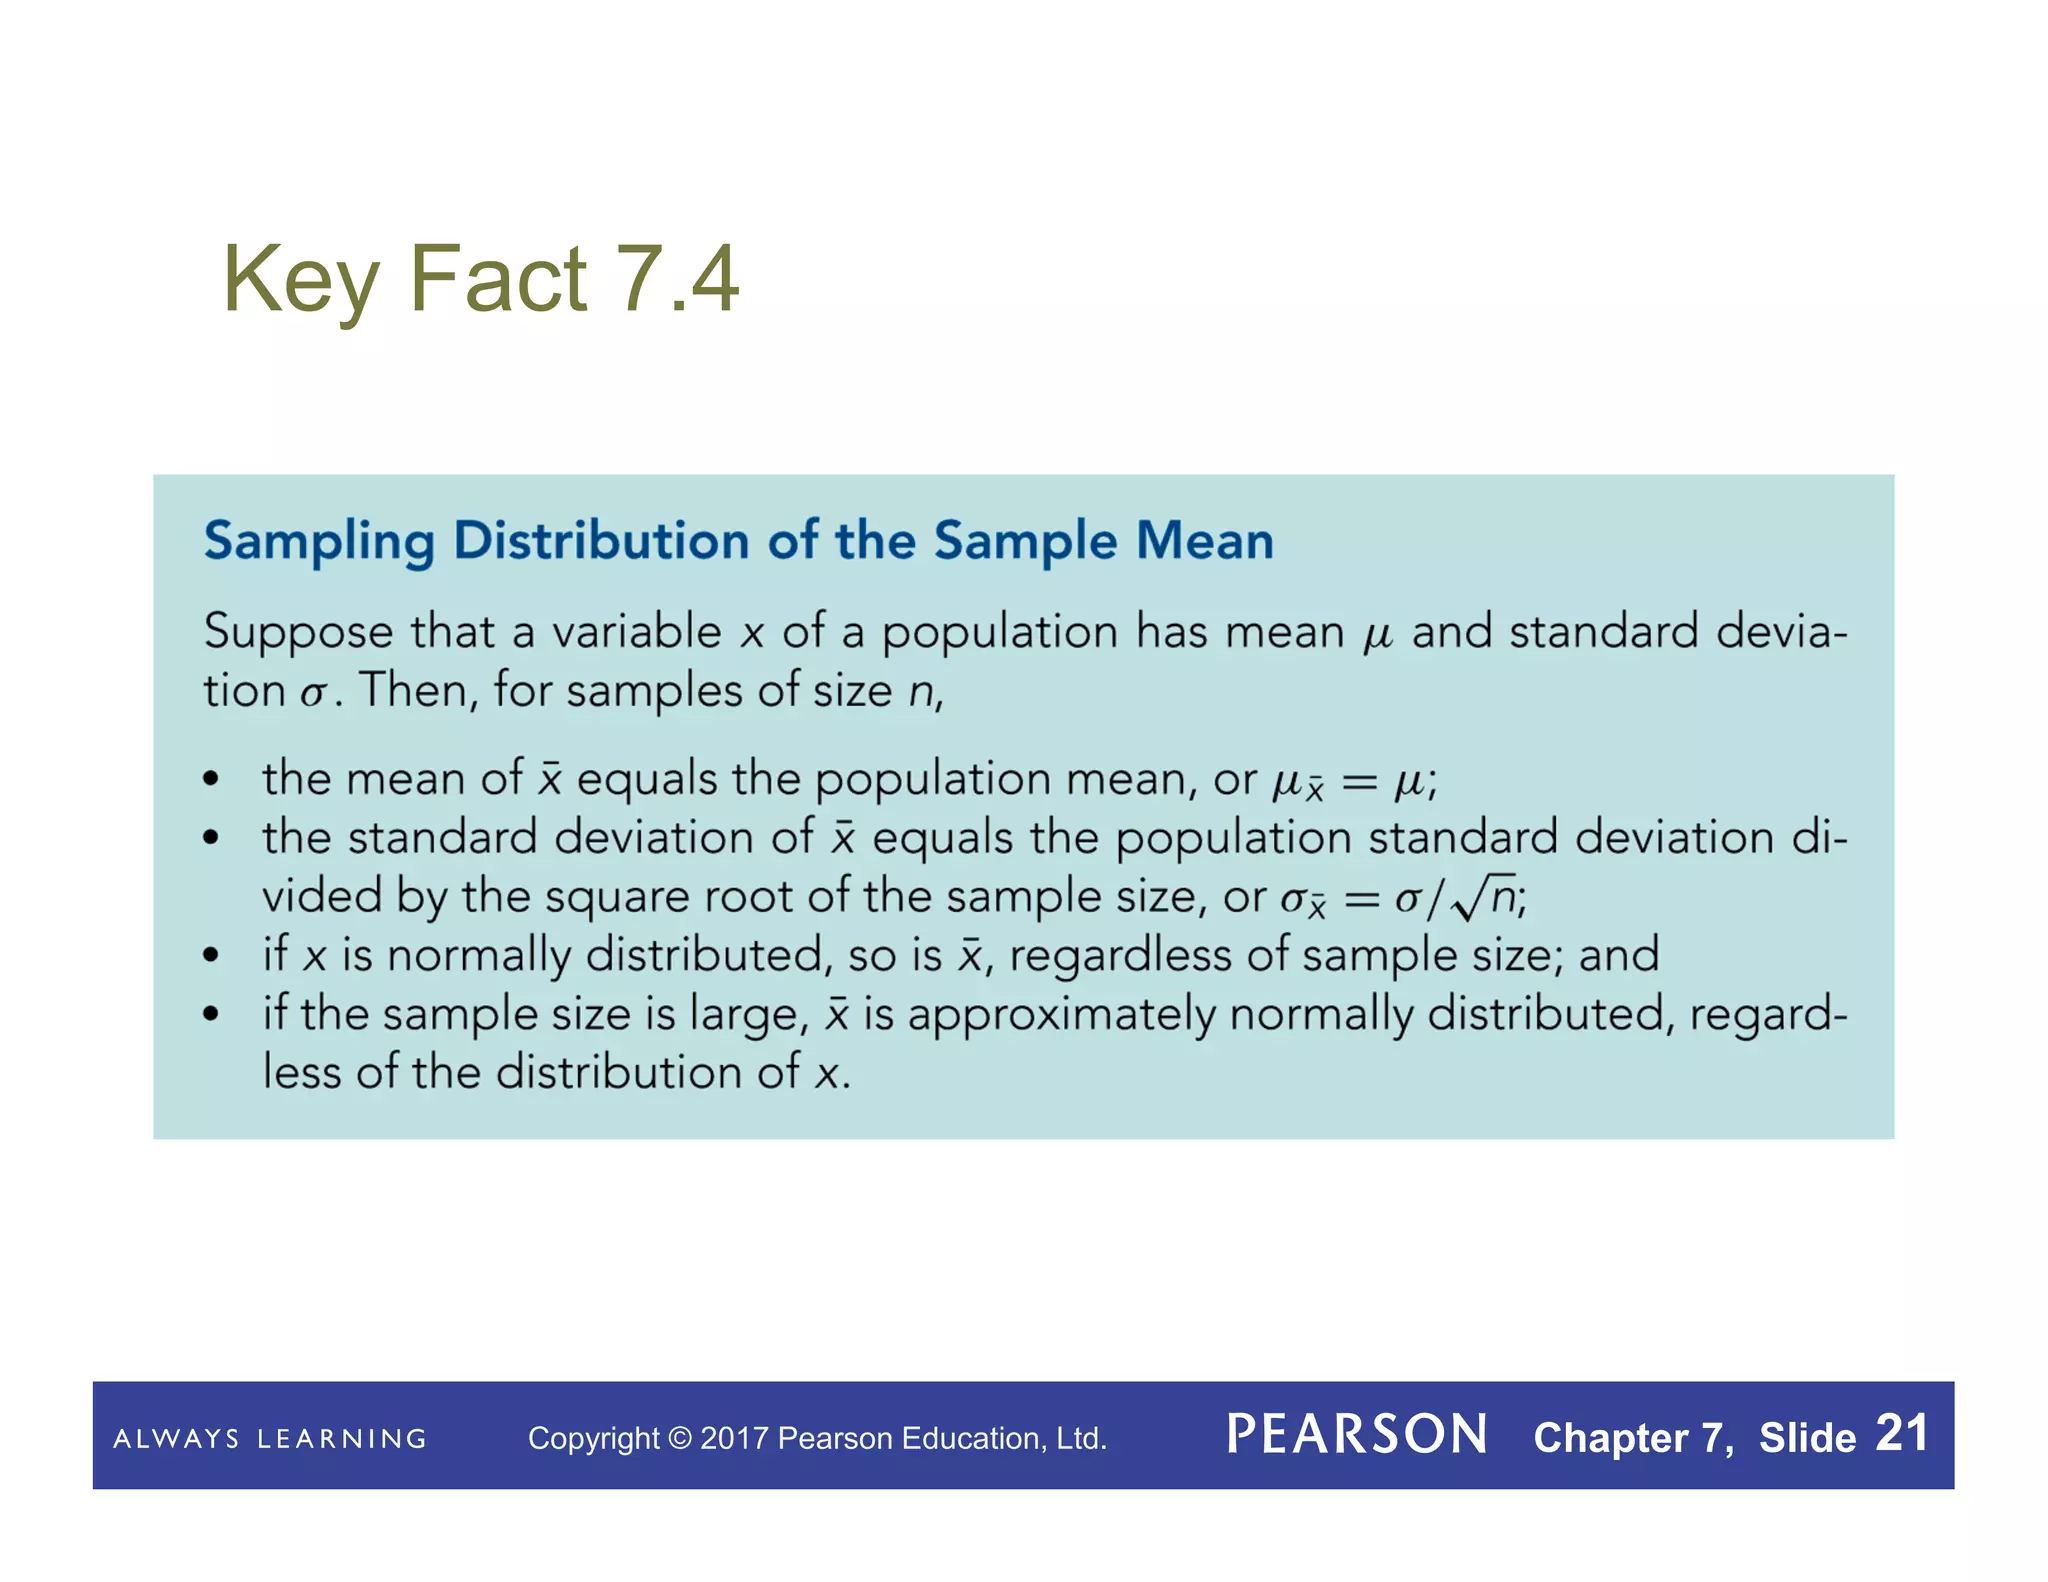
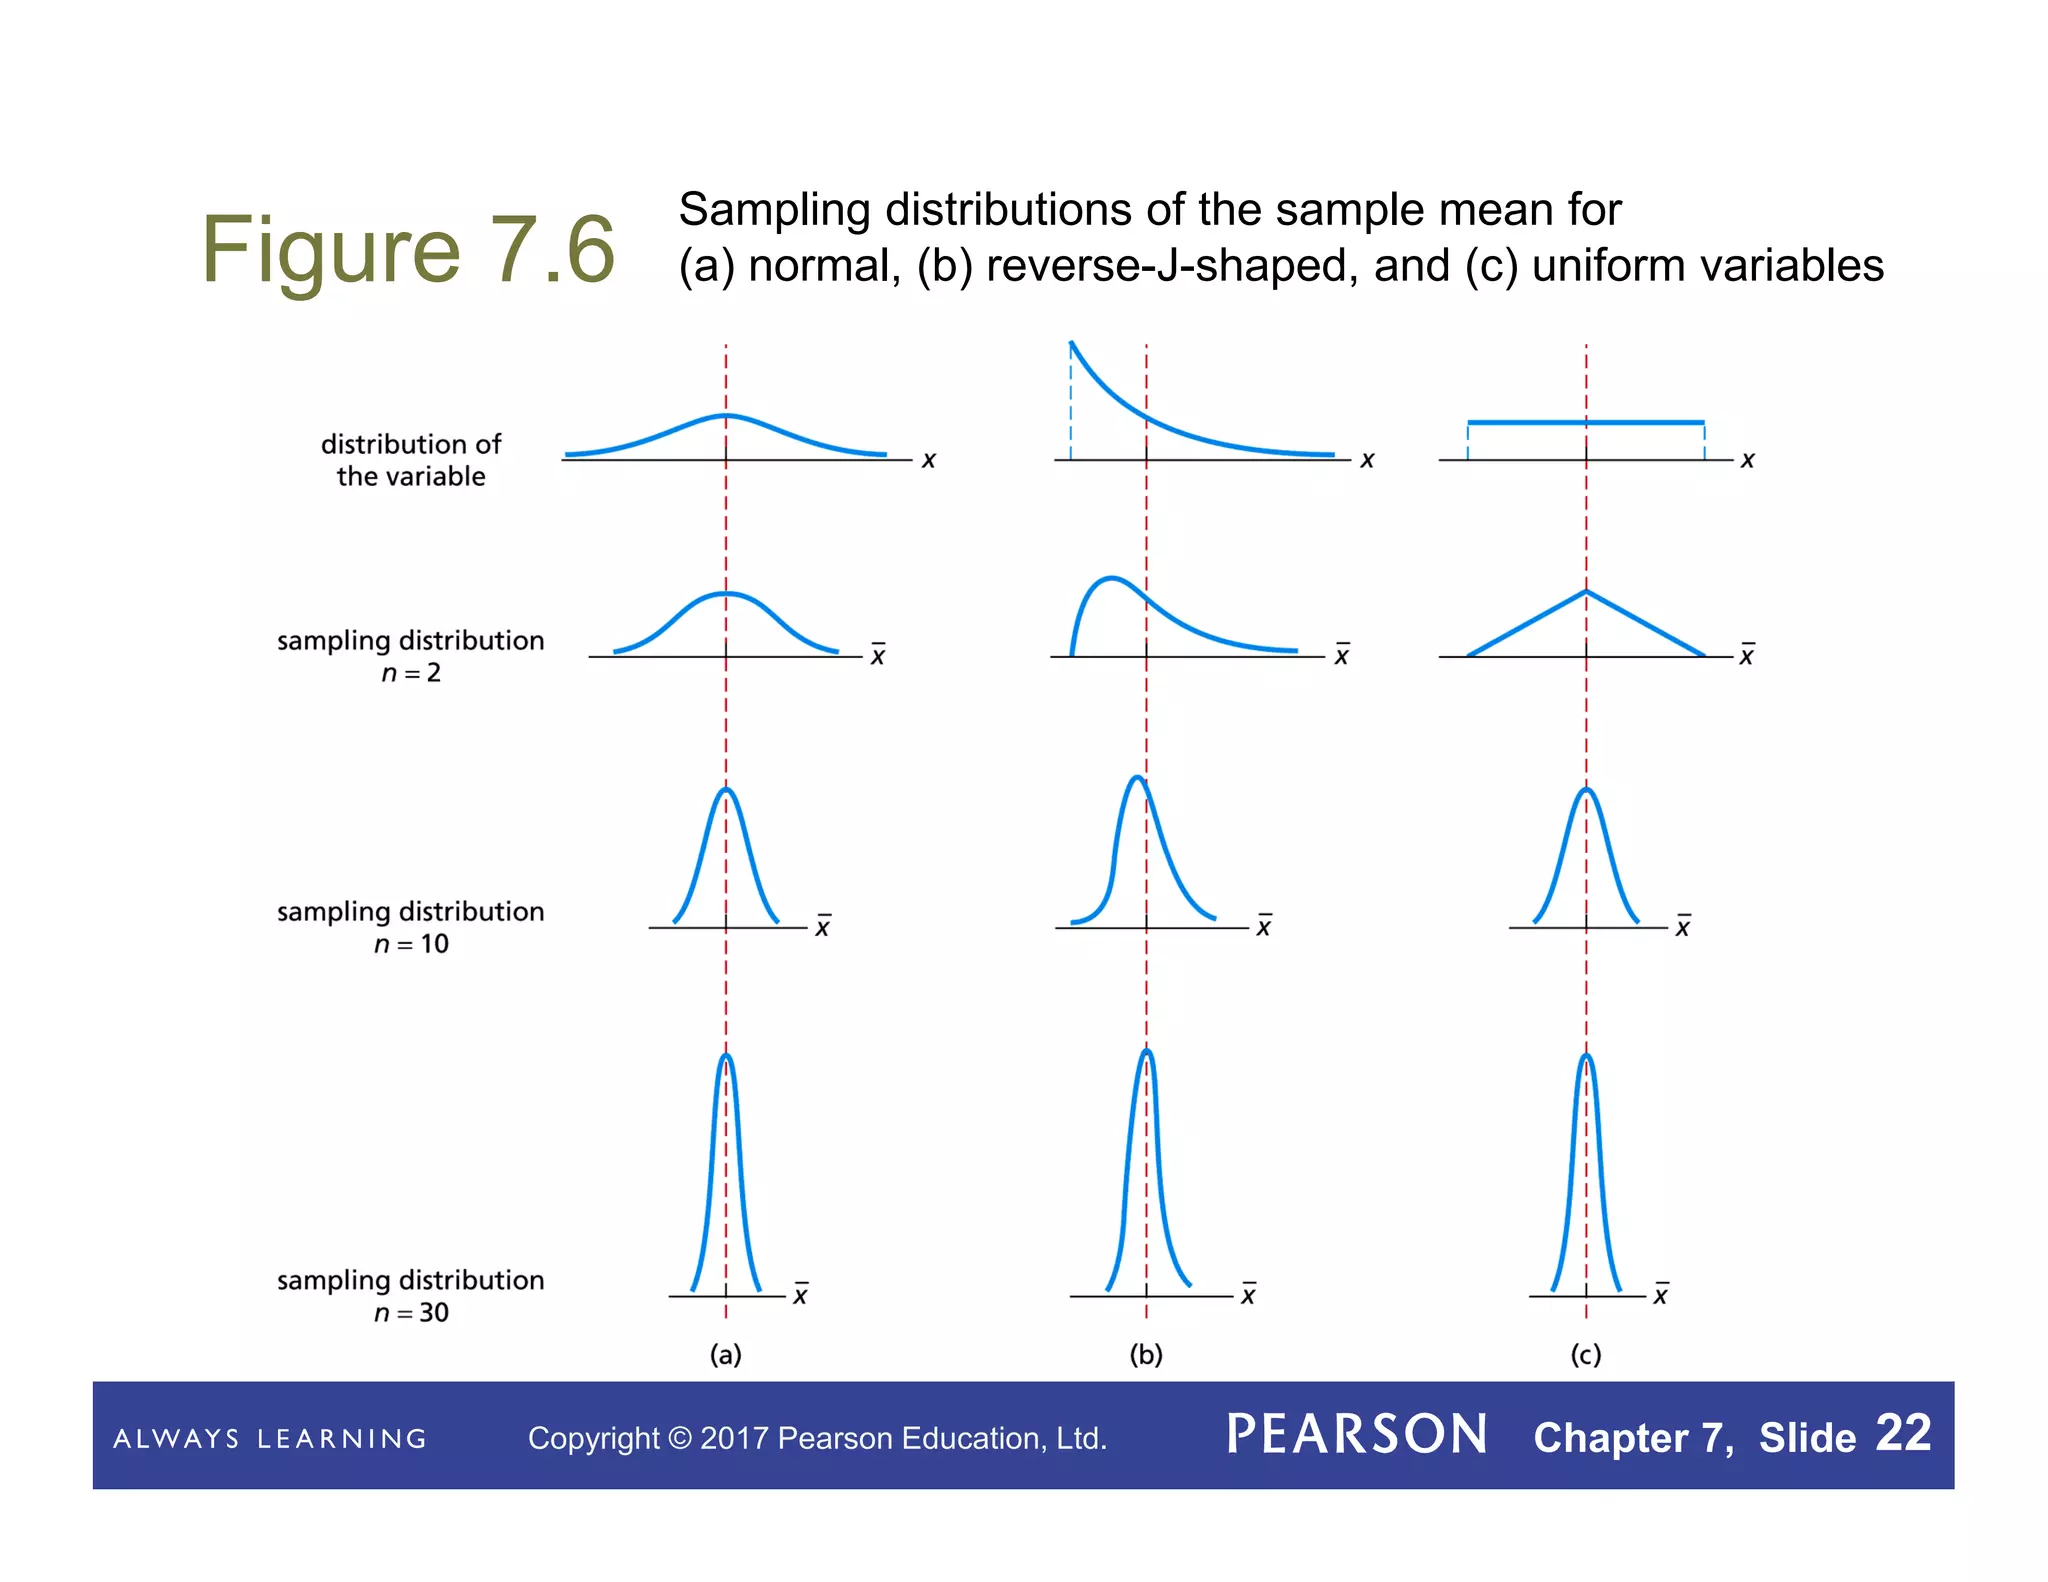
Copyright © 2017 Pearson Education, Ltd. Chapter 7, Slide 1
Chapter 7
The Sampling
Distribution of the
Sample Mean
Copyright © 2017 Pearson Education, Ltd. Chapter 7, Slide 1
Copyright © 2017 Pearson Education, Ltd. Chapter 7, Slide 2
Chapter 7
The Sampling Distribution of
the Sample Mean
Copyright © 2017 Pearson Education, Ltd. Chapter 7, Slide 3
Section 7.1
Sampling Error; the Need for
Sampling Distributions
Copyright © 2017 Pearson Education, Ltd. Chapter 7, Slide 4
Definition 7.1
Sampling Error
Sampling error is the error resulting from using a
sample to estimate a population characteristic.
Copyright © 2017 Pearson Education, Ltd. Chapter 7, Slide 5
Definition 7.2
Sampling Distribution of the Sample Mean
For a variable x and a given sample size, the
distribution of the variable is called the sampling
distribution of the sample mean.
x
Copyright © 2017 Pearson Education, Ltd. Chapter 7, Slide 6
Table 7.2
Possible samples
and sample means
for samples of size 2
µ = ∑xi = 76+78+79+ 81+86 = 80
N 5
A, B, C, D, E
76 78 79 81 86
H1
Slide 6
H1 HP, 5/9/2020
Copyright © 2017 Pearson Education, Ltd. Chapter 7, Slide 7
Figure 7.1
Dotplot for the sampling distribution of the sample mean for
samples of size 2 ( n = 2)
Copyright © 2017 Pearson Education, Ltd. Chapter 7, Slide 8
Figure 7.3
Dotplots for the sampling
distributions of the sample
mean for the heights of the five
starting players for samples of
sizes 1, 2, 3, 4, and 5
A, B, C, D, E
76 78 79 81 86
Copyright © 2017 Pearson Education, Ltd. Chapter 7, Slide 9
Table 7.4
Sample size and sampling error illustrations for the heights
of the basketball players (“No.” is an abbreviation of
“Number”)
Copyright © 2017 Pearson Education, Ltd. Chapter 7, Slide 10
Key Fact 7.1
Copyright © 2017 Pearson Education, Ltd. Chapter 7, Slide 11
Section 7.2
The Mean and Standard
Deviation of the Sample Mean
Copyright © 2017 Pearson Education, Ltd. Chapter 7, Slide 12
Formula 7.1
Copyright © 2017 Pearson Education, Ltd. Chapter 7, Slide 13
Formula 7.2
Copyright © 2017 Pearson Education, Ltd. Chapter 7, Slide 14
Section 7.3
The Sampling Distribution of
the Sample Mean
Copyright © 2017 Pearson Education, Ltd. Chapter 7, Slide 15
Output 7.1
Histogram of the sample means for 1000 samples of four
IQs with superimposed normal curve
Copyright © 2017 Pearson Education, Ltd. Chapter 7, Slide 16
Key Fact 7.2
Copyright © 2017 Pearson Education, Ltd. Chapter 7, Slide 17
Figure 7.4
(a) Normal distribution for IQs; (b) sampling distribution of
the sample mean for n = 4; (c) sampling distribution of the
sample mean for n = 16
Copyright © 2017 Pearson Education, Ltd. Chapter 7, Slide 18
Key Fact 7.3
Copyright © 2017 Pearson Education, Ltd. Chapter 7, Slide 19
Figure 7.5
Relative-frequency histogram for household size
Copyright © 2017 Pearson Education, Ltd. Chapter 7, Slide 20
Output 7.2
Histogram of the sample means for 1000 samples of
30 household sizes with superimposed normal curve
Copyright © 2017 Pearson Education, Ltd. Chapter 7, Slide 21
Key Fact 7.4
Copyright © 2017 Pearson Education, Ltd. Chapter 7, Slide 22
Figure 7.6
Sampling distributions of the sample mean for
(a) normal, (b) reverse-J-shaped, and (c) uniform variables

The sampling distribution of the sample mean.pdf

  • 1.
    Copyright © 2017Pearson Education, Ltd. Chapter 7, Slide 1 Chapter 7 The Sampling Distribution of the Sample Mean Copyright © 2017 Pearson Education, Ltd. Chapter 7, Slide 1
  • 2.
    Copyright © 2017Pearson Education, Ltd. Chapter 7, Slide 2 Chapter 7 The Sampling Distribution of the Sample Mean
  • 3.
    Copyright © 2017Pearson Education, Ltd. Chapter 7, Slide 3 Section 7.1 Sampling Error; the Need for Sampling Distributions
  • 4.
    Copyright © 2017Pearson Education, Ltd. Chapter 7, Slide 4 Definition 7.1 Sampling Error Sampling error is the error resulting from using a sample to estimate a population characteristic.
  • 5.
    Copyright © 2017Pearson Education, Ltd. Chapter 7, Slide 5 Definition 7.2 Sampling Distribution of the Sample Mean For a variable x and a given sample size, the distribution of the variable is called the sampling distribution of the sample mean. x
  • 6.
    Copyright © 2017Pearson Education, Ltd. Chapter 7, Slide 6 Table 7.2 Possible samples and sample means for samples of size 2 µ = ∑xi = 76+78+79+ 81+86 = 80 N 5 A, B, C, D, E 76 78 79 81 86 H1
  • 7.
  • 8.
    Copyright © 2017Pearson Education, Ltd. Chapter 7, Slide 7 Figure 7.1 Dotplot for the sampling distribution of the sample mean for samples of size 2 ( n = 2)
  • 9.
    Copyright © 2017Pearson Education, Ltd. Chapter 7, Slide 8 Figure 7.3 Dotplots for the sampling distributions of the sample mean for the heights of the five starting players for samples of sizes 1, 2, 3, 4, and 5 A, B, C, D, E 76 78 79 81 86
  • 10.
    Copyright © 2017Pearson Education, Ltd. Chapter 7, Slide 9 Table 7.4 Sample size and sampling error illustrations for the heights of the basketball players (“No.” is an abbreviation of “Number”)
  • 11.
    Copyright © 2017Pearson Education, Ltd. Chapter 7, Slide 10 Key Fact 7.1
  • 12.
    Copyright © 2017Pearson Education, Ltd. Chapter 7, Slide 11 Section 7.2 The Mean and Standard Deviation of the Sample Mean
  • 13.
    Copyright © 2017Pearson Education, Ltd. Chapter 7, Slide 12 Formula 7.1
  • 14.
    Copyright © 2017Pearson Education, Ltd. Chapter 7, Slide 13 Formula 7.2
  • 15.
    Copyright © 2017Pearson Education, Ltd. Chapter 7, Slide 14 Section 7.3 The Sampling Distribution of the Sample Mean
  • 16.
    Copyright © 2017Pearson Education, Ltd. Chapter 7, Slide 15 Output 7.1 Histogram of the sample means for 1000 samples of four IQs with superimposed normal curve
  • 17.
    Copyright © 2017Pearson Education, Ltd. Chapter 7, Slide 16 Key Fact 7.2
  • 18.
    Copyright © 2017Pearson Education, Ltd. Chapter 7, Slide 17 Figure 7.4 (a) Normal distribution for IQs; (b) sampling distribution of the sample mean for n = 4; (c) sampling distribution of the sample mean for n = 16
  • 19.
    Copyright © 2017Pearson Education, Ltd. Chapter 7, Slide 18 Key Fact 7.3
  • 20.
    Copyright © 2017Pearson Education, Ltd. Chapter 7, Slide 19 Figure 7.5 Relative-frequency histogram for household size
  • 21.
    Copyright © 2017Pearson Education, Ltd. Chapter 7, Slide 20 Output 7.2 Histogram of the sample means for 1000 samples of 30 household sizes with superimposed normal curve
  • 22.
    Copyright © 2017Pearson Education, Ltd. Chapter 7, Slide 21 Key Fact 7.4
  • 23.
    Copyright © 2017Pearson Education, Ltd. Chapter 7, Slide 22 Figure 7.6 Sampling distributions of the sample mean for (a) normal, (b) reverse-J-shaped, and (c) uniform variables