Download as PDF, PPTX
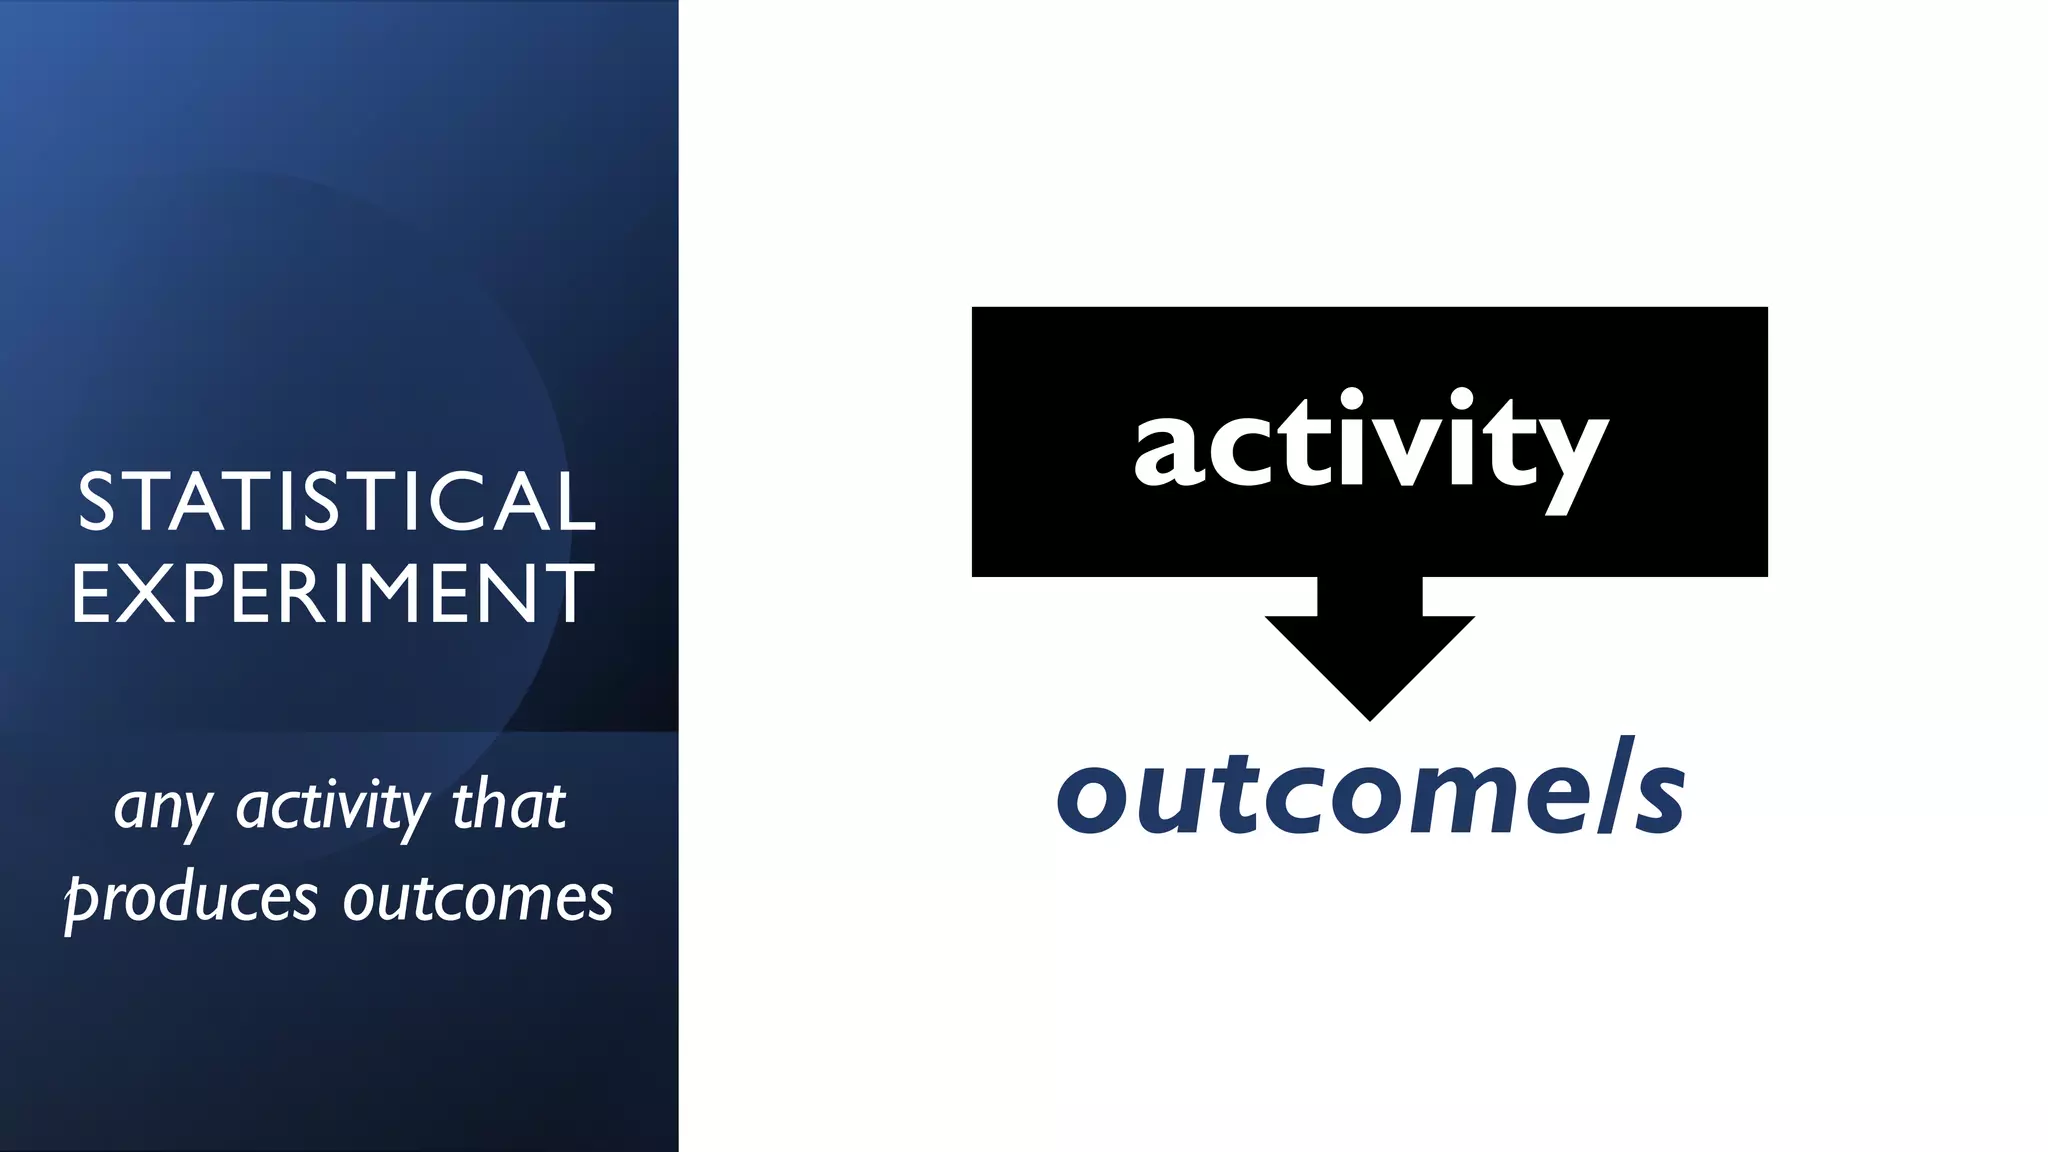

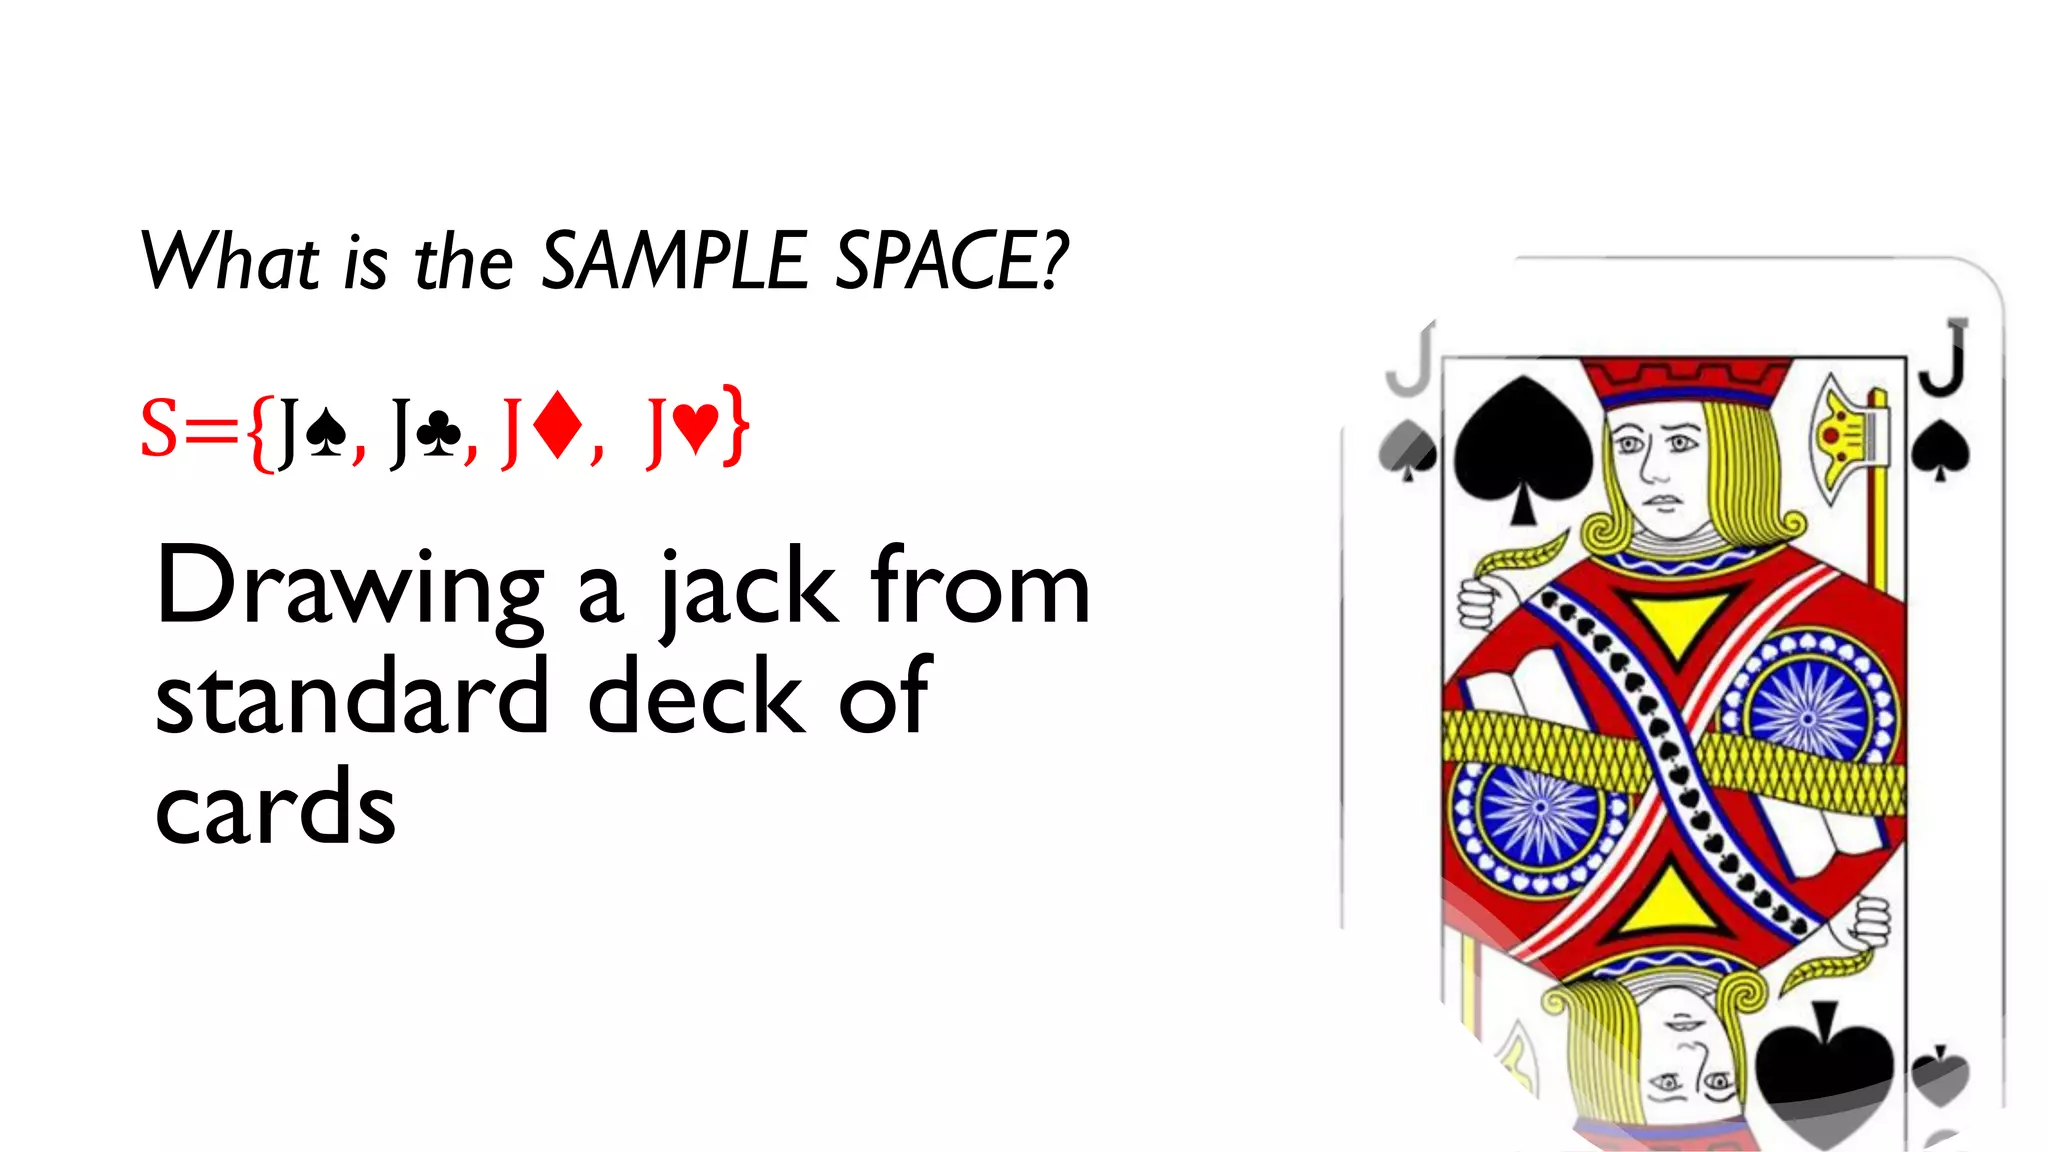
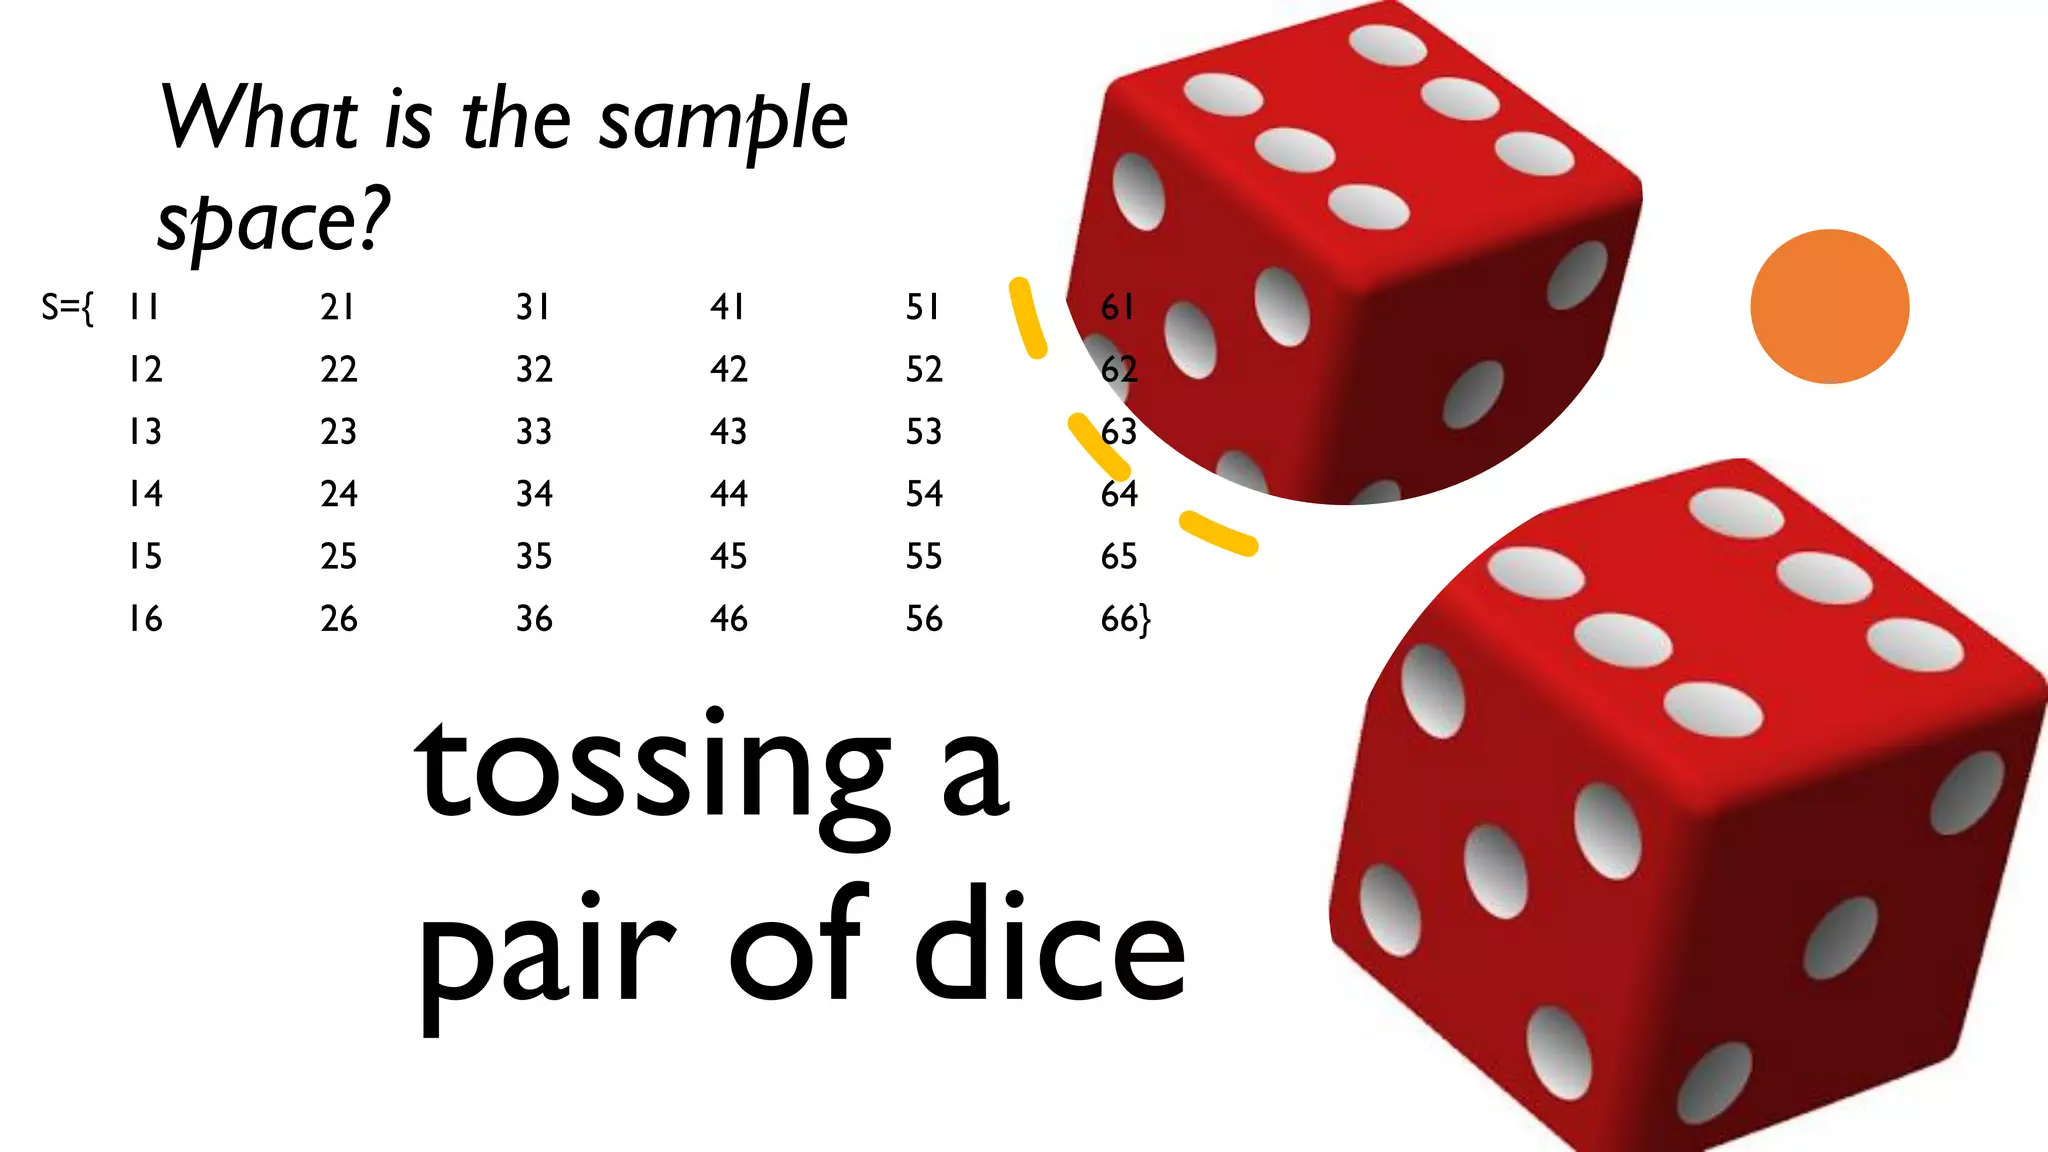
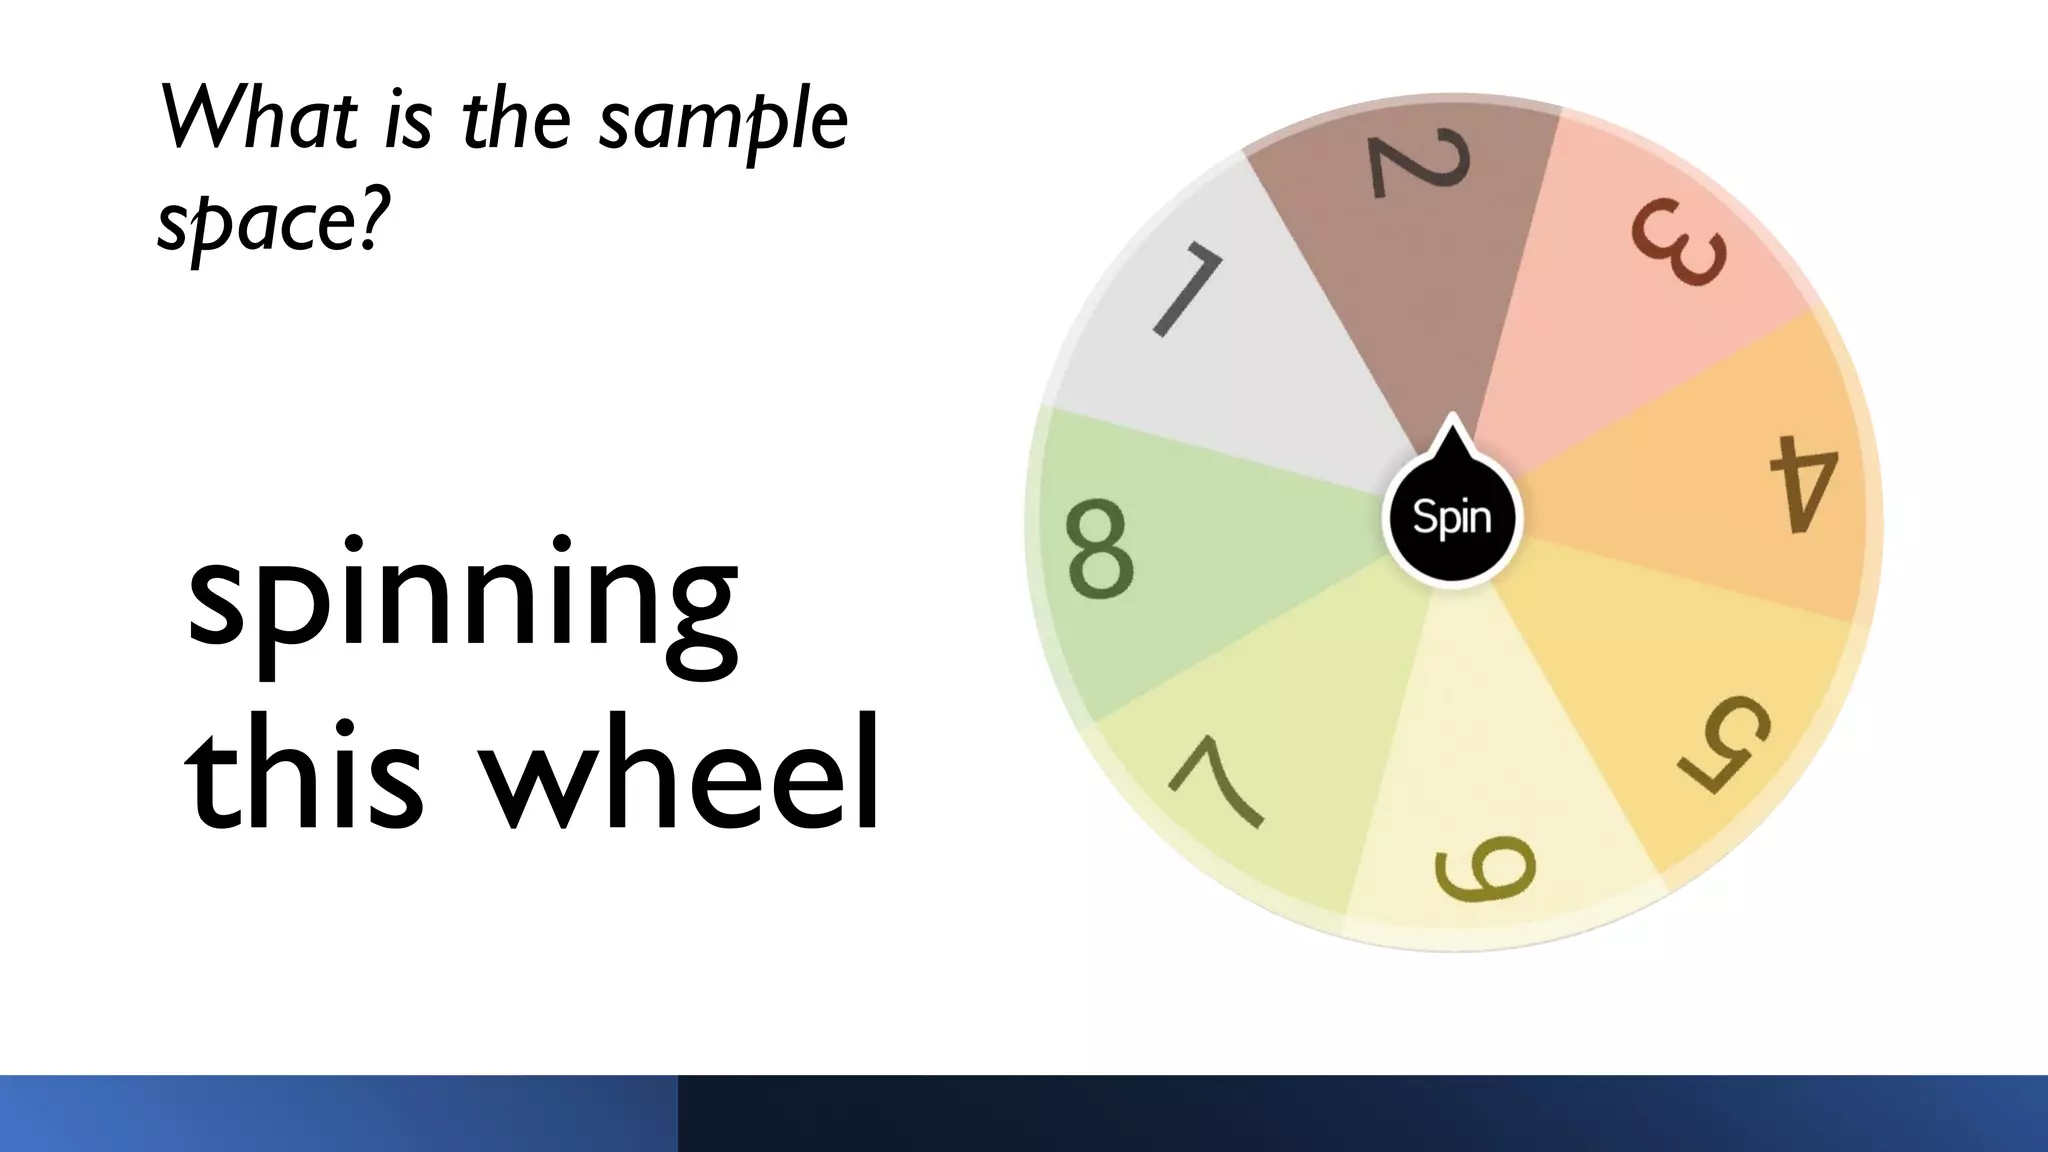
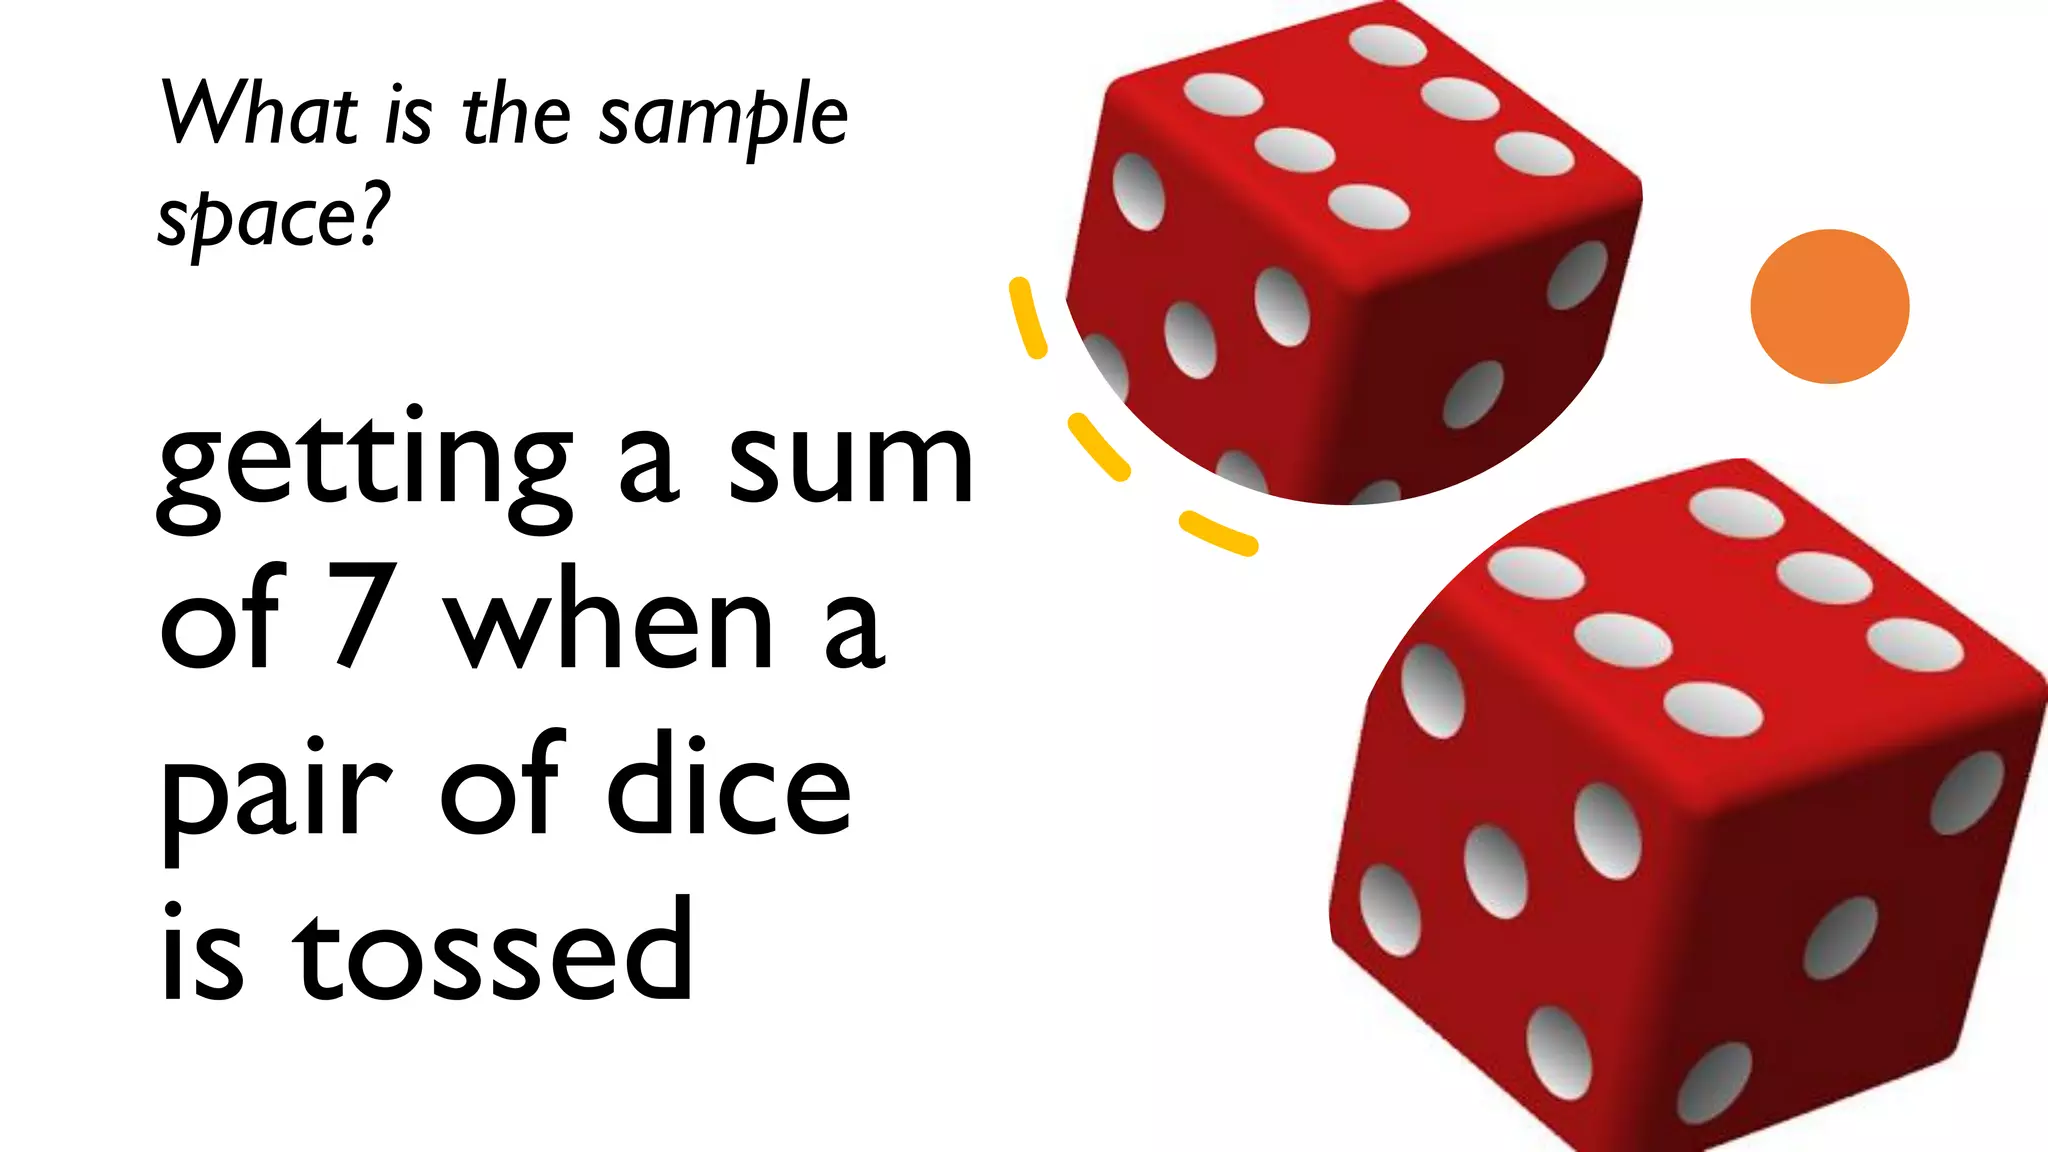
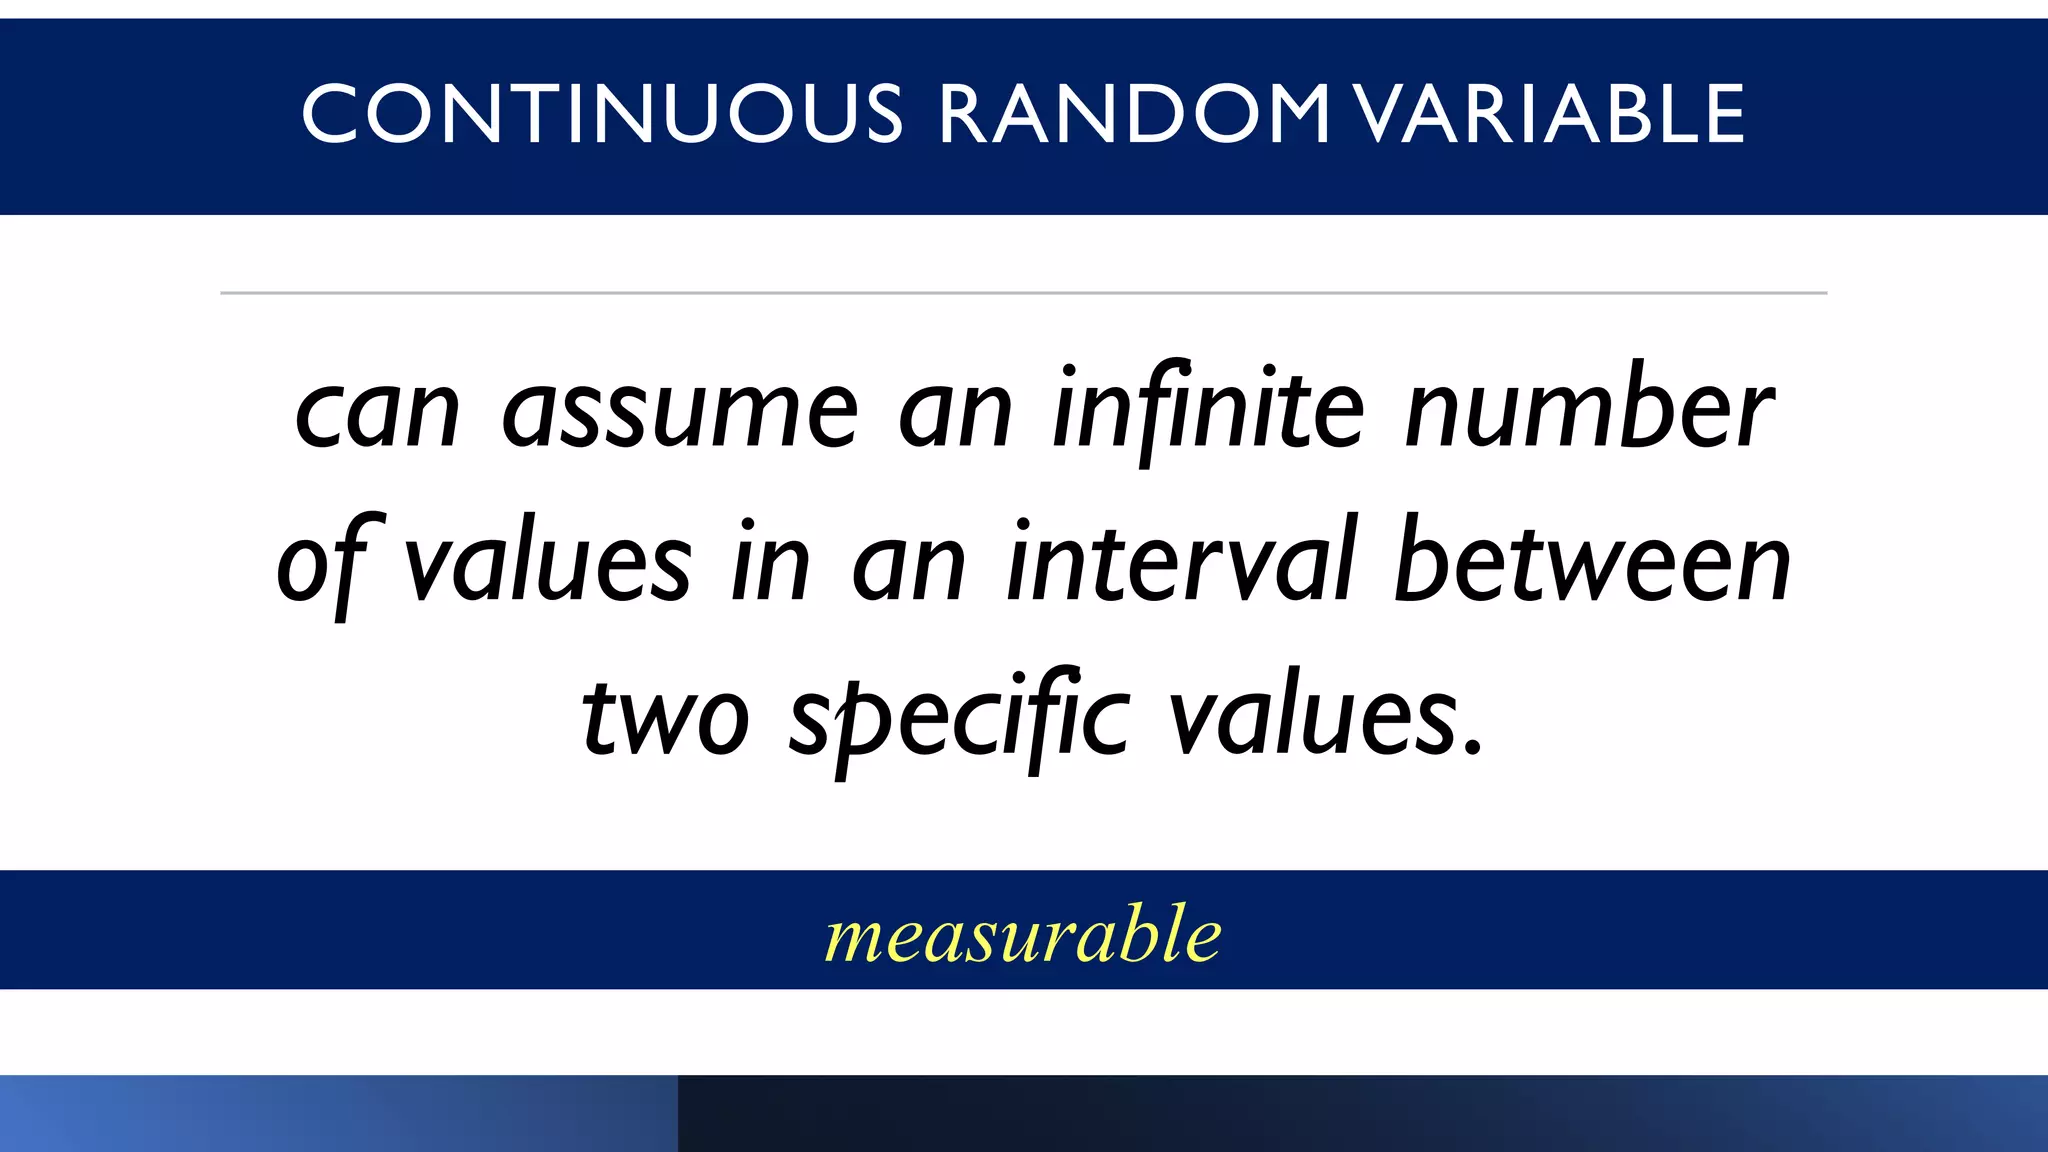
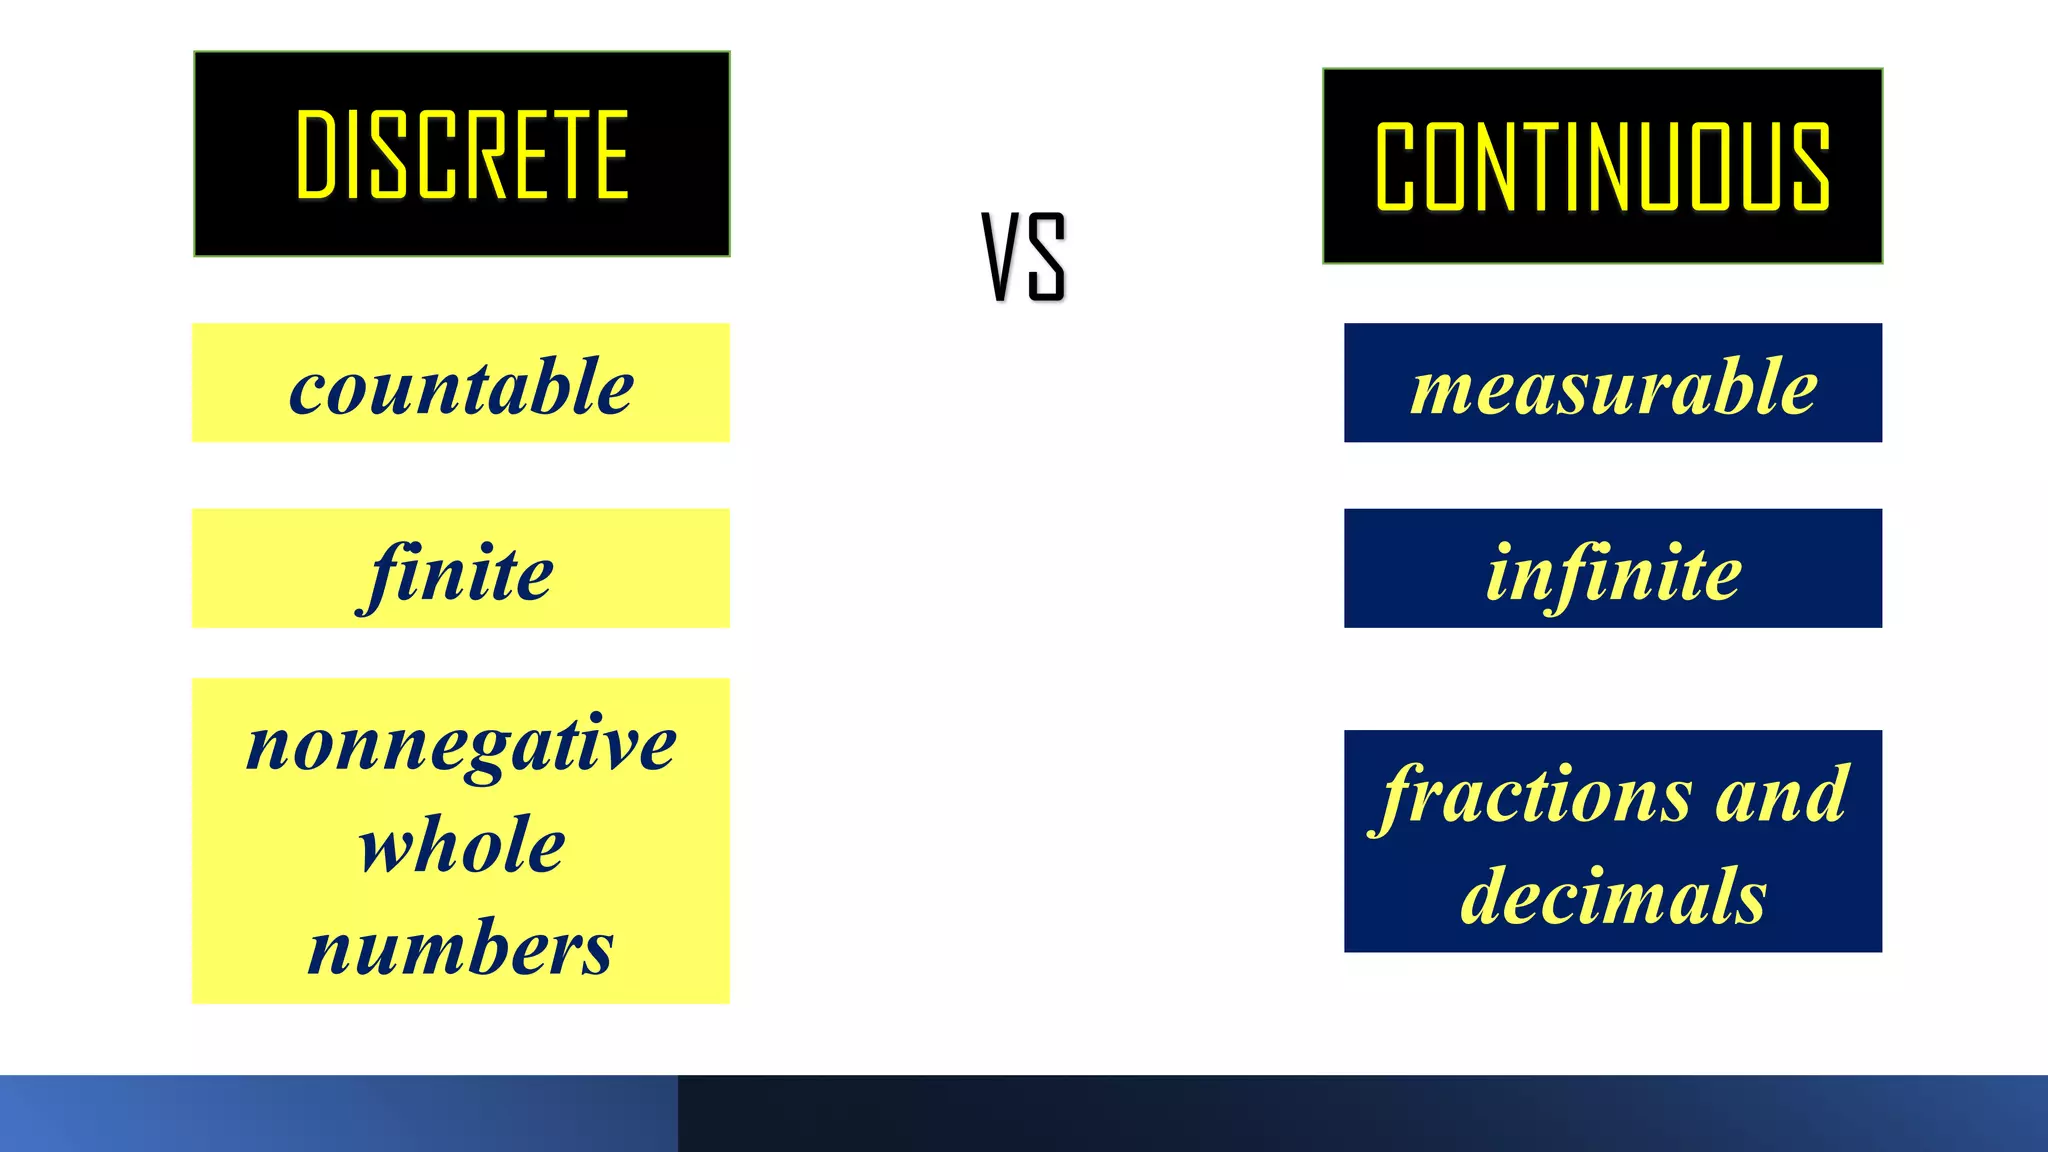
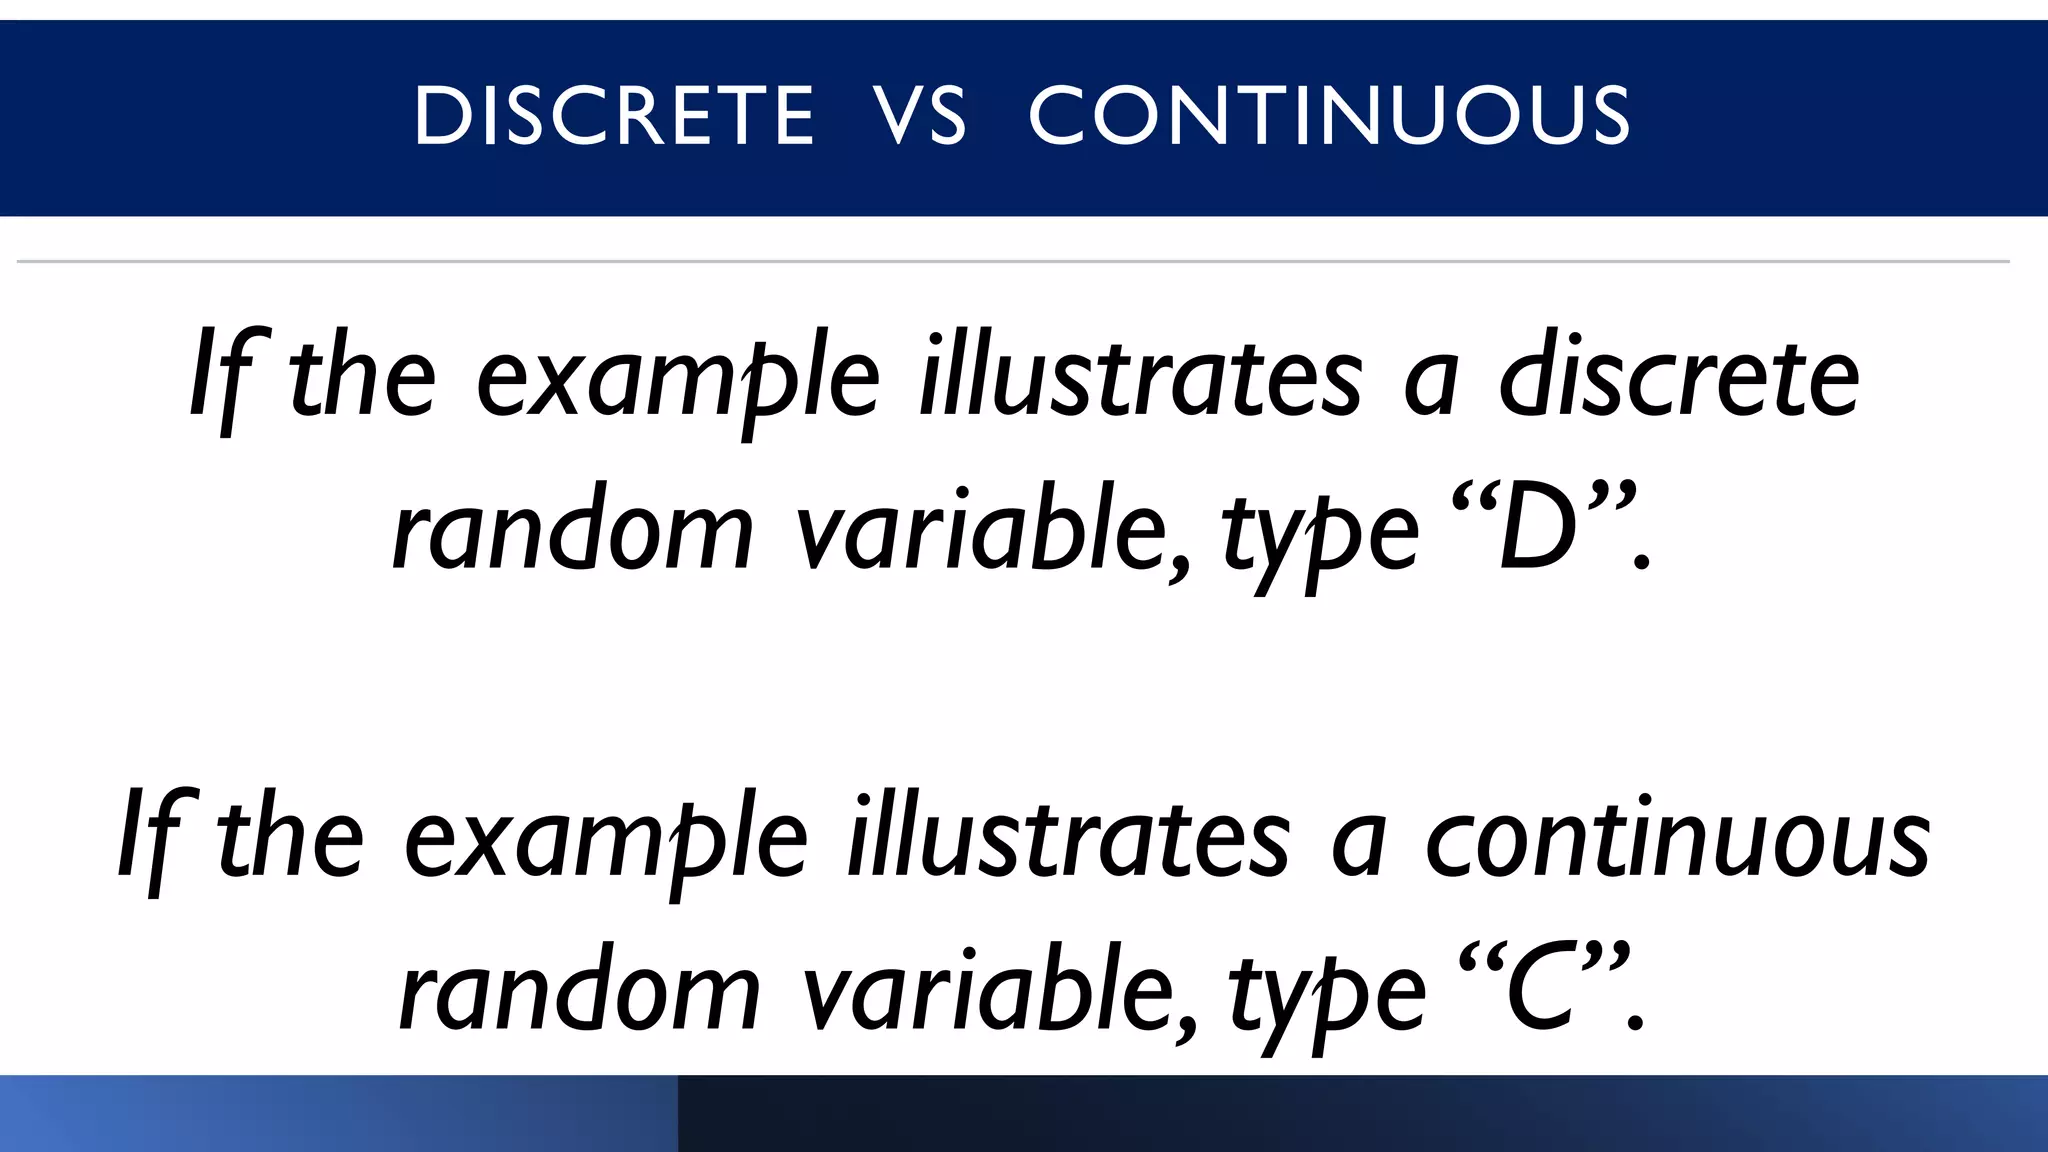
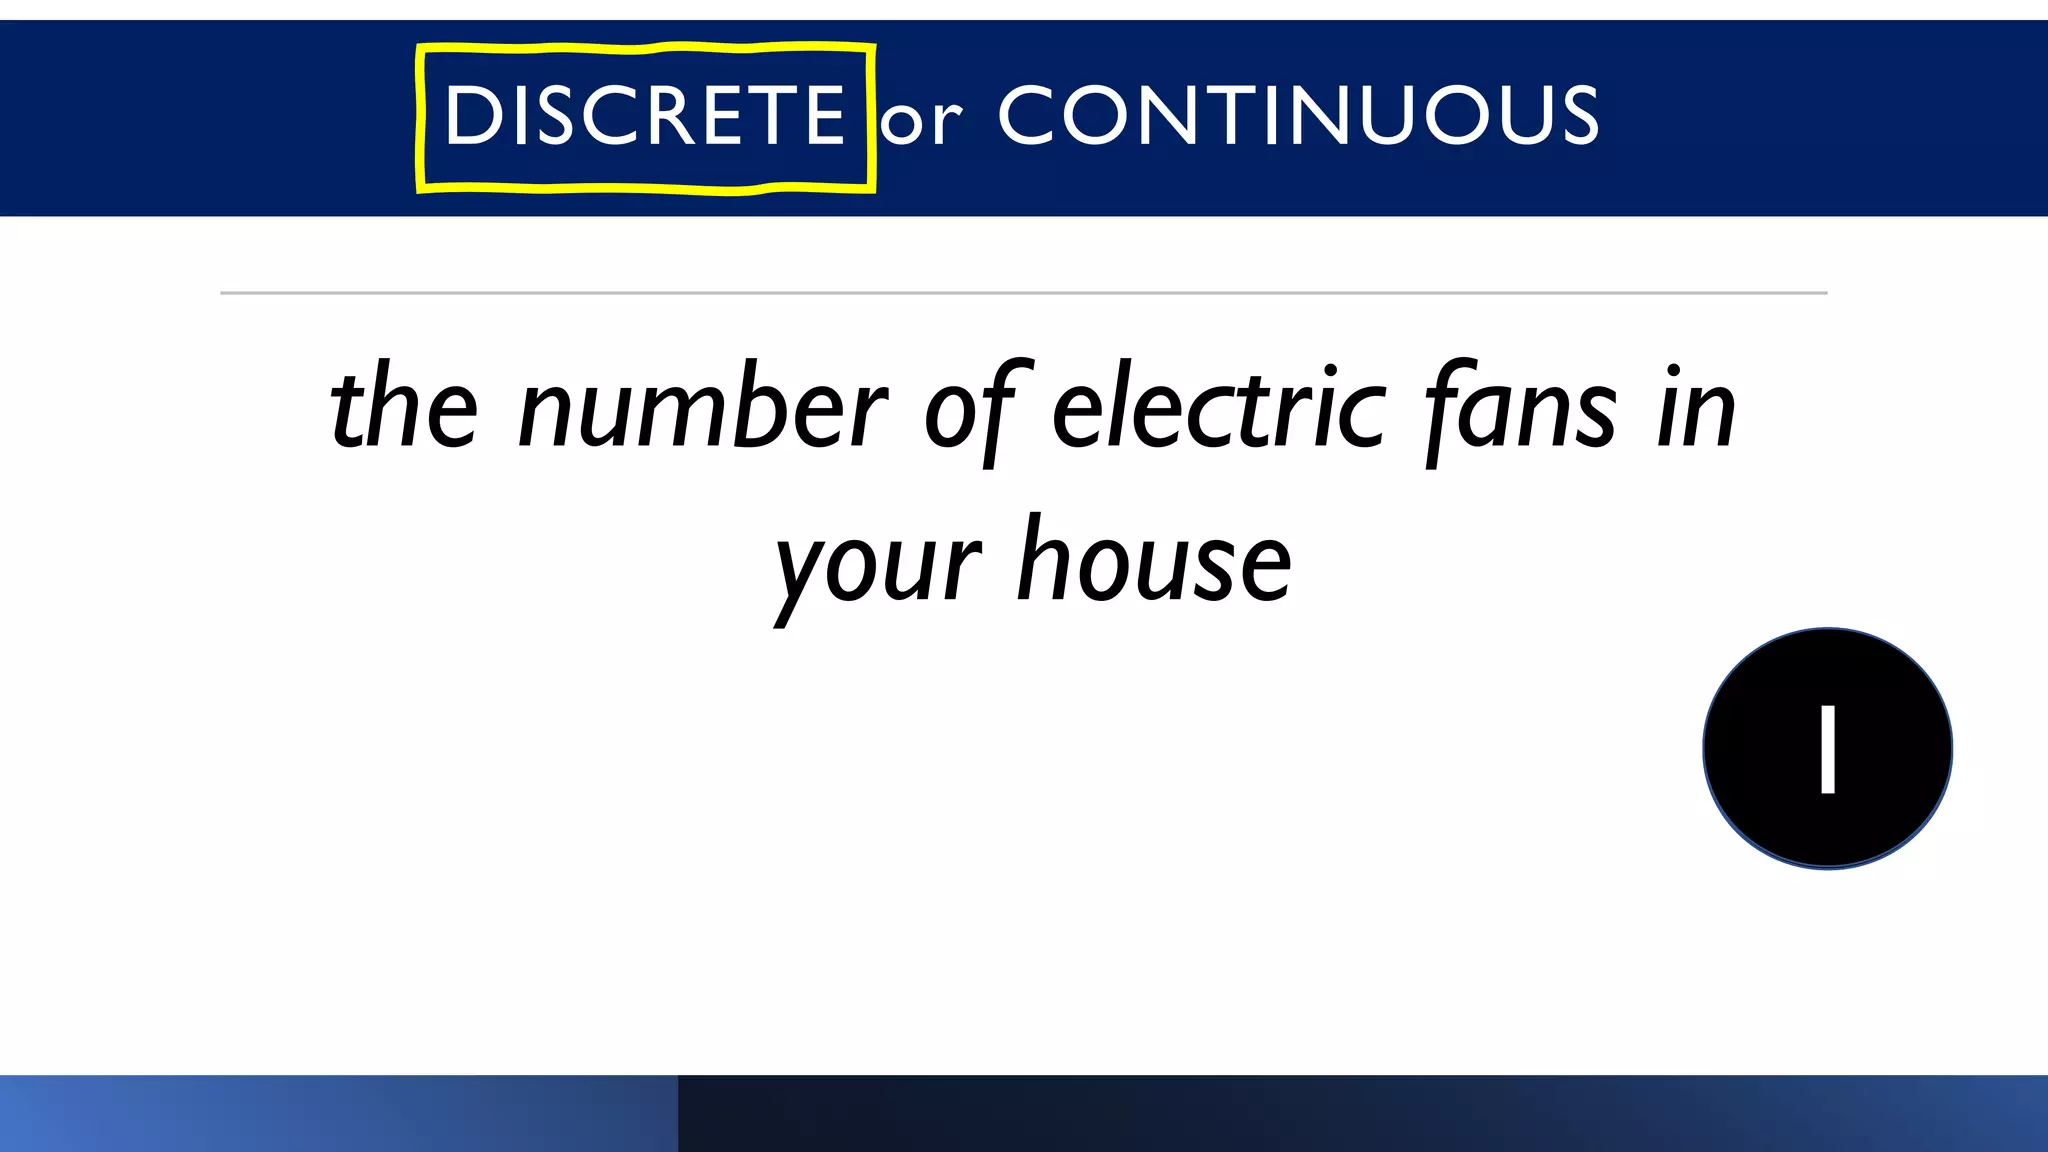
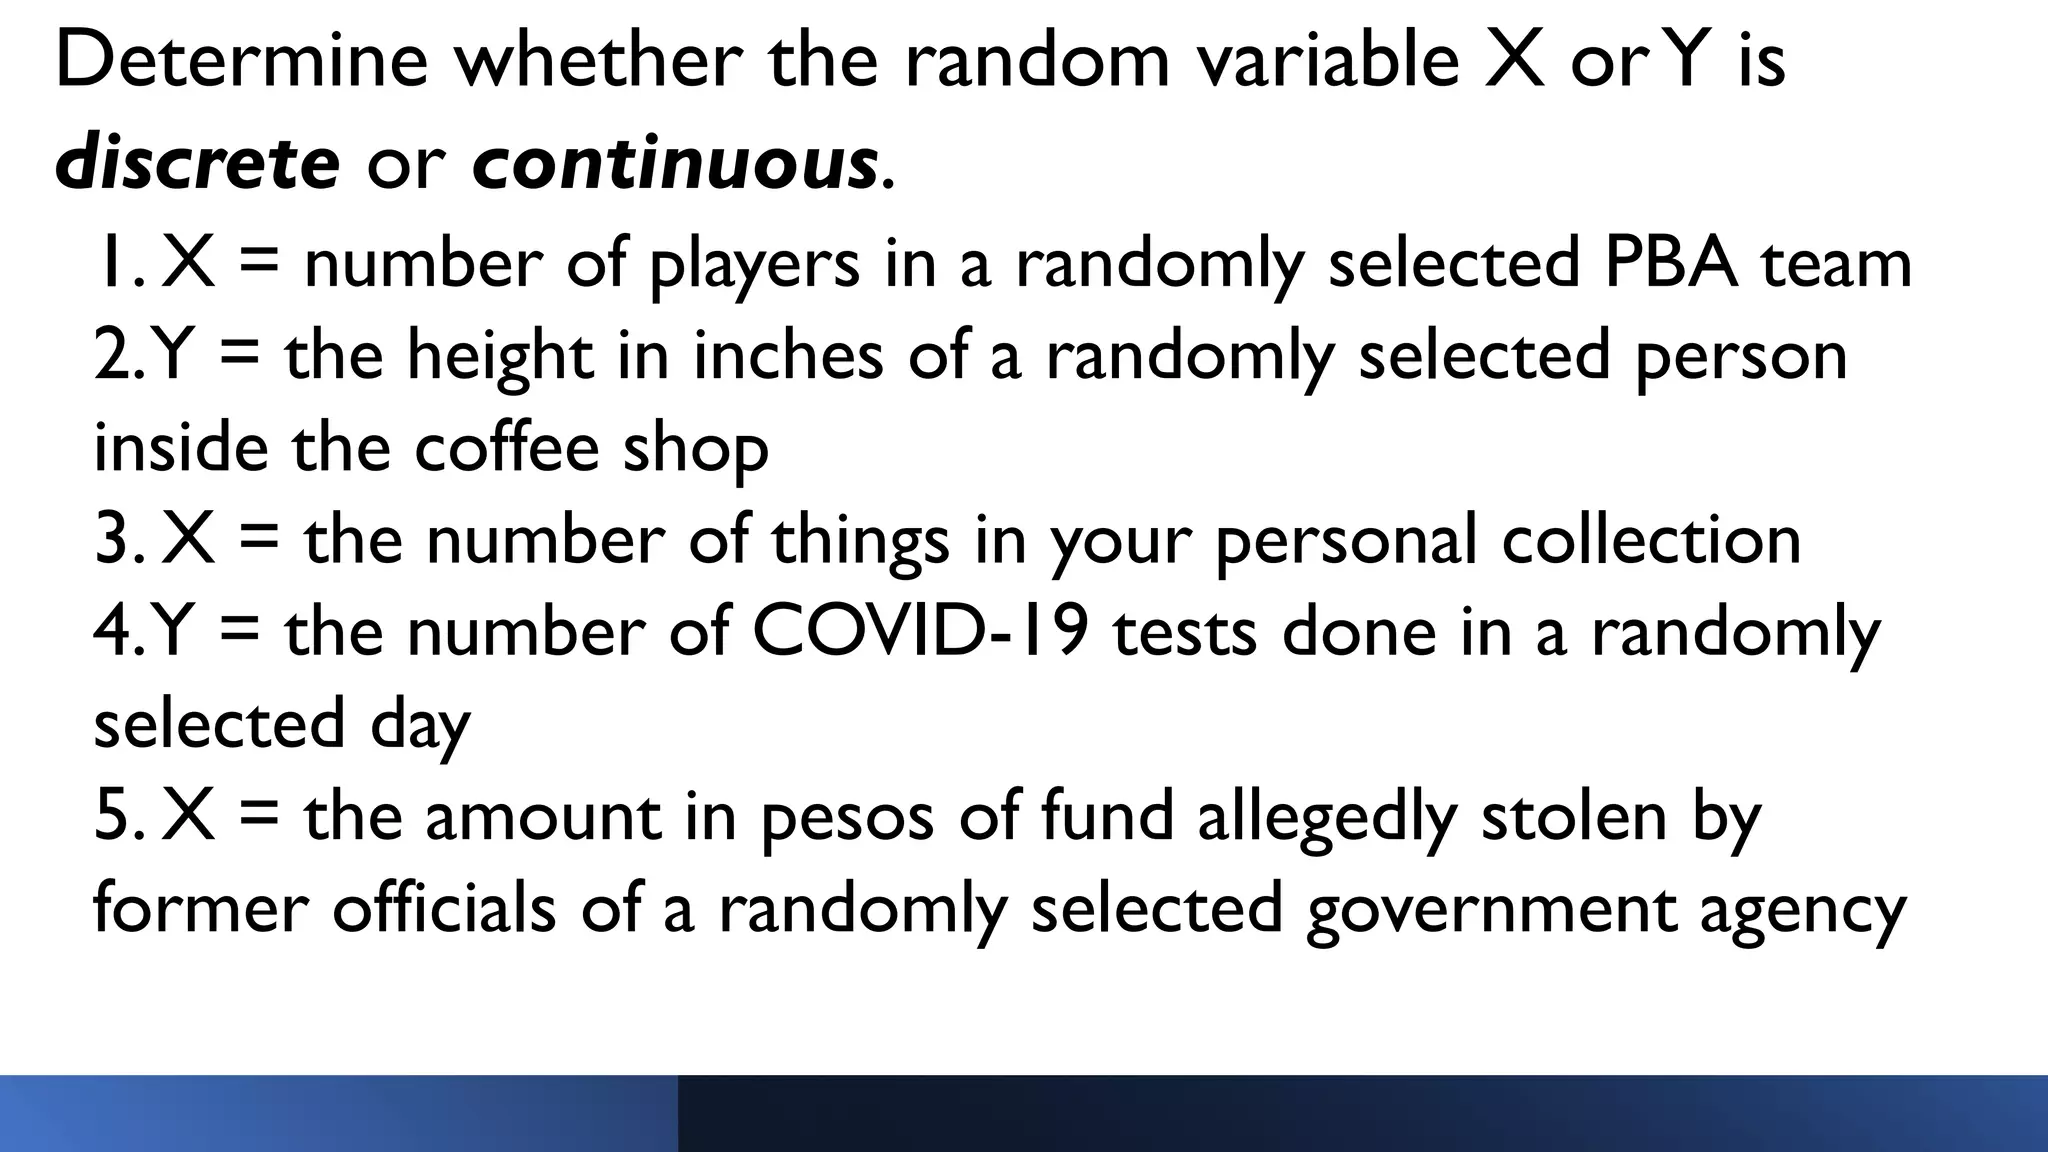
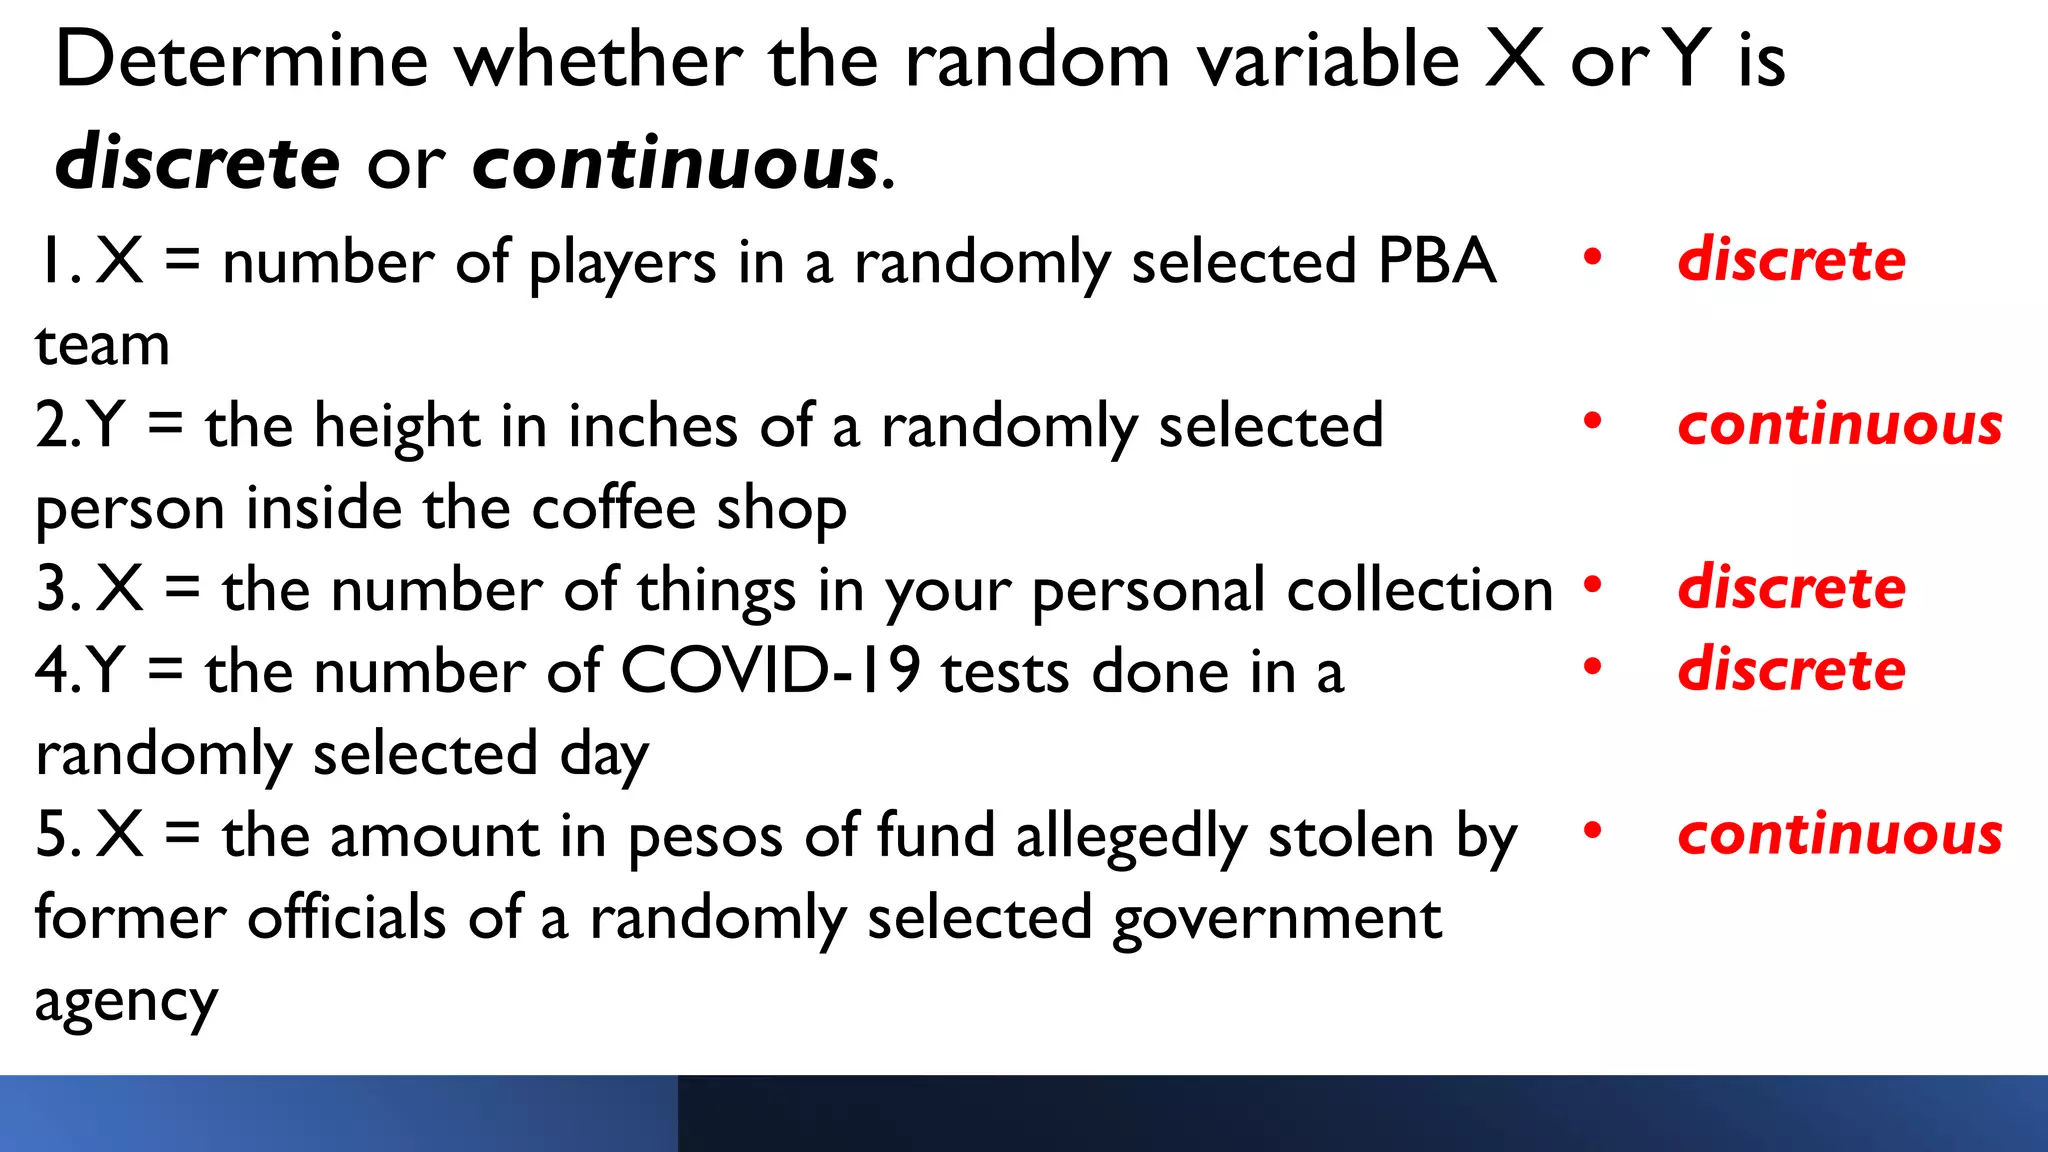

The document discusses statistics and probability concepts, focusing on random variables which can be discrete or continuous. It defines statistical experiments, sample spaces, and provides examples of determining the nature of various random variables. The content is intended for educational purposes, targeting understanding of basic statistical principles.