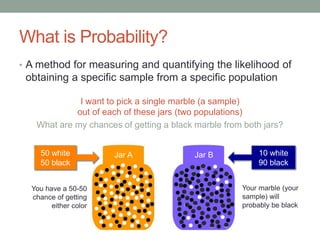
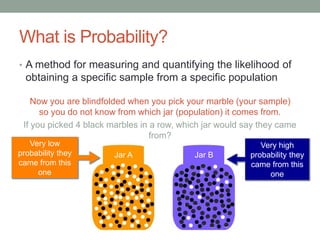
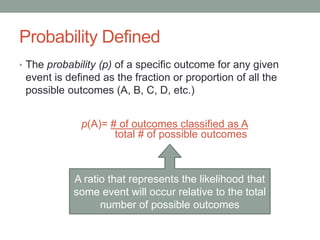
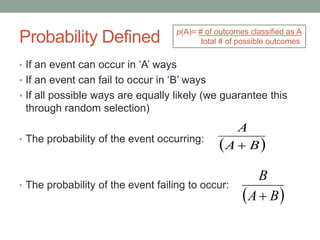
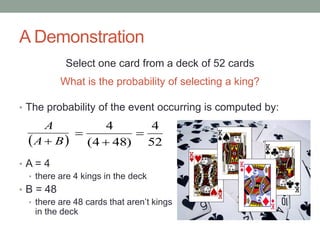
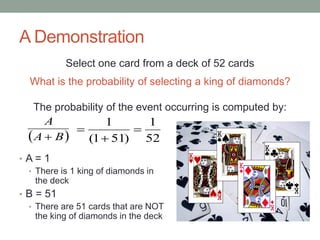
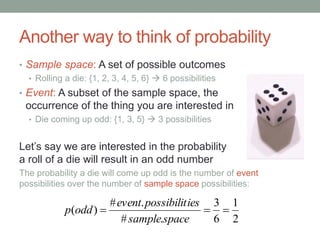
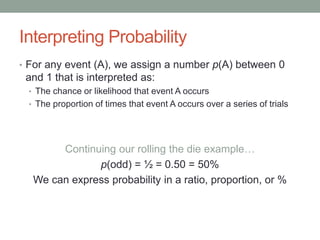
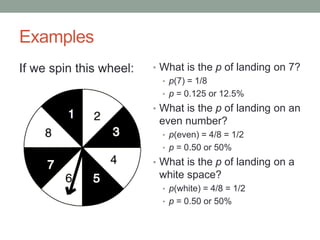
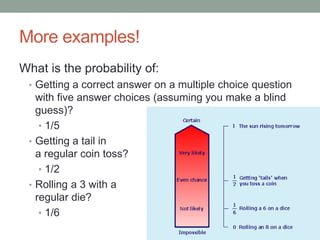
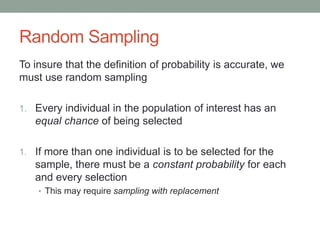
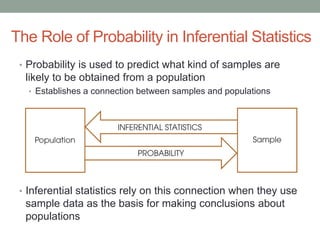
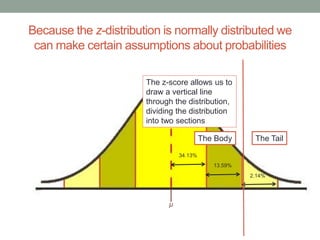
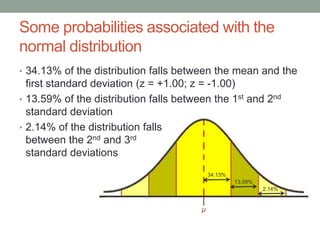
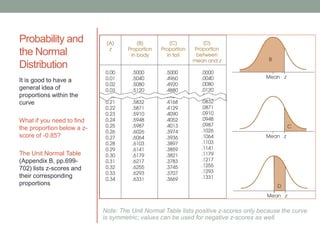
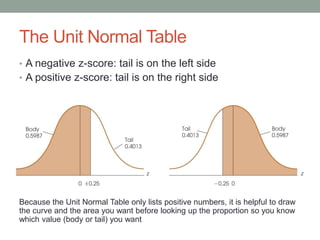
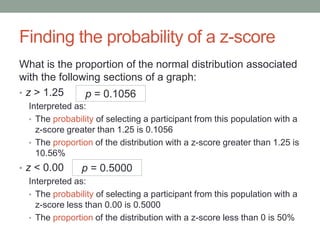
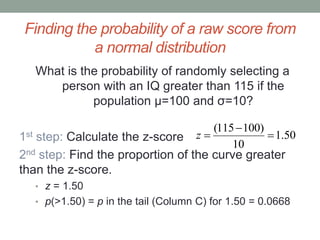
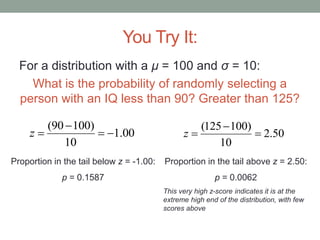
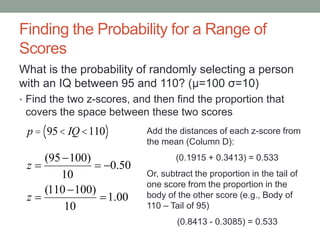
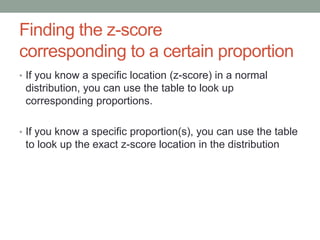
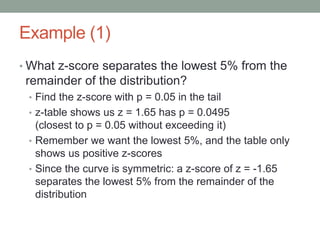
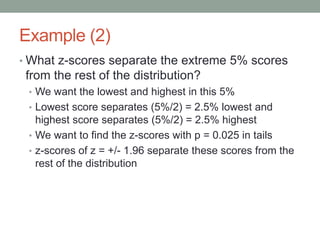
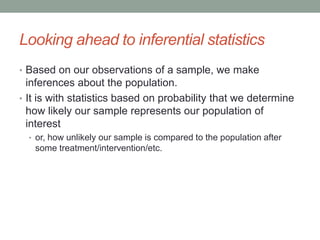
SlideShare a Scribd company logo
PROBABILITY
Behavioral Statistics
Summer 2017
Dr. Germano
What is Probability?
• A method for measuring and quantifying the likelihood of
obtaining a specific sample from a specific population
I want to pick a single marble (a sample)
out of each of these jars (two populations)
What are my chances of getting a black marble from both jars?
Jar A Jar B50 white
50 black
10 white
90 black
You have a 50-50
chance of getting
either color
Your marble (your
sample) will
probably be black
What is Probability?
• A method for measuring and quantifying the likelihood of
obtaining a specific sample from a specific population
Now you are blindfolded when you pick your marble (your sample)
so you do not know from which jar (population) it comes from.
If you picked 4 black marbles in a row, which jar would say they came
from?
Jar A Jar B
Very high
probability they
came from this
one
Very low
probability they
came from this
one
Probability Defined
• The probability (p) of a specific outcome for any given
event is defined as the fraction or proportion of all the
possible outcomes (A, B, C, D, etc.)
p(A)= # of outcomes classified as A
total # of possible outcomes
A ratio that represents the likelihood that
some event will occur relative to the total
number of possible outcomes
Probability Defined
• If an event can occur in ‘A’ ways
• If an event can fail to occur in ‘B’ ways
• If all possible ways are equally likely (we guarantee this
through random selection)
• The probability of the event occurring:
• The probability of the event failing to occur:
 BA
A

 BA
B

p(A)= # of outcomes classified as A
total # of possible outcomes
A Demonstration
Select one card from a deck of 52 cards
What is the probability of selecting a king?
• The probability of the event occurring is computed by:
• A = 4
• there are 4 kings in the deck
• B = 48
• there are 48 cards that aren’t kings
in the deck
 BA
A
 52
4
)484(
4



A Demonstration
Select one card from a deck of 52 cards
What is the probability of selecting a king of diamonds?
The probability of the event occurring is computed by:
• A = 1
• There is 1 king of diamonds in
the deck
• B = 51
• There are 51 cards that are NOT
the king of diamonds in the deck
 BA
A
 52
1
)511(
1



Another way to think of probability
• Sample space: A set of possible outcomes
• Rolling a die: {1, 2, 3, 4, 5, 6}  6 possibilities
• Event: A subset of the sample space, the
occurrence of the thing you are interested in
• Die coming up odd: {1, 3, 5}  3 possibilities
Let’s say we are interested in the probability
a roll of a die will result in an odd number
The probability a die will come up odd is the number of event
possibilities over the number of sample space possibilities:
2
1
6
3
.#
.#
)( 
spacesample
iespossibilitevent
oddp
Interpreting Probability
• For any event (A), we assign a number p(A) between 0
and 1 that is interpreted as:
• The chance or likelihood that event A occurs
• The proportion of times that event A occurs over a series of trials
Continuing our rolling the die example…
p(odd) = ½ = 0.50 = 50%
We can express probability in a ratio, proportion, or %
Examples
If we spin this wheel: • What is the p of landing on 7?
• p(7) = 1/8
• p = 0.125 or 12.5%
• What is the p of landing on an
even number?
• p(even) = 4/8 = 1/2
• p = 0.50 or 50%
• What is the p of landing on a
white space?
• p(white) = 4/8 = 1/2
• p = 0.50 or 50%
More examples!
What is the probability of:
• Getting a correct answer on a multiple choice question
with five answer choices (assuming you make a blind
guess)?
• 1/5
• Getting a tail in
a regular coin toss?
• 1/2
• Rolling a 3 with a
regular die?
• 1/6
When is probability reliable?
• When you have a fair die, coin, roulette wheel, etc.
• There is an equal chance of every outcome
• If your coin is weighted to land on heads every time, the p(tail) is no
longer ½
To use probability in statistics, we must ensure that our
sample is chosen in a way to mirror this “fair chance”
Random Sampling
To insure that the definition of probability is accurate, we
must use random sampling
1. Every individual in the population of interest has an
equal chance of being selected
1. If more than one individual is to be selected for the
sample, there must be a constant probability for each
and every selection
• This may require sampling with replacement
An Example of Random Sampling
Imagine a large bag filled with coins.
The coins include half-dollars, quarters,
pennies, nickels, and dimes. You are
interested in estimating the weight of
this bag, but may not actually weigh every coin.
How would you estimate the weight?
Estimating the weight…
• Take a random sample of coins
• Every coin must have an equal chance
of being selected
• There must be a constant probability
for each and every selection
• Requires sampling with replacement
• Use this information to generalize what we might
expect the weight of the entire bag to be
The Role of Probability in Inferential Statistics
• Probability is used to predict what kind of samples are
likely to be obtained from a population
• Establishes a connection between samples and populations
• Inferential statistics rely on this connection when they use
sample data as the basis for making conclusions about
populations
Probability and Statistics
This is how we use probability in statistics
We think ‘backwards’ because we typically do not have the
population information
Based on the sample,
what do we estimate the
population to look like?
vs.
Based on the population’s
characteristics, what do we
estimate our sample to look like?
Probability and Frequency Distributions
• X: 1, 1, 2, 3, 3, 4, 4, 4, 5, 6
• N = 10
If I sample n = 1:
• p(X < 2)?
• 2/10 = 1/5
• p(X > 3)?
• 5/10 = 1/2
• p(X = 3)?
• 2/10 = 1/5
PROBABILITY AND THE
NORMAL DISTRIBUTION
68.26%
94.46%
99.73%
Probability and the Normal Distribution
We can describe a normal distribution by the
proportions of area contained in each section
• Symmetric: Proportions on the right side will correspond
to the mirror image on the left
• Since we can identify sections with
z-scores, these proportions
correspond to any normal
distribution (regardless of
actual mean and standard
deviation values)
μ
34.13%
13.59%
2.14%
Because the z-distribution is normally distributed we
can make certain assumptions about probabilities
The z-score allows us to
draw a vertical line
through the distribution,
dividing the distribution
into two sections
The Body The Tail
μ
34.13%
13.59%
2.14%
Some probabilities associated with the
normal distribution
• 34.13% of the distribution falls between the mean and the
first standard deviation (z = +1.00; z = -1.00)
• 13.59% of the distribution falls between the 1st and 2nd
standard deviation
• 2.14% of the distribution falls
between the 2nd and 3rd
standard deviations
Probability and
the Normal
Distribution
It is good to have a
general idea of
proportions within the
curve
What if you need to find
the proportion below a z-
score of -0.85?
The Unit Normal Table
(Appendix B, pp.699-
702) lists z-scores and
their corresponding
proportions
Note: The Unit Normal Table lists positive z-scores only because the curve
is symmetric; values can be used for negative z-scores as well.
The Unit Normal Table
• A negative z-score: tail is on the left side
• A positive z-score: tail is on the right side
Because the Unit Normal Table only lists positive numbers, it is helpful to draw
the curve and the area you want before looking up the proportion so you know
which value (body or tail) you want
Finding the probability of a z-score
What is the proportion of the normal distribution associated
with the following sections of a graph:
• z > 1.25
Interpreted as:
• The probability of selecting a participant from this population with a
z-score greater than 1.25 is 0.1056
• The proportion of the distribution with a z-score greater than 1.25 is
10.56%
• z < 0.00
Interpreted as:
• The probability of selecting a participant from this population with a
z-score less than 0.00 is 0.5000
• The proportion of the distribution with a z-score less than 0 is 50%
p = 0.1056
p = 0.5000
PROBABILITIES AND
PROPORTIONS FOR SCORES
from a Normal Distribution
Finding the probability of a raw score from
a normal distribution
What is the probability of randomly selecting a
person with an IQ greater than 115 if the
population μ=100 and σ=10?
1st step: Calculate the z-score
2nd step: Find the proportion of the curve greater
than the z-score.
• z = 1.50
• p(>1.50) = p in the tail (Column C) for 1.50 = 0.0668
50.1
10
)100115(


z
You Try It:
For a distribution with a μ = 100 and σ = 10:
What is the probability of randomly selecting a
person with an IQ less than 90? Greater than 125?
00.1
10
)10090(


z 50.2
10
)100125(


z
Proportion in the tail above z = 2.50:
p = 0.0062
This very high z-score indicates it is at the
extreme high end of the distribution, with few
scores above
Proportion in the tail below z = -1.00:
p = 0.1587
Finding the Probability for a Range of
Scores
What is the probability of randomly selecting a person
with an IQ between 95 and 110? (μ=100 σ=10)
• Find the two z-scores, and then find the proportion that
covers the space between these two scores
00.1
10
)100110(
50.0
10
)10095(






z
z
Add the distances of each z-score from
the mean (Column D):
(0.1915 + 0.3413) = 0.533
Or, subtract the proportion in the tail of
one score from the proportion in the
body of the other score (e.g., Body of
110 – Tail of 95)
(0.8413 - 0.3085) = 0.533
p = 95< IQ <110( )
Finding the z-score
corresponding to a certain proportion
• If you know a specific location (z-score) in a normal
distribution, you can use the table to look up
corresponding proportions.
• If you know a specific proportion(s), you can use the table
to look up the exact z-score location in the distribution
Example (1)
• What z-score separates the lowest 5% from the
remainder of the distribution?
• Find the z-score with p = 0.05 in the tail
• z-table shows us z = 1.65 has p = 0.0495
(closest to p = 0.05 without exceeding it)
• Remember we want the lowest 5%, and the table only
shows us positive z-scores
• Since the curve is symmetric: a z-score of z = -1.65
separates the lowest 5% from the remainder of the
distribution
Example (2)
• What z-scores separate the extreme 5% scores
from the rest of the distribution?
• We want the lowest and highest in this 5%
• Lowest score separates (5%/2) = 2.5% lowest and
highest score separates (5%/2) = 2.5% highest
• We want to find the z-scores with p = 0.025 in tails
• z-scores of z = +/- 1.96 separate these scores from the
rest of the distribution
Solving for a specific score:
• If I want the top 10%, what is the cutoff score?
(μ = 100 σ = 15)
• z-score that separates p = .0100 closest without
going over is z = 1.29
• Now I want to solve for X to find the cutoff score
2.1191002.19100)15(28.1  zX
Recall from earlier, we can express cumulative
percentages as percentile ranks.
To find the 84th percentile we would find the score that separates p = 0.8400
below (body) and p = 0.1600 above (tail). (approximately z = 0.99)
Looking ahead to inferential statistics
• Based on our observations of a sample, we make
inferences about the population.
• It is with statistics based on probability that we determine
how likely our sample represents our population of
interest
• or, how unlikely our sample is compared to the population after
some treatment/intervention/etc.

More Related Content

What's hot

Introduction to Hypothesis Testing
Introduction to Hypothesis TestingIntroduction to Hypothesis Testing
Introduction to Hypothesis Testing
jasondroesch
 
Probability and Samples: The Distribution of Sample Means
Probability and Samples: The Distribution of Sample MeansProbability and Samples: The Distribution of Sample Means
Probability and Samples: The Distribution of Sample Means
jasondroesch
 
The t Test for Two Related Samples
The t Test for Two Related SamplesThe t Test for Two Related Samples
The t Test for Two Related Samples
jasondroesch
 
Basic statistics for algorithmic trading
Basic statistics for algorithmic tradingBasic statistics for algorithmic trading
Basic statistics for algorithmic trading
QuantInsti
 
Choosing the right statistics
Choosing the right statisticsChoosing the right statistics
Choosing the right statistics
Kaori Kubo Germano, PhD
 
Central tendency and Variation or Dispersion
Central tendency and Variation or DispersionCentral tendency and Variation or Dispersion
Central tendency and Variation or Dispersion
Johny Kutty Joseph
 
Analysis of Variance
Analysis of VarianceAnalysis of Variance
Analysis of Variance
Kaori Kubo Germano, PhD
 
Chapter 5 part2- Sampling Distributions for Counts and Proportions (Binomial ...
Chapter 5 part2- Sampling Distributions for Counts and Proportions (Binomial ...Chapter 5 part2- Sampling Distributions for Counts and Proportions (Binomial ...
Chapter 5 part2- Sampling Distributions for Counts and Proportions (Binomial ...
nszakir
 
Statistics - Basics
Statistics - BasicsStatistics - Basics
Statistics - Basics
Andrew Ferlitsch
 
Data sampling and probability
Data sampling and probabilityData sampling and probability
Data sampling and probability
Avjinder (Avi) Kaler
 
Data Distribution &The Probability Distributions
Data Distribution &The Probability DistributionsData Distribution &The Probability Distributions
Data Distribution &The Probability Distributions
mahaaltememe
 
Measures of Central Tendency
Measures of Central TendencyMeasures of Central Tendency
Measures of Central Tendency
jasondroesch
 
Measures of relationship
Measures of relationshipMeasures of relationship
Measures of relationship
Johny Kutty Joseph
 
Chapter 3 sampling and sampling distribution
Chapter 3   sampling and sampling distributionChapter 3   sampling and sampling distribution
Chapter 3 sampling and sampling distribution
Antonio F. Balatar Jr.
 
One Sample T Test
One Sample T TestOne Sample T Test
One Sample T Testshoffma5
 
The t Test for Two Independent Samples
The t Test for Two Independent SamplesThe t Test for Two Independent Samples
The t Test for Two Independent Samples
jasondroesch
 
Introduction to Statistics
Introduction to StatisticsIntroduction to Statistics
Introduction to Statistics
jasondroesch
 
Sampling distributions stat ppt @ bec doms
Sampling distributions stat ppt @ bec domsSampling distributions stat ppt @ bec doms
Sampling distributions stat ppt @ bec doms
Babasab Patil
 
Statistics lecture 7 (ch6)
Statistics lecture 7 (ch6)Statistics lecture 7 (ch6)
Statistics lecture 7 (ch6)
jillmitchell8778
 

What's hot (20)

Introduction to Hypothesis Testing
Introduction to Hypothesis TestingIntroduction to Hypothesis Testing
Introduction to Hypothesis Testing
 
Probability and Samples: The Distribution of Sample Means
Probability and Samples: The Distribution of Sample MeansProbability and Samples: The Distribution of Sample Means
Probability and Samples: The Distribution of Sample Means
 
Stats - Intro to Quantitative
Stats -  Intro to Quantitative Stats -  Intro to Quantitative
Stats - Intro to Quantitative
 
The t Test for Two Related Samples
The t Test for Two Related SamplesThe t Test for Two Related Samples
The t Test for Two Related Samples
 
Basic statistics for algorithmic trading
Basic statistics for algorithmic tradingBasic statistics for algorithmic trading
Basic statistics for algorithmic trading
 
Choosing the right statistics
Choosing the right statisticsChoosing the right statistics
Choosing the right statistics
 
Central tendency and Variation or Dispersion
Central tendency and Variation or DispersionCentral tendency and Variation or Dispersion
Central tendency and Variation or Dispersion
 
Analysis of Variance
Analysis of VarianceAnalysis of Variance
Analysis of Variance
 
Chapter 5 part2- Sampling Distributions for Counts and Proportions (Binomial ...
Chapter 5 part2- Sampling Distributions for Counts and Proportions (Binomial ...Chapter 5 part2- Sampling Distributions for Counts and Proportions (Binomial ...
Chapter 5 part2- Sampling Distributions for Counts and Proportions (Binomial ...
 
Statistics - Basics
Statistics - BasicsStatistics - Basics
Statistics - Basics
 
Data sampling and probability
Data sampling and probabilityData sampling and probability
Data sampling and probability
 
Data Distribution &The Probability Distributions
Data Distribution &The Probability DistributionsData Distribution &The Probability Distributions
Data Distribution &The Probability Distributions
 
Measures of Central Tendency
Measures of Central TendencyMeasures of Central Tendency
Measures of Central Tendency
 
Measures of relationship
Measures of relationshipMeasures of relationship
Measures of relationship
 
Chapter 3 sampling and sampling distribution
Chapter 3   sampling and sampling distributionChapter 3   sampling and sampling distribution
Chapter 3 sampling and sampling distribution
 
One Sample T Test
One Sample T TestOne Sample T Test
One Sample T Test
 
The t Test for Two Independent Samples
The t Test for Two Independent SamplesThe t Test for Two Independent Samples
The t Test for Two Independent Samples
 
Introduction to Statistics
Introduction to StatisticsIntroduction to Statistics
Introduction to Statistics
 
Sampling distributions stat ppt @ bec doms
Sampling distributions stat ppt @ bec domsSampling distributions stat ppt @ bec doms
Sampling distributions stat ppt @ bec doms
 
Statistics lecture 7 (ch6)
Statistics lecture 7 (ch6)Statistics lecture 7 (ch6)
Statistics lecture 7 (ch6)
 

Similar to Probablity

Introduction to Probability
Introduction to ProbabilityIntroduction to Probability
Introduction to ProbabilityTodd Bill
 
introduction to probability
introduction to probabilityintroduction to probability
introduction to probabilityTodd Bill
 
Probability and Statistics - Week 1
Probability and Statistics - Week 1Probability and Statistics - Week 1
Probability and Statistics - Week 1
Ferdin Joe John Joseph PhD
 
Probability Theory for Data Scientists
Probability Theory for Data ScientistsProbability Theory for Data Scientists
Probability Theory for Data Scientists
Ferdin Joe John Joseph PhD
 
Stat.pptx
Stat.pptxStat.pptx
Stat.pptx
ValDarylAnhao2
 
lesson4-intrduction to probability grade10
lesson4-intrduction to probability grade10lesson4-intrduction to probability grade10
lesson4-intrduction to probability grade10
CharlesIanVArnado
 
Intro to probability
Intro to probabilityIntro to probability
Intro to probability
getyourcheaton
 
SAMPLE SPACES and PROBABILITY (3).pptx
SAMPLE SPACES and PROBABILITY (3).pptxSAMPLE SPACES and PROBABILITY (3).pptx
SAMPLE SPACES and PROBABILITY (3).pptx
victormiralles2
 
INTRODUCTION TO PROBABILITY.pptx
INTRODUCTION TO   PROBABILITY.pptxINTRODUCTION TO   PROBABILITY.pptx
INTRODUCTION TO PROBABILITY.pptx
Farhana Shaheen
 
5. RV and Distributions.pptx
5. RV and Distributions.pptx5. RV and Distributions.pptx
5. RV and Distributions.pptx
SaiMohnishMuralidhar
 
Discrete Probability Distributions
Discrete Probability DistributionsDiscrete Probability Distributions
Discrete Probability Distributionsmandalina landy
 
1 - Probabilty Introduction .ppt
1 - Probabilty Introduction .ppt1 - Probabilty Introduction .ppt
1 - Probabilty Introduction .ppt
Vivek Bhartiya
 
Binomial,Poisson,Geometric,Normal distribution
Binomial,Poisson,Geometric,Normal distributionBinomial,Poisson,Geometric,Normal distribution
Binomial,Poisson,Geometric,Normal distribution
Bharath kumar Karanam
 
Unit 1-probability
Unit 1-probabilityUnit 1-probability
Unit 1-probability
Rai University
 
random variable and distribution
random variable and distributionrandom variable and distribution
random variable and distribution
lovemucheca
 
Frequency Distributions
Frequency DistributionsFrequency Distributions
Frequency Distributions
Kaori Kubo Germano, PhD
 
vdocuments.mx_chapter-5-probability-distributions-56a36d9fddc1e.ppt
vdocuments.mx_chapter-5-probability-distributions-56a36d9fddc1e.pptvdocuments.mx_chapter-5-probability-distributions-56a36d9fddc1e.ppt
vdocuments.mx_chapter-5-probability-distributions-56a36d9fddc1e.ppt
CharlesElquimeGalapo
 
Probabilityof Simple Event.pptx abcdefgh
Probabilityof Simple Event.pptx abcdefghProbabilityof Simple Event.pptx abcdefgh
Probabilityof Simple Event.pptx abcdefgh
RYANCENRIQUEZ
 
PROBABILITY THEORIES.pptx
PROBABILITY THEORIES.pptxPROBABILITY THEORIES.pptx
PROBABILITY THEORIES.pptx
MarcJoshuaGorospe
 
Statistical thinking
Statistical thinkingStatistical thinking
Statistical thinking
mij1120
 

Similar to Probablity (20)

Introduction to Probability
Introduction to ProbabilityIntroduction to Probability
Introduction to Probability
 
introduction to probability
introduction to probabilityintroduction to probability
introduction to probability
 
Probability and Statistics - Week 1
Probability and Statistics - Week 1Probability and Statistics - Week 1
Probability and Statistics - Week 1
 
Probability Theory for Data Scientists
Probability Theory for Data ScientistsProbability Theory for Data Scientists
Probability Theory for Data Scientists
 
Stat.pptx
Stat.pptxStat.pptx
Stat.pptx
 
lesson4-intrduction to probability grade10
lesson4-intrduction to probability grade10lesson4-intrduction to probability grade10
lesson4-intrduction to probability grade10
 
Intro to probability
Intro to probabilityIntro to probability
Intro to probability
 
SAMPLE SPACES and PROBABILITY (3).pptx
SAMPLE SPACES and PROBABILITY (3).pptxSAMPLE SPACES and PROBABILITY (3).pptx
SAMPLE SPACES and PROBABILITY (3).pptx
 
INTRODUCTION TO PROBABILITY.pptx
INTRODUCTION TO   PROBABILITY.pptxINTRODUCTION TO   PROBABILITY.pptx
INTRODUCTION TO PROBABILITY.pptx
 
5. RV and Distributions.pptx
5. RV and Distributions.pptx5. RV and Distributions.pptx
5. RV and Distributions.pptx
 
Discrete Probability Distributions
Discrete Probability DistributionsDiscrete Probability Distributions
Discrete Probability Distributions
 
1 - Probabilty Introduction .ppt
1 - Probabilty Introduction .ppt1 - Probabilty Introduction .ppt
1 - Probabilty Introduction .ppt
 
Binomial,Poisson,Geometric,Normal distribution
Binomial,Poisson,Geometric,Normal distributionBinomial,Poisson,Geometric,Normal distribution
Binomial,Poisson,Geometric,Normal distribution
 
Unit 1-probability
Unit 1-probabilityUnit 1-probability
Unit 1-probability
 
random variable and distribution
random variable and distributionrandom variable and distribution
random variable and distribution
 
Frequency Distributions
Frequency DistributionsFrequency Distributions
Frequency Distributions
 
vdocuments.mx_chapter-5-probability-distributions-56a36d9fddc1e.ppt
vdocuments.mx_chapter-5-probability-distributions-56a36d9fddc1e.pptvdocuments.mx_chapter-5-probability-distributions-56a36d9fddc1e.ppt
vdocuments.mx_chapter-5-probability-distributions-56a36d9fddc1e.ppt
 
Probabilityof Simple Event.pptx abcdefgh
Probabilityof Simple Event.pptx abcdefghProbabilityof Simple Event.pptx abcdefgh
Probabilityof Simple Event.pptx abcdefgh
 
PROBABILITY THEORIES.pptx
PROBABILITY THEORIES.pptxPROBABILITY THEORIES.pptx
PROBABILITY THEORIES.pptx
 
Statistical thinking
Statistical thinkingStatistical thinking
Statistical thinking
 

More from Kaori Kubo Germano, PhD

Hypothesis testing
Hypothesis testingHypothesis testing
Hypothesis testing
Kaori Kubo Germano, PhD
 
Chi square
Chi squareChi square
regression
regressionregression
Correlations
CorrelationsCorrelations
Factorial ANOVA
Factorial ANOVAFactorial ANOVA
Factorial ANOVA
Kaori Kubo Germano, PhD
 
Repeated Measures ANOVA
Repeated Measures ANOVARepeated Measures ANOVA
Repeated Measures ANOVA
Kaori Kubo Germano, PhD
 
Variability
VariabilityVariability
Behavioral Statistics Intro lecture
Behavioral Statistics Intro lectureBehavioral Statistics Intro lecture
Behavioral Statistics Intro lecture
Kaori Kubo Germano, PhD
 

More from Kaori Kubo Germano, PhD (8)

Hypothesis testing
Hypothesis testingHypothesis testing
Hypothesis testing
 
Chi square
Chi squareChi square
Chi square
 
regression
regressionregression
regression
 
Correlations
CorrelationsCorrelations
Correlations
 
Factorial ANOVA
Factorial ANOVAFactorial ANOVA
Factorial ANOVA
 
Repeated Measures ANOVA
Repeated Measures ANOVARepeated Measures ANOVA
Repeated Measures ANOVA
 
Variability
VariabilityVariability
Variability
 
Behavioral Statistics Intro lecture
Behavioral Statistics Intro lectureBehavioral Statistics Intro lecture
Behavioral Statistics Intro lecture
 

Recently uploaded

Natural birth techniques - Mrs.Akanksha Trivedi Rama University
Natural birth techniques - Mrs.Akanksha Trivedi Rama UniversityNatural birth techniques - Mrs.Akanksha Trivedi Rama University
Natural birth techniques - Mrs.Akanksha Trivedi Rama University
Akanksha trivedi rama nursing college kanpur.
 
Marketing internship report file for MBA
Marketing internship report file for MBAMarketing internship report file for MBA
Marketing internship report file for MBA
gb193092
 
Unit 2- Research Aptitude (UGC NET Paper I).pdf
Unit 2- Research Aptitude (UGC NET Paper I).pdfUnit 2- Research Aptitude (UGC NET Paper I).pdf
Unit 2- Research Aptitude (UGC NET Paper I).pdf
Thiyagu K
 
Introduction to AI for Nonprofits with Tapp Network
Introduction to AI for Nonprofits with Tapp NetworkIntroduction to AI for Nonprofits with Tapp Network
Introduction to AI for Nonprofits with Tapp Network
TechSoup
 
The Challenger.pdf DNHS Official Publication
The Challenger.pdf DNHS Official PublicationThe Challenger.pdf DNHS Official Publication
The Challenger.pdf DNHS Official Publication
Delapenabediema
 
Thesis Statement for students diagnonsed withADHD.ppt
Thesis Statement for students diagnonsed withADHD.pptThesis Statement for students diagnonsed withADHD.ppt
Thesis Statement for students diagnonsed withADHD.ppt
EverAndrsGuerraGuerr
 
special B.ed 2nd year old paper_20240531.pdf
special B.ed 2nd year old paper_20240531.pdfspecial B.ed 2nd year old paper_20240531.pdf
special B.ed 2nd year old paper_20240531.pdf
Special education needs
 
The Accursed House by Émile Gaboriau.pptx
The Accursed House by Émile Gaboriau.pptxThe Accursed House by Émile Gaboriau.pptx
The Accursed House by Émile Gaboriau.pptx
DhatriParmar
 
Pride Month Slides 2024 David Douglas School District
Pride Month Slides 2024 David Douglas School DistrictPride Month Slides 2024 David Douglas School District
Pride Month Slides 2024 David Douglas School District
David Douglas School District
 
How to Make a Field invisible in Odoo 17
How to Make a Field invisible in Odoo 17How to Make a Field invisible in Odoo 17
How to Make a Field invisible in Odoo 17
Celine George
 
Lapbook sobre os Regimes Totalitários.pdf
Lapbook sobre os Regimes Totalitários.pdfLapbook sobre os Regimes Totalitários.pdf
Lapbook sobre os Regimes Totalitários.pdf
Jean Carlos Nunes Paixão
 
A Survey of Techniques for Maximizing LLM Performance.pptx
A Survey of Techniques for Maximizing LLM Performance.pptxA Survey of Techniques for Maximizing LLM Performance.pptx
A Survey of Techniques for Maximizing LLM Performance.pptx
thanhdowork
 
Chapter 3 - Islamic Banking Products and Services.pptx
Chapter 3 - Islamic Banking Products and Services.pptxChapter 3 - Islamic Banking Products and Services.pptx
Chapter 3 - Islamic Banking Products and Services.pptx
Mohd Adib Abd Muin, Senior Lecturer at Universiti Utara Malaysia
 
Unit 8 - Information and Communication Technology (Paper I).pdf
Unit 8 - Information and Communication Technology (Paper I).pdfUnit 8 - Information and Communication Technology (Paper I).pdf
Unit 8 - Information and Communication Technology (Paper I).pdf
Thiyagu K
 
Exploiting Artificial Intelligence for Empowering Researchers and Faculty, In...
Exploiting Artificial Intelligence for Empowering Researchers and Faculty, In...Exploiting Artificial Intelligence for Empowering Researchers and Faculty, In...
Exploiting Artificial Intelligence for Empowering Researchers and Faculty, In...
Dr. Vinod Kumar Kanvaria
 
Mule 4.6 & Java 17 Upgrade | MuleSoft Mysore Meetup #46
Mule 4.6 & Java 17 Upgrade | MuleSoft Mysore Meetup #46Mule 4.6 & Java 17 Upgrade | MuleSoft Mysore Meetup #46
Mule 4.6 & Java 17 Upgrade | MuleSoft Mysore Meetup #46
MysoreMuleSoftMeetup
 
Model Attribute Check Company Auto Property
Model Attribute  Check Company Auto PropertyModel Attribute  Check Company Auto Property
Model Attribute Check Company Auto Property
Celine George
 
Biological Screening of Herbal Drugs in detailed.
Biological Screening of Herbal Drugs in detailed.Biological Screening of Herbal Drugs in detailed.
Biological Screening of Herbal Drugs in detailed.
Ashokrao Mane college of Pharmacy Peth-Vadgaon
 
The French Revolution Class 9 Study Material pdf free download
The French Revolution Class 9 Study Material pdf free downloadThe French Revolution Class 9 Study Material pdf free download
The French Revolution Class 9 Study Material pdf free download
Vivekanand Anglo Vedic Academy
 
Digital Artifact 2 - Investigating Pavilion Designs
Digital Artifact 2 - Investigating Pavilion DesignsDigital Artifact 2 - Investigating Pavilion Designs
Digital Artifact 2 - Investigating Pavilion Designs
chanes7
 

Recently uploaded (20)

Natural birth techniques - Mrs.Akanksha Trivedi Rama University
Natural birth techniques - Mrs.Akanksha Trivedi Rama UniversityNatural birth techniques - Mrs.Akanksha Trivedi Rama University
Natural birth techniques - Mrs.Akanksha Trivedi Rama University
 
Marketing internship report file for MBA
Marketing internship report file for MBAMarketing internship report file for MBA
Marketing internship report file for MBA
 
Unit 2- Research Aptitude (UGC NET Paper I).pdf
Unit 2- Research Aptitude (UGC NET Paper I).pdfUnit 2- Research Aptitude (UGC NET Paper I).pdf
Unit 2- Research Aptitude (UGC NET Paper I).pdf
 
Introduction to AI for Nonprofits with Tapp Network
Introduction to AI for Nonprofits with Tapp NetworkIntroduction to AI for Nonprofits with Tapp Network
Introduction to AI for Nonprofits with Tapp Network
 
The Challenger.pdf DNHS Official Publication
The Challenger.pdf DNHS Official PublicationThe Challenger.pdf DNHS Official Publication
The Challenger.pdf DNHS Official Publication
 
Thesis Statement for students diagnonsed withADHD.ppt
Thesis Statement for students diagnonsed withADHD.pptThesis Statement for students diagnonsed withADHD.ppt
Thesis Statement for students diagnonsed withADHD.ppt
 
special B.ed 2nd year old paper_20240531.pdf
special B.ed 2nd year old paper_20240531.pdfspecial B.ed 2nd year old paper_20240531.pdf
special B.ed 2nd year old paper_20240531.pdf
 
The Accursed House by Émile Gaboriau.pptx
The Accursed House by Émile Gaboriau.pptxThe Accursed House by Émile Gaboriau.pptx
The Accursed House by Émile Gaboriau.pptx
 
Pride Month Slides 2024 David Douglas School District
Pride Month Slides 2024 David Douglas School DistrictPride Month Slides 2024 David Douglas School District
Pride Month Slides 2024 David Douglas School District
 
How to Make a Field invisible in Odoo 17
How to Make a Field invisible in Odoo 17How to Make a Field invisible in Odoo 17
How to Make a Field invisible in Odoo 17
 
Lapbook sobre os Regimes Totalitários.pdf
Lapbook sobre os Regimes Totalitários.pdfLapbook sobre os Regimes Totalitários.pdf
Lapbook sobre os Regimes Totalitários.pdf
 
A Survey of Techniques for Maximizing LLM Performance.pptx
A Survey of Techniques for Maximizing LLM Performance.pptxA Survey of Techniques for Maximizing LLM Performance.pptx
A Survey of Techniques for Maximizing LLM Performance.pptx
 
Chapter 3 - Islamic Banking Products and Services.pptx
Chapter 3 - Islamic Banking Products and Services.pptxChapter 3 - Islamic Banking Products and Services.pptx
Chapter 3 - Islamic Banking Products and Services.pptx
 
Unit 8 - Information and Communication Technology (Paper I).pdf
Unit 8 - Information and Communication Technology (Paper I).pdfUnit 8 - Information and Communication Technology (Paper I).pdf
Unit 8 - Information and Communication Technology (Paper I).pdf
 
Exploiting Artificial Intelligence for Empowering Researchers and Faculty, In...
Exploiting Artificial Intelligence for Empowering Researchers and Faculty, In...Exploiting Artificial Intelligence for Empowering Researchers and Faculty, In...
Exploiting Artificial Intelligence for Empowering Researchers and Faculty, In...
 
Mule 4.6 & Java 17 Upgrade | MuleSoft Mysore Meetup #46
Mule 4.6 & Java 17 Upgrade | MuleSoft Mysore Meetup #46Mule 4.6 & Java 17 Upgrade | MuleSoft Mysore Meetup #46
Mule 4.6 & Java 17 Upgrade | MuleSoft Mysore Meetup #46
 
Model Attribute Check Company Auto Property
Model Attribute  Check Company Auto PropertyModel Attribute  Check Company Auto Property
Model Attribute Check Company Auto Property
 
Biological Screening of Herbal Drugs in detailed.
Biological Screening of Herbal Drugs in detailed.Biological Screening of Herbal Drugs in detailed.
Biological Screening of Herbal Drugs in detailed.
 
The French Revolution Class 9 Study Material pdf free download
The French Revolution Class 9 Study Material pdf free downloadThe French Revolution Class 9 Study Material pdf free download
The French Revolution Class 9 Study Material pdf free download
 
Digital Artifact 2 - Investigating Pavilion Designs
Digital Artifact 2 - Investigating Pavilion DesignsDigital Artifact 2 - Investigating Pavilion Designs
Digital Artifact 2 - Investigating Pavilion Designs
 

Probablity

  • 2. What is Probability? • A method for measuring and quantifying the likelihood of obtaining a specific sample from a specific population I want to pick a single marble (a sample) out of each of these jars (two populations) What are my chances of getting a black marble from both jars? Jar A Jar B50 white 50 black 10 white 90 black You have a 50-50 chance of getting either color Your marble (your sample) will probably be black
  • 3. What is Probability? • A method for measuring and quantifying the likelihood of obtaining a specific sample from a specific population Now you are blindfolded when you pick your marble (your sample) so you do not know from which jar (population) it comes from. If you picked 4 black marbles in a row, which jar would say they came from? Jar A Jar B Very high probability they came from this one Very low probability they came from this one
  • 4. Probability Defined • The probability (p) of a specific outcome for any given event is defined as the fraction or proportion of all the possible outcomes (A, B, C, D, etc.) p(A)= # of outcomes classified as A total # of possible outcomes A ratio that represents the likelihood that some event will occur relative to the total number of possible outcomes
  • 5. Probability Defined • If an event can occur in ‘A’ ways • If an event can fail to occur in ‘B’ ways • If all possible ways are equally likely (we guarantee this through random selection) • The probability of the event occurring: • The probability of the event failing to occur:  BA A   BA B  p(A)= # of outcomes classified as A total # of possible outcomes
  • 6. A Demonstration Select one card from a deck of 52 cards What is the probability of selecting a king? • The probability of the event occurring is computed by: • A = 4 • there are 4 kings in the deck • B = 48 • there are 48 cards that aren’t kings in the deck  BA A  52 4 )484( 4   
  • 7. A Demonstration Select one card from a deck of 52 cards What is the probability of selecting a king of diamonds? The probability of the event occurring is computed by: • A = 1 • There is 1 king of diamonds in the deck • B = 51 • There are 51 cards that are NOT the king of diamonds in the deck  BA A  52 1 )511( 1   
  • 8. Another way to think of probability • Sample space: A set of possible outcomes • Rolling a die: {1, 2, 3, 4, 5, 6}  6 possibilities • Event: A subset of the sample space, the occurrence of the thing you are interested in • Die coming up odd: {1, 3, 5}  3 possibilities Let’s say we are interested in the probability a roll of a die will result in an odd number The probability a die will come up odd is the number of event possibilities over the number of sample space possibilities: 2 1 6 3 .# .# )(  spacesample iespossibilitevent oddp
  • 9. Interpreting Probability • For any event (A), we assign a number p(A) between 0 and 1 that is interpreted as: • The chance or likelihood that event A occurs • The proportion of times that event A occurs over a series of trials Continuing our rolling the die example… p(odd) = ½ = 0.50 = 50% We can express probability in a ratio, proportion, or %
  • 10. Examples If we spin this wheel: • What is the p of landing on 7? • p(7) = 1/8 • p = 0.125 or 12.5% • What is the p of landing on an even number? • p(even) = 4/8 = 1/2 • p = 0.50 or 50% • What is the p of landing on a white space? • p(white) = 4/8 = 1/2 • p = 0.50 or 50%
  • 11. More examples! What is the probability of: • Getting a correct answer on a multiple choice question with five answer choices (assuming you make a blind guess)? • 1/5 • Getting a tail in a regular coin toss? • 1/2 • Rolling a 3 with a regular die? • 1/6
  • 12. When is probability reliable? • When you have a fair die, coin, roulette wheel, etc. • There is an equal chance of every outcome • If your coin is weighted to land on heads every time, the p(tail) is no longer ½ To use probability in statistics, we must ensure that our sample is chosen in a way to mirror this “fair chance”
  • 13. Random Sampling To insure that the definition of probability is accurate, we must use random sampling 1. Every individual in the population of interest has an equal chance of being selected 1. If more than one individual is to be selected for the sample, there must be a constant probability for each and every selection • This may require sampling with replacement
  • 14. An Example of Random Sampling Imagine a large bag filled with coins. The coins include half-dollars, quarters, pennies, nickels, and dimes. You are interested in estimating the weight of this bag, but may not actually weigh every coin. How would you estimate the weight?
  • 15. Estimating the weight… • Take a random sample of coins • Every coin must have an equal chance of being selected • There must be a constant probability for each and every selection • Requires sampling with replacement • Use this information to generalize what we might expect the weight of the entire bag to be
  • 16. The Role of Probability in Inferential Statistics • Probability is used to predict what kind of samples are likely to be obtained from a population • Establishes a connection between samples and populations • Inferential statistics rely on this connection when they use sample data as the basis for making conclusions about populations
  • 17. Probability and Statistics This is how we use probability in statistics We think ‘backwards’ because we typically do not have the population information Based on the sample, what do we estimate the population to look like? vs. Based on the population’s characteristics, what do we estimate our sample to look like?
  • 18. Probability and Frequency Distributions • X: 1, 1, 2, 3, 3, 4, 4, 4, 5, 6 • N = 10 If I sample n = 1: • p(X < 2)? • 2/10 = 1/5 • p(X > 3)? • 5/10 = 1/2 • p(X = 3)? • 2/10 = 1/5
  • 20. 68.26% 94.46% 99.73% Probability and the Normal Distribution We can describe a normal distribution by the proportions of area contained in each section • Symmetric: Proportions on the right side will correspond to the mirror image on the left • Since we can identify sections with z-scores, these proportions correspond to any normal distribution (regardless of actual mean and standard deviation values)
  • 21. μ 34.13% 13.59% 2.14% Because the z-distribution is normally distributed we can make certain assumptions about probabilities The z-score allows us to draw a vertical line through the distribution, dividing the distribution into two sections The Body The Tail
  • 22. μ 34.13% 13.59% 2.14% Some probabilities associated with the normal distribution • 34.13% of the distribution falls between the mean and the first standard deviation (z = +1.00; z = -1.00) • 13.59% of the distribution falls between the 1st and 2nd standard deviation • 2.14% of the distribution falls between the 2nd and 3rd standard deviations
  • 23. Probability and the Normal Distribution It is good to have a general idea of proportions within the curve What if you need to find the proportion below a z- score of -0.85? The Unit Normal Table (Appendix B, pp.699- 702) lists z-scores and their corresponding proportions Note: The Unit Normal Table lists positive z-scores only because the curve is symmetric; values can be used for negative z-scores as well.
  • 24. The Unit Normal Table • A negative z-score: tail is on the left side • A positive z-score: tail is on the right side Because the Unit Normal Table only lists positive numbers, it is helpful to draw the curve and the area you want before looking up the proportion so you know which value (body or tail) you want
  • 25. Finding the probability of a z-score What is the proportion of the normal distribution associated with the following sections of a graph: • z > 1.25 Interpreted as: • The probability of selecting a participant from this population with a z-score greater than 1.25 is 0.1056 • The proportion of the distribution with a z-score greater than 1.25 is 10.56% • z < 0.00 Interpreted as: • The probability of selecting a participant from this population with a z-score less than 0.00 is 0.5000 • The proportion of the distribution with a z-score less than 0 is 50% p = 0.1056 p = 0.5000
  • 26. PROBABILITIES AND PROPORTIONS FOR SCORES from a Normal Distribution
  • 27. Finding the probability of a raw score from a normal distribution What is the probability of randomly selecting a person with an IQ greater than 115 if the population μ=100 and σ=10? 1st step: Calculate the z-score 2nd step: Find the proportion of the curve greater than the z-score. • z = 1.50 • p(>1.50) = p in the tail (Column C) for 1.50 = 0.0668 50.1 10 )100115(   z
  • 28. You Try It: For a distribution with a μ = 100 and σ = 10: What is the probability of randomly selecting a person with an IQ less than 90? Greater than 125? 00.1 10 )10090(   z 50.2 10 )100125(   z Proportion in the tail above z = 2.50: p = 0.0062 This very high z-score indicates it is at the extreme high end of the distribution, with few scores above Proportion in the tail below z = -1.00: p = 0.1587
  • 29. Finding the Probability for a Range of Scores What is the probability of randomly selecting a person with an IQ between 95 and 110? (μ=100 σ=10) • Find the two z-scores, and then find the proportion that covers the space between these two scores 00.1 10 )100110( 50.0 10 )10095(       z z Add the distances of each z-score from the mean (Column D): (0.1915 + 0.3413) = 0.533 Or, subtract the proportion in the tail of one score from the proportion in the body of the other score (e.g., Body of 110 – Tail of 95) (0.8413 - 0.3085) = 0.533 p = 95< IQ <110( )
  • 30. Finding the z-score corresponding to a certain proportion • If you know a specific location (z-score) in a normal distribution, you can use the table to look up corresponding proportions. • If you know a specific proportion(s), you can use the table to look up the exact z-score location in the distribution
  • 31. Example (1) • What z-score separates the lowest 5% from the remainder of the distribution? • Find the z-score with p = 0.05 in the tail • z-table shows us z = 1.65 has p = 0.0495 (closest to p = 0.05 without exceeding it) • Remember we want the lowest 5%, and the table only shows us positive z-scores • Since the curve is symmetric: a z-score of z = -1.65 separates the lowest 5% from the remainder of the distribution
  • 32. Example (2) • What z-scores separate the extreme 5% scores from the rest of the distribution? • We want the lowest and highest in this 5% • Lowest score separates (5%/2) = 2.5% lowest and highest score separates (5%/2) = 2.5% highest • We want to find the z-scores with p = 0.025 in tails • z-scores of z = +/- 1.96 separate these scores from the rest of the distribution
  • 33. Solving for a specific score: • If I want the top 10%, what is the cutoff score? (μ = 100 σ = 15) • z-score that separates p = .0100 closest without going over is z = 1.29 • Now I want to solve for X to find the cutoff score 2.1191002.19100)15(28.1  zX
  • 34. Recall from earlier, we can express cumulative percentages as percentile ranks. To find the 84th percentile we would find the score that separates p = 0.8400 below (body) and p = 0.1600 above (tail). (approximately z = 0.99)
  • 35. Looking ahead to inferential statistics • Based on our observations of a sample, we make inferences about the population. • It is with statistics based on probability that we determine how likely our sample represents our population of interest • or, how unlikely our sample is compared to the population after some treatment/intervention/etc.