Download as PDF, PPTX
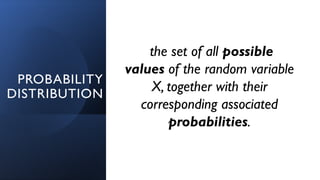
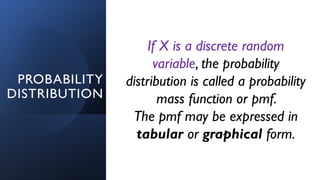
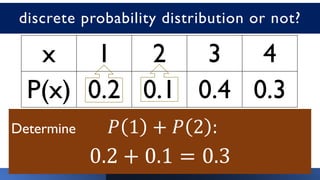
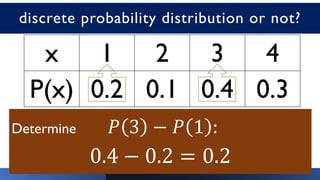
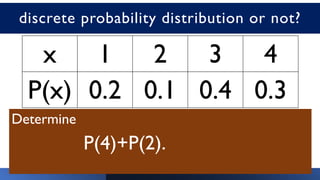


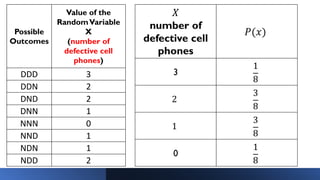
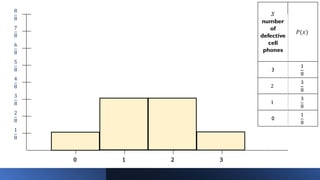

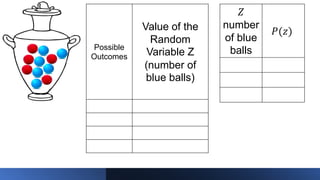
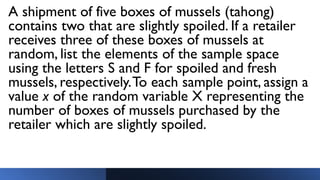
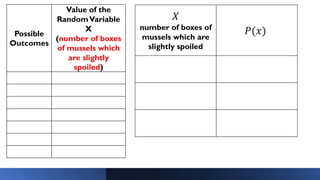
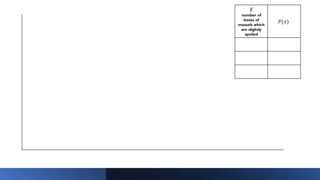

The document discusses probability distributions of random variables, detailing both discrete random variables and their corresponding probability mass functions (pmf). It includes examples of calculating probabilities for different scenarios, such as defective cell phones and the drawing of balls from an urn. Additionally, the document outlines properties of probability distributions and provides graphical representations for better understanding.


![Lesson 1.2 Constructing-Probability-Distribution [Autosaved].pptx](https://cdn.slidesharecdn.com/ss_thumbnails/lesson1-250930160701-62e8820c-thumbnail.jpg?width=640&height=640&fit=bounds)


