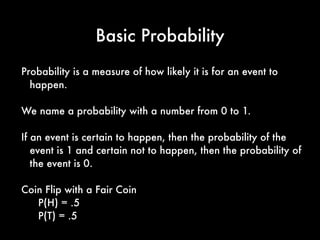
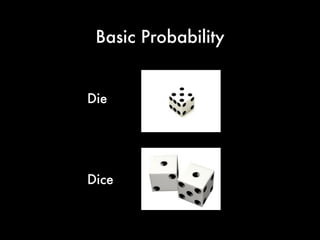
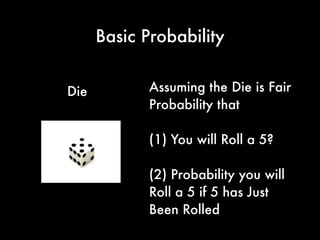
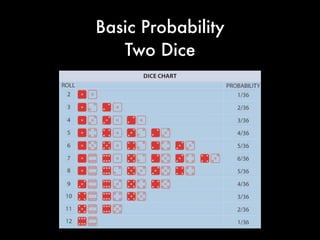
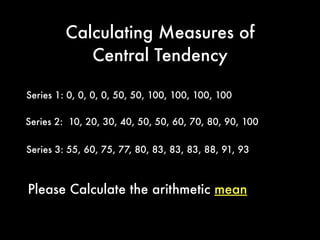
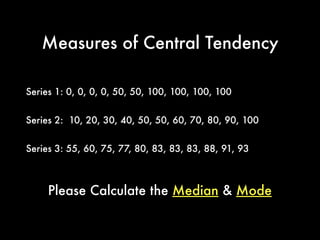
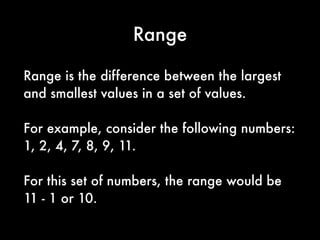
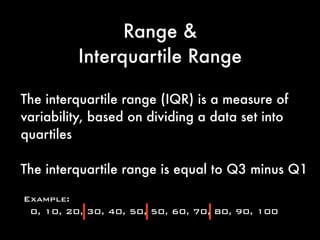
INTRODUCTION
CHARACTERISTICS OF A HYPOTHESIS
CRITERIA FOR HYPOTHESIS CONSTRUCTION
STEPS IN HYPOTHESIS TESTING
SOURCES OF HYPOTHESIS
APPROACHES TO HYPOTHESIS TESTING
THE LOGIC OF HYPOTHESIS TESTING
TYPES OF ERRORS IN HYPOTHESIS
Get ready to face Data Science interviews with this set of Statistics questions. This will help you have insight upon the important statistics concepts that are frequently asked in interviews.
Legal Analytics Course - Class 5 - Quantitative Legal Prediction + Data Drive...Daniel Katz
Legal Analytics Course - Class 5 - Quantitative Legal Prediction + Data Driven Future of Law Practice - Professor Daniel Martin Katz + Professor Michael J Bommarito
AWS re:Invent 2016: Blockchain on AWS: Disrupting the Norm (GPST301)Amazon Web Services
Recent interest in leveraging distributed ledgers across multiple industries has elevated blockchain from mere theory and into the spotlight of real world use. Learn why some partners have a vested interest in it and how blockchain can be used with AWS. In this session, we explore the AWS services needed for a successful deployment and dive deep into a partner's blockchain journey on AWS.
Detailed discussion about the types of statistics form Measures of Central Tendency, Measures of Dispersion, Skewness, Kurtosis, Probability Distributions and much more with their uses cases
I am Racheal W. I am a Probability Assignment Expert at statisticsassignmenthelp.com. I hold a Masters in Statistics from, Massachusetts Institute of Technology, USA.
I have been helping students with their homework for the past 7 years. I solve assignments related to probability.
Visit statisticsassignmenthelp.com or email info@statisticsassignmenthelp.com.
You can also call on +1 678 648 4277 for any assistance with probability assignments.
TSTD 6251 Fall 2014SPSS Exercise and Assignment 120 PointsI.docxnanamonkton
TSTD 6251 Fall 2014
SPSS Exercise and Assignment 1
20 Points
In this class, we are going to study descriptive summary statistics and learn how to construct box plot. We are still working with univariate variable for this exercise.
Practice Example:
Admission receipts (in million of dollars) for a recent season are given below for the
n =
30 major league baseball teams:
19.4 26.6 22.9 44.5 24.4 19.0 27.5 19.9 22.8 19.0 16.9 15.2 25.7 19.0 15.5 17.1 15.6 10.6 16.2 15.6 15.4 18.2 15.5 14.2 9.5 9.9
10.7 11.9 26.7 17.5
Require:
a. Compute the mean, variance and standard deviation.
b. Find the sample median, first quartile, and third quartile.
c. Construct a boxplot and interpret the distribution of the data.
d. Discuss the distribution of this set of data by examining kurtosis and skewness
statistics, such as if the distribution is skewed to one side of the distribution, and if the
distribution shows a peaked/skinny curve or a spread out/flat curve.
SPSS Procedures for Computing Summary Statistics
:
Enter the 30 data values in the first column of SPSS
Data View
Tab
Variable View
and name this variable
receipts
Adjust
Decimals
to 3 decimal points
Type
Admission Receipts
($ mn)
in the
Label
column for output viewer
Return to
Data View
and click
A
nalyze
on the menu bar
Click the second menu
D
e
scriptive Statistics
Click
F
requencies …
Move
Admission Receipts
to the
Variable(s)
list by clicking the arrow button
Click
S
tatistics …
button at the top of the dialog box
Now, you can select the descriptive statistics according to what the question requires. For this practice question, it requires central tendency, dispersion, percentile and distribution statistics, so we click all the boxes
except for
P
ercentile(s): and Va
l
ues are group midpoints
.
Click
Continue
to return to the
Frequencies
dialog box
Click
OK
to generate descriptive statistic output which is pasted below:
The first table provides summary statistics and the second table lists frequencies, relative frequencies and cumulative frequencies. The statistics required for solving this problem are highlighted in red.
Statistics
Admission Receipts
N
Valid
30
Missing
0
Mean
18.76333
Std. Error of Mean
1.278590
Median
17.30000
Mode
19.000
Std. Deviation
7.003127
Variance
49.043782
Skewness
1.734
Std. Error of Skewness
.427
Kurtosis
5.160
Std. Error of Kurtosis
.833
Range
35.000
Minimum
9.500
Maximum
44.500
Sum
562.900
Percentiles
10
10.61000
20
14.40000
25
15.35000
30
15.50000
40
15.84000
50
17.30000
60
19.00000
70
19.75000
75
22.82500
80
24.10000
90
26.69000
Admission Receipts
Frequency
Percent
Valid Percent
Cumulative Percent
Valid
9.500
1
3.3
3.3
3.3
9.900
1
3.3
3.3
6.7
10.600
1
3.3
3.3
10.0
10.700
1
3.3
3.3
13.3
11.900
1
3.3
3.3
16.7
14.200
1
3.3
3.3
20.0
15.2.
Why We Are Open Sourcing ContraxSuite and Some Thoughts About Legal Tech and ...Daniel Katz
Why We Are Open Sourcing ContraxSuite and Some Thoughts About Legal Tech and the Modern Information Economy - By Michael Bommarito + Daniel Martin Katz from LexPredict
Fin (Legal) Tech – Law’s Future from Finance’s Past (Some Thoughts About the ...Daniel Katz
Fin (Legal) Tech – Law’s Future from Finance’s Past (Some Thoughts About the Financialization of the Law) – Professors Daniel Martin Katz + Michael J Bommarito
Exploring the Physical Properties of Regulatory Ecosystems - Professors Danie...Daniel Katz
Exploring the Physical Properties of Regulatory Ecosystems: Regulatory Dynamics Revealed by Securities Filings — Professors Daniel Martin Katz + Michael J Bommarito
Artificial Intelligence and Law - A Primer Daniel Katz
Artificial Intelligence in Law (and beyond) including Machine Learning as a Service, Quantitative Legal Prediction / Legal Analytics, Experts + Crowds + Algorithms
LexPredict - Empowering the Future of Legal Decision MakingDaniel Katz
LexPredict is an enterprise legal technology and consulting firm, specializing in the application of best-in-class processes and technologies from the technology, financial services, and logistics industries to the practice of law, compliance, insurance, and risk management.
We focus on the goals of prediction, optimization, and risk management to enable holistic organizational changes that empower legal decision-making.
These changes span people and processes, software and data, and execution and education.
Legal Analytics Course - Class 9 - Clustering Algorithms (K-Means & Hierarchical Clustering) - Professor Daniel Martin Katz + Professor Michael J Bommarito
Epistemic Interaction - tuning interfaces to provide information for AI supportAlan Dix
Paper presented at SYNERGY workshop at AVI 2024, Genoa, Italy. 3rd June 2024
https://alandix.com/academic/papers/synergy2024-epistemic/
As machine learning integrates deeper into human-computer interactions, the concept of epistemic interaction emerges, aiming to refine these interactions to enhance system adaptability. This approach encourages minor, intentional adjustments in user behaviour to enrich the data available for system learning. This paper introduces epistemic interaction within the context of human-system communication, illustrating how deliberate interaction design can improve system understanding and adaptation. Through concrete examples, we demonstrate the potential of epistemic interaction to significantly advance human-computer interaction by leveraging intuitive human communication strategies to inform system design and functionality, offering a novel pathway for enriching user-system engagements.
The Art of the Pitch: WordPress Relationships and SalesLaura Byrne
Clients don’t know what they don’t know. What web solutions are right for them? How does WordPress come into the picture? How do you make sure you understand scope and timeline? What do you do if sometime changes?
All these questions and more will be explored as we talk about matching clients’ needs with what your agency offers without pulling teeth or pulling your hair out. Practical tips, and strategies for successful relationship building that leads to closing the deal.
Kubernetes & AI - Beauty and the Beast !?! @KCD Istanbul 2024Tobias Schneck
As AI technology is pushing into IT I was wondering myself, as an “infrastructure container kubernetes guy”, how get this fancy AI technology get managed from an infrastructure operational view? Is it possible to apply our lovely cloud native principals as well? What benefit’s both technologies could bring to each other?
Let me take this questions and provide you a short journey through existing deployment models and use cases for AI software. On practical examples, we discuss what cloud/on-premise strategy we may need for applying it to our own infrastructure to get it to work from an enterprise perspective. I want to give an overview about infrastructure requirements and technologies, what could be beneficial or limiting your AI use cases in an enterprise environment. An interactive Demo will give you some insides, what approaches I got already working for real.
Connector Corner: Automate dynamic content and events by pushing a buttonDianaGray10
Here is something new! In our next Connector Corner webinar, we will demonstrate how you can use a single workflow to:
Create a campaign using Mailchimp with merge tags/fields
Send an interactive Slack channel message (using buttons)
Have the message received by managers and peers along with a test email for review
But there’s more:
In a second workflow supporting the same use case, you’ll see:
Your campaign sent to target colleagues for approval
If the “Approve” button is clicked, a Jira/Zendesk ticket is created for the marketing design team
But—if the “Reject” button is pushed, colleagues will be alerted via Slack message
Join us to learn more about this new, human-in-the-loop capability, brought to you by Integration Service connectors.
And...
Speakers:
Akshay Agnihotri, Product Manager
Charlie Greenberg, Host
UiPath Test Automation using UiPath Test Suite series, part 3DianaGray10
Welcome to UiPath Test Automation using UiPath Test Suite series part 3. In this session, we will cover desktop automation along with UI automation.
Topics covered:
UI automation Introduction,
UI automation Sample
Desktop automation flow
Pradeep Chinnala, Senior Consultant Automation Developer @WonderBotz and UiPath MVP
Deepak Rai, Automation Practice Lead, Boundaryless Group and UiPath MVP
Encryption in Microsoft 365 - ExpertsLive Netherlands 2024Albert Hoitingh
In this session I delve into the encryption technology used in Microsoft 365 and Microsoft Purview. Including the concepts of Customer Key and Double Key Encryption.
Generating a custom Ruby SDK for your web service or Rails API using Smithyg2nightmarescribd
Have you ever wanted a Ruby client API to communicate with your web service? Smithy is a protocol-agnostic language for defining services and SDKs. Smithy Ruby is an implementation of Smithy that generates a Ruby SDK using a Smithy model. In this talk, we will explore Smithy and Smithy Ruby to learn how to generate custom feature-rich SDKs that can communicate with any web service, such as a Rails JSON API.
GDG Cloud Southlake #33: Boule & Rebala: Effective AppSec in SDLC using Deplo...James Anderson
Effective Application Security in Software Delivery lifecycle using Deployment Firewall and DBOM
The modern software delivery process (or the CI/CD process) includes many tools, distributed teams, open-source code, and cloud platforms. Constant focus on speed to release software to market, along with the traditional slow and manual security checks has caused gaps in continuous security as an important piece in the software supply chain. Today organizations feel more susceptible to external and internal cyber threats due to the vast attack surface in their applications supply chain and the lack of end-to-end governance and risk management.
The software team must secure its software delivery process to avoid vulnerability and security breaches. This needs to be achieved with existing tool chains and without extensive rework of the delivery processes. This talk will present strategies and techniques for providing visibility into the true risk of the existing vulnerabilities, preventing the introduction of security issues in the software, resolving vulnerabilities in production environments quickly, and capturing the deployment bill of materials (DBOM).
Speakers:
Bob Boule
Robert Boule is a technology enthusiast with PASSION for technology and making things work along with a knack for helping others understand how things work. He comes with around 20 years of solution engineering experience in application security, software continuous delivery, and SaaS platforms. He is known for his dynamic presentations in CI/CD and application security integrated in software delivery lifecycle.
Gopinath Rebala
Gopinath Rebala is the CTO of OpsMx, where he has overall responsibility for the machine learning and data processing architectures for Secure Software Delivery. Gopi also has a strong connection with our customers, leading design and architecture for strategic implementations. Gopi is a frequent speaker and well-known leader in continuous delivery and integrating security into software delivery.
Builder.ai Founder Sachin Dev Duggal's Strategic Approach to Create an Innova...Ramesh Iyer
In today's fast-changing business world, Companies that adapt and embrace new ideas often need help to keep up with the competition. However, fostering a culture of innovation takes much work. It takes vision, leadership and willingness to take risks in the right proportion. Sachin Dev Duggal, co-founder of Builder.ai, has perfected the art of this balance, creating a company culture where creativity and growth are nurtured at each stage.
3. Probability is a measure of how likely it is for an event to
happen.
We name a probability with a number from 0 to 1.
If an event is certain to happen, then the probability of the
event is 1 and certain not to happen, then the probability of
the event is 0.
Coin Flip with a Fair Coin
P(H) = .5
P(T) = .5
Basic Probability
4. If it is uncertain whether or not an event will happen, then
its probability is some fraction between 0 and 1 (or a
fraction converted to a decimal number).
0 1
Certain not
to happen
Equally likely to
happen or not to happen Certain to
happen
0%
50 %
Chance
100%
12. When two events are statistically independent, it means
that knowing whether one of them occurs makes it
neither more probable nor less probable that the other
occurs.
the occurrence of one event occurs does not affect the
outcome of the occurrence of the other event. Similarly,
when we assert that two random variables are
independent, we intuitively mean that knowing
something about the value of one of them does not
yield any information about the value of the other.
Statistical Independence
13. Example: The number appearing on the upward face of
a die the first time it is thrown and that appearing on the
same die the second time, are independent. e.g. the
event of getting a "1" when a die is thrown and the
event of getting a "1" the second time it is thrown are
independent.
Statistical Independence
14. Basic Probability:
Coins
What is the Prob of Heads v. Tails?
What is the Prob of TT?
What is the Prob of HHH,?
What is the Prob of HTT?
19. Basic
Probability
A Deck of Cards
1. A red card
2. A spade
3. Not a spade
4. An ace
5. Not an ace
6. The ace of spades
7. A picture card
8. A number card or ‘not a picture card‘
9. A card that is either a heart or a club
10. A 4 or 5 but not a spade
11. An even numbered card
20. 1. A red card 26/52 ½
2. A spade 13/52 ¼
3. Not a spade 39/52 ¾
4. An ace 4/52 1/13
5. Not an ace 48/52 12/13
6. The ace of spades 1/52
7. A picture card 12/52 3/13
8. A number card or ‘not a picture card’ 40/52 10/13
9. A card that is either a heart or a club 26/52 ½
10. A 4 or 5 but not a spade 6/52 3/26
11. An even numbered card 20/52 5/13
23. Let's say that our universe contains the numbers
1, 2, 3, and 4.
Let A be the set containing the numbers 1 and 2; that is,
A = {1, 2}.
(Warning: The curly braces are the customary notation for
sets. Do not use parentheses or square brackets.)
Let B be the set containing the numbers
2 and 3; that is, B = {2, 3}. Then we
have the following relationships, with
pinkish shading marking the solution
"regions" in the Venn diagrams:
24. Let's say that our
universe contains the
numbers 1, 2, 3, and
4.
Let A be the set
c o n t a i n i n g t h e
numbers 1 and 2;
that is, A = {1, 2}.
Let B be the set
c o n t a i n i n g t h e
numbers 2 and 3;
that is, B = {2, 3}.
29. Probability: mathematical theory that describes
uncertainty
Statistics: series of techniques for describing and
extracting useful information from data
Probability Versus Statistics
30. The arithmetic mean (or average) is
the sum of a series dividing by how
many numbers you added together.
31. Sum of Series of Numbers
Total # of Numbers in the Series
_____________________________________________________________________________
Mean =
32. Lets Talk About Notation ...
x1, x2, x3 x4 .... xn
5, 7, 11, 13 ....
x bar
the Nth Term
Called
33. Lets Talk About Notation ...
x1, x2, x3 x4 .... xn
5, 7, 11, 13 ....
x bar
the Nth Term
Called
34. Calculating Measures of
Central Tendency
Series 1: 0, 0, 0, 0, 50, 50, 100, 100, 100, 100
Series 2: 10, 20, 30, 40, 50, 50, 60, 70, 80, 90, 100
Series 3: 55, 60, 75, 77, 80, 83, 83, 83, 88, 91, 93
Please Calculate the arithmetic mean
35. Measures of Central Tendency
The number that occurs most frequently is
the mode.
When numbers are arranged in numerical
order, the middle one is the median.
36. Measures of Central Tendency
Series 1: 0, 0, 0, 0, 50, 50, 100, 100, 100, 100
Series 2: 10, 20, 30, 40, 50, 50, 60, 70, 80, 90, 100
Series 3: 55, 60, 75, 77, 80, 83, 83, 83, 88, 91, 93
Please Calculate the Median & Mode
39. Range
Range is the difference between the largest
and smallest values in a set of values.
For example, consider the following numbers:
1, 2, 4, 7, 8, 9, 11.
For this set of numbers, the range would be
11 - 1 or 10.
40. Range &
Interquartile Range
The interquartile range (IQR) is a measure of
variability, based on dividing a data set into
quartiles
The interquartile range is equal to Q3 minus Q1
41. Range &
Interquartile Range
The interquartile range (IQR) is a measure of
variability, based on dividing a data set into
quartiles
The interquartile range is equal to Q3 minus Q1
Example:
0, 10, 20, 30, 40, 50, 50, 60, 70, 80, 90, 100