Download as PDF, PPTX


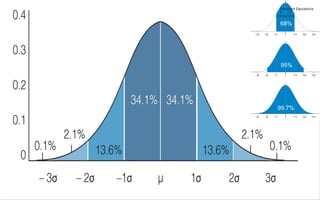


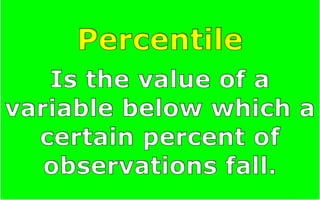

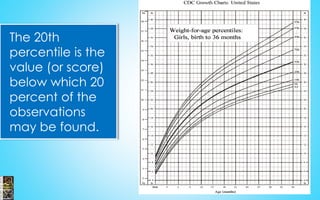


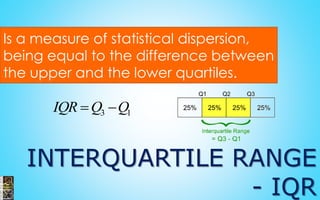


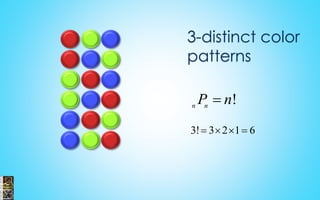


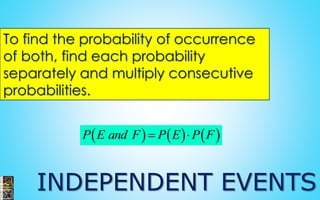


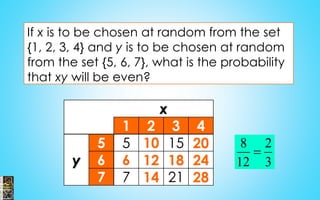


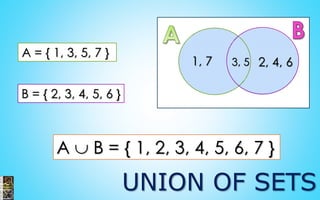


- The document contains information about statistics including measures of central tendency, dispersion, probability, and counting methods. - It discusses topics like mean, median, mode, range, standard deviation, normal distribution, and the empirical rule. - Probability concepts covered include independent and dependent events, the addition law of probabilities, and examples of calculating probabilities of various card draws. - The final section discusses counting principles for permutations, combinations, and probability.