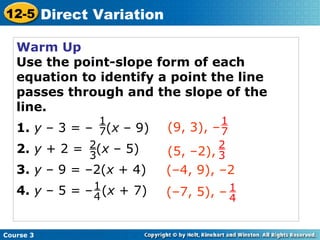
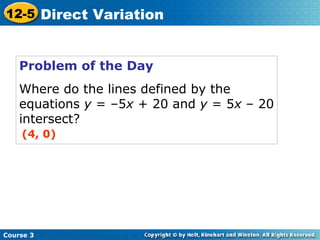
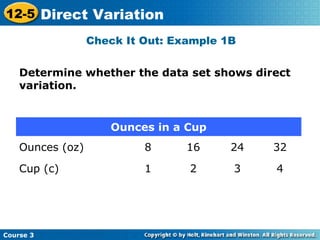
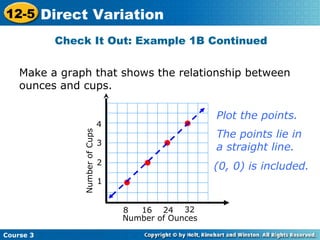
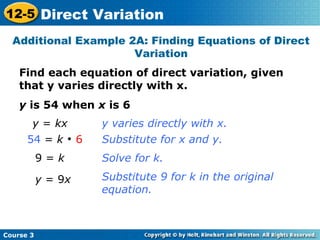
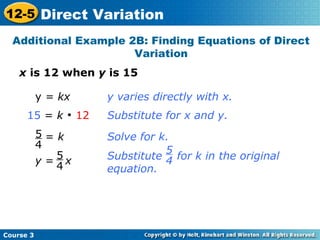
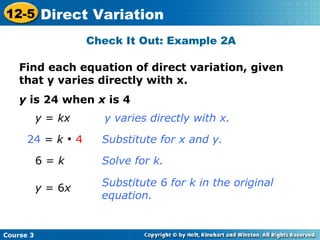
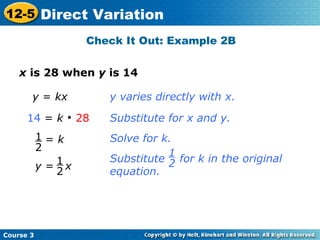
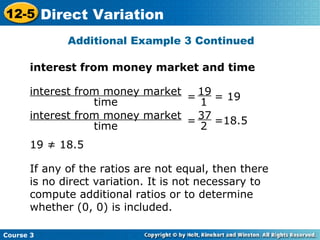
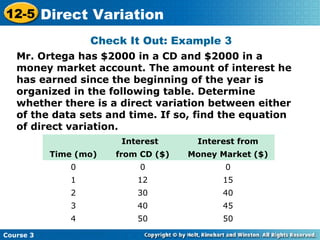
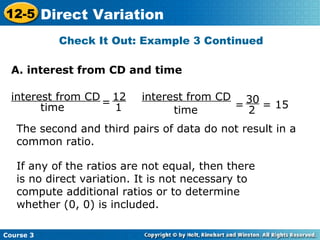
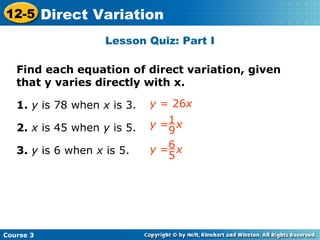
12-5 Direct Variation
Course 3
Warm UpWarm Up
Problem of the DayProblem of the Day
Lesson PresentationLesson Presentation
Warm Up
Use the point-slope form of each
equation to identify a point the line
passes through and the slope of the
line.
1. y – 3 = – (x – 9)
2. y + 2 = (x – 5)
3. y – 9 = –2(x + 4)
4. y – 5 = – (x + 7)
(–4, 9), –2
Course 3
12-5 Direct Variation
1
7
2
3
1
4
(9, 3), –
1
7
(5, –2),
2
3
(–7, 5), – 1
4
Problem of the Day
Where do the lines defined by the
equations y = –5x + 20 and y = 5x – 20
intersect?
(4, 0)
Course 3
12-5 Direct Variation
Learn to recognize direct variation by
graphing tables of data and checking for
constant ratios.
Course 3
12-5 Direct Variation
Vocabulary
direct variation
constant of proportionality
Insert Lesson Title Here
Course 3
12-5 Direct Variation
Course 3
12-5 Direct Variation
Course 3
12-5 Direct Variation
The graph of a direct-variation equation is always
linear and always contains the point (0, 0). The
variables x and y either increase together or
decrease together.
Helpful Hint
Determine whether the data set shows direct
variation.
Additional Example 1A: Determining Whether a Data
Set Varies Directly
Course 3
12-5 Direct Variation
Make a graph that shows the relationship between
Adam’s age and his length. The graph is not linear.
Additional Example 1A Continued
Course 3
12-5 Direct Variation
You can also compare ratios to see if a direct
variation occurs.
22
3
27
12=
?
81
264
81 ≠ 264
The ratios are not proportional.
The relationship of the data is not a direct
variation.
Additional Example 1A Continued
Course 3
12-5 Direct Variation
Determine whether the data set shows direct
variation.
Additional Example 1B: Determining Whether a Data
Set Varies Directly
Course 3
12-5 Direct Variation
Make a graph that shows the relationship between
the number of minutes and the distance the train
travels.
Additional Example 1B Continued
Plot the points.
The points lie in
a straight line.
Course 3
12-5 Direct Variation
(0, 0) is included.
You can also compare ratios to see if a direct
variation occurs.
The ratios are proportional. The relationship is
a direct variation.
25
10
50
20
75
30
100
40
= = =
Compare ratios.
Additional Example 1B Continued
Course 3
12-5 Direct Variation
Determine whether the data set shows direct
variation.
Check It Out: Example 1A
Kyle's Basketball Shots
Distance (ft) 20 30 40
Number of Baskets 5 3 0
Course 3
12-5 Direct Variation
Make a graph that shows the relationship between
number of baskets and distance. The graph is not
linear.
Check It Out: Example 1A Continued
NumberofBaskets
Distance (ft)
2
3
4
20 30 40
1
5
Course 3
12-5 Direct Variation
You can also compare ratios to see if a direct
variation occurs.
Check It Out: Example 1A Continued
5
20
3
30=
?
60
150
150 ≠ 60.
The ratios are not proportional.
The relationship of the data is not a direct
variation.
Course 3
12-5 Direct Variation
Determine whether the data set shows direct
variation.
Check It Out: Example 1B
Ounces in a Cup
Ounces (oz) 8 16 24 32
Cup (c) 1 2 3 4
Course 3
12-5 Direct Variation
Make a graph that shows the relationship between
ounces and cups.
Check It Out: Example 1B Continued
NumberofCups
Number of Ounces
2
3
4
8 16 24
1
32
Course 3
12-5 Direct Variation
Plot the points.
The points lie in
a straight line.
(0, 0) is included.
You can also compare ratios to see if a direct
variation occurs.
Check It Out: Example 1B Continued
Course 3
12-5 Direct Variation
The ratios are proportional. The relationship is
a direct variation.
Compare ratios.
=
1
8
= =
2
16
3
24
4
32
Find each equation of direct variation, given
that y varies directly with x.
y is 54 when x is 6
Additional Example 2A: Finding Equations of Direct
Variation
y = kx
54 = k 
6
9 = k
y = 9x
y varies directly with x.
Substitute for x and y.
Solve for k.
Substitute 9 for k in the original
equation.
Course 3
12-5 Direct Variation
x is 12 when y is 15
Additional Example 2B: Finding Equations of Direct
Variation
y = kx
15 = k 
12
y varies directly with x.
Substitute for x and y.
Solve for k.= k5
4
Substitute for k in the original
equation.
5
4y = x
5
4
Course 3
12-5 Direct Variation
Find each equation of direct variation, given
that y varies directly with x.
y is 24 when x is 4
Check It Out: Example 2A
y = kx
24 = k 
4
6 = k
y = 6x
y varies directly with x.
Substitute for x and y.
Solve for k.
Substitute 6 for k in the original
equation.
Course 3
12-5 Direct Variation
x is 28 when y is 14
Check It Out: Example 2B
y = kx
14 = k 
28
y varies directly with x.
Substitute for x and y.
Solve for k.= k1
2
Substitute for k in the original
equation.
1
2y = x
1
2
Course 3
12-5 Direct Variation
Mrs. Perez has $4000 in a CD and $4000 in a
money market account. The amount of interest
she has earned since the beginning of the year
is organized in the following table. Determine
whether there is a direct variation between
either of the data sets and time. If so, find the
equation of direct variation.
Additional Example 3: Money Application
Course 3
12-5 Direct Variation
Additional Example 3 Continued
interest from CD and time
interest from CD
time
=
17
1
= = 17
interest from CD
time
34
2
The second and third pairs of data result in a common
ratio. In fact, all of the nonzero interest from CD to
time ratios are equivalent to 17.
The variables are related by a constant ratio of 17 to
1, and (0, 0) is included. The equation of direct
variation is y = 17x, where x is the time, y is the
interest from the CD, and 17 is the constant of
proportionality.
= = = 17
interest from CD
time
= =
17
1
34
2
51
3
68
4
Course 3
12-5 Direct Variation
Additional Example 3 Continued
interest from money market and time
interest from money market
time
= = 1919
1
interest from money market
time
= =18.537
2
19 ≠ 18.5
If any of the ratios are not equal, then there
is no direct variation. It is not necessary to
compute additional ratios or to determine
whether (0, 0) is included.
Course 3
12-5 Direct Variation
Mr. Ortega has $2000 in a CD and $2000 in a
money market account. The amount of interest he
has earned since the beginning of the year is
organized in the following table. Determine
whether there is a direct variation between either
of the data sets and time. If so, find the equation
of direct variation.
Check It Out: Example 3
Course 3
12-5 Direct Variation
Interest Interest from
Time (mo) from CD ($) Money Market ($)
0 0 0
1 12 15
2 30 40
3 40 45
4 50 50
Check It Out: Example 3 Continued
interest from CD
time
=
12
1
interest from CD
time
= = 15
30
2
The second and third pairs of data do not result in a
common ratio.
If any of the ratios are not equal, then there
is no direct variation. It is not necessary to
compute additional ratios or to determine
whether (0, 0) is included.
A. interest from CD and time
Course 3
12-5 Direct Variation
Check It Out: Example 3 Continued
B. interest from money market and time
interest from money market
time
= = 1515
1
interest from money market
time
= =2040
2
15 ≠ 20
If any of the ratios are not equal, then there
is no direct variation. It is not necessary to
compute additional ratios or to determine
whether (0, 0) is included.
Course 3
12-5 Direct Variation
Lesson Quiz: Part I
Find each equation of direct variation, given
that y varies directly with x.
1. y is 78 when x is 3.
2. x is 45 when y is 5.
3. y is 6 when x is 5.
y = 26x
Insert Lesson Title Here
y = x1
9
y = x6
5
Course 3
12-5 Direct Variation
Lesson Quiz: Part II
4. The table shows the amount of money Bob
makes for different amounts of time he works.
Determine whether there is a direct variation
between the two sets of data. If so, find the
equation of direct variation.
Insert Lesson Title Here
direct variation; y = 12x
Course 3
12-5 Direct Variation

Direct Variation

  • 1.
    12-5 Direct Variation Course3 Warm UpWarm Up Problem of the DayProblem of the Day Lesson PresentationLesson Presentation
  • 2.
    Warm Up Use thepoint-slope form of each equation to identify a point the line passes through and the slope of the line. 1. y – 3 = – (x – 9) 2. y + 2 = (x – 5) 3. y – 9 = –2(x + 4) 4. y – 5 = – (x + 7) (–4, 9), –2 Course 3 12-5 Direct Variation 1 7 2 3 1 4 (9, 3), – 1 7 (5, –2), 2 3 (–7, 5), – 1 4
  • 3.
    Problem of theDay Where do the lines defined by the equations y = –5x + 20 and y = 5x – 20 intersect? (4, 0) Course 3 12-5 Direct Variation
  • 4.
    Learn to recognizedirect variation by graphing tables of data and checking for constant ratios. Course 3 12-5 Direct Variation
  • 5.
    Vocabulary direct variation constant ofproportionality Insert Lesson Title Here Course 3 12-5 Direct Variation
  • 6.
  • 7.
    Course 3 12-5 DirectVariation The graph of a direct-variation equation is always linear and always contains the point (0, 0). The variables x and y either increase together or decrease together. Helpful Hint
  • 8.
    Determine whether thedata set shows direct variation. Additional Example 1A: Determining Whether a Data Set Varies Directly Course 3 12-5 Direct Variation
  • 9.
    Make a graphthat shows the relationship between Adam’s age and his length. The graph is not linear. Additional Example 1A Continued Course 3 12-5 Direct Variation
  • 10.
    You can alsocompare ratios to see if a direct variation occurs. 22 3 27 12= ? 81 264 81 ≠ 264 The ratios are not proportional. The relationship of the data is not a direct variation. Additional Example 1A Continued Course 3 12-5 Direct Variation
  • 11.
    Determine whether thedata set shows direct variation. Additional Example 1B: Determining Whether a Data Set Varies Directly Course 3 12-5 Direct Variation
  • 12.
    Make a graphthat shows the relationship between the number of minutes and the distance the train travels. Additional Example 1B Continued Plot the points. The points lie in a straight line. Course 3 12-5 Direct Variation (0, 0) is included.
  • 13.
    You can alsocompare ratios to see if a direct variation occurs. The ratios are proportional. The relationship is a direct variation. 25 10 50 20 75 30 100 40 = = = Compare ratios. Additional Example 1B Continued Course 3 12-5 Direct Variation
  • 14.
    Determine whether thedata set shows direct variation. Check It Out: Example 1A Kyle's Basketball Shots Distance (ft) 20 30 40 Number of Baskets 5 3 0 Course 3 12-5 Direct Variation
  • 15.
    Make a graphthat shows the relationship between number of baskets and distance. The graph is not linear. Check It Out: Example 1A Continued NumberofBaskets Distance (ft) 2 3 4 20 30 40 1 5 Course 3 12-5 Direct Variation
  • 16.
    You can alsocompare ratios to see if a direct variation occurs. Check It Out: Example 1A Continued 5 20 3 30= ? 60 150 150 ≠ 60. The ratios are not proportional. The relationship of the data is not a direct variation. Course 3 12-5 Direct Variation
  • 17.
    Determine whether thedata set shows direct variation. Check It Out: Example 1B Ounces in a Cup Ounces (oz) 8 16 24 32 Cup (c) 1 2 3 4 Course 3 12-5 Direct Variation
  • 18.
    Make a graphthat shows the relationship between ounces and cups. Check It Out: Example 1B Continued NumberofCups Number of Ounces 2 3 4 8 16 24 1 32 Course 3 12-5 Direct Variation Plot the points. The points lie in a straight line. (0, 0) is included.
  • 19.
    You can alsocompare ratios to see if a direct variation occurs. Check It Out: Example 1B Continued Course 3 12-5 Direct Variation The ratios are proportional. The relationship is a direct variation. Compare ratios. = 1 8 = = 2 16 3 24 4 32
  • 20.
    Find each equationof direct variation, given that y varies directly with x. y is 54 when x is 6 Additional Example 2A: Finding Equations of Direct Variation y = kx 54 = k  6 9 = k y = 9x y varies directly with x. Substitute for x and y. Solve for k. Substitute 9 for k in the original equation. Course 3 12-5 Direct Variation
  • 21.
    x is 12when y is 15 Additional Example 2B: Finding Equations of Direct Variation y = kx 15 = k  12 y varies directly with x. Substitute for x and y. Solve for k.= k5 4 Substitute for k in the original equation. 5 4y = x 5 4 Course 3 12-5 Direct Variation
  • 22.
    Find each equationof direct variation, given that y varies directly with x. y is 24 when x is 4 Check It Out: Example 2A y = kx 24 = k  4 6 = k y = 6x y varies directly with x. Substitute for x and y. Solve for k. Substitute 6 for k in the original equation. Course 3 12-5 Direct Variation
  • 23.
    x is 28when y is 14 Check It Out: Example 2B y = kx 14 = k  28 y varies directly with x. Substitute for x and y. Solve for k.= k1 2 Substitute for k in the original equation. 1 2y = x 1 2 Course 3 12-5 Direct Variation
  • 24.
    Mrs. Perez has$4000 in a CD and $4000 in a money market account. The amount of interest she has earned since the beginning of the year is organized in the following table. Determine whether there is a direct variation between either of the data sets and time. If so, find the equation of direct variation. Additional Example 3: Money Application Course 3 12-5 Direct Variation
  • 25.
    Additional Example 3Continued interest from CD and time interest from CD time = 17 1 = = 17 interest from CD time 34 2 The second and third pairs of data result in a common ratio. In fact, all of the nonzero interest from CD to time ratios are equivalent to 17. The variables are related by a constant ratio of 17 to 1, and (0, 0) is included. The equation of direct variation is y = 17x, where x is the time, y is the interest from the CD, and 17 is the constant of proportionality. = = = 17 interest from CD time = = 17 1 34 2 51 3 68 4 Course 3 12-5 Direct Variation
  • 26.
    Additional Example 3Continued interest from money market and time interest from money market time = = 1919 1 interest from money market time = =18.537 2 19 ≠ 18.5 If any of the ratios are not equal, then there is no direct variation. It is not necessary to compute additional ratios or to determine whether (0, 0) is included. Course 3 12-5 Direct Variation
  • 27.
    Mr. Ortega has$2000 in a CD and $2000 in a money market account. The amount of interest he has earned since the beginning of the year is organized in the following table. Determine whether there is a direct variation between either of the data sets and time. If so, find the equation of direct variation. Check It Out: Example 3 Course 3 12-5 Direct Variation Interest Interest from Time (mo) from CD ($) Money Market ($) 0 0 0 1 12 15 2 30 40 3 40 45 4 50 50
  • 28.
    Check It Out:Example 3 Continued interest from CD time = 12 1 interest from CD time = = 15 30 2 The second and third pairs of data do not result in a common ratio. If any of the ratios are not equal, then there is no direct variation. It is not necessary to compute additional ratios or to determine whether (0, 0) is included. A. interest from CD and time Course 3 12-5 Direct Variation
  • 29.
    Check It Out:Example 3 Continued B. interest from money market and time interest from money market time = = 1515 1 interest from money market time = =2040 2 15 ≠ 20 If any of the ratios are not equal, then there is no direct variation. It is not necessary to compute additional ratios or to determine whether (0, 0) is included. Course 3 12-5 Direct Variation
  • 30.
    Lesson Quiz: PartI Find each equation of direct variation, given that y varies directly with x. 1. y is 78 when x is 3. 2. x is 45 when y is 5. 3. y is 6 when x is 5. y = 26x Insert Lesson Title Here y = x1 9 y = x6 5 Course 3 12-5 Direct Variation
  • 31.
    Lesson Quiz: PartII 4. The table shows the amount of money Bob makes for different amounts of time he works. Determine whether there is a direct variation between the two sets of data. If so, find the equation of direct variation. Insert Lesson Title Here direct variation; y = 12x Course 3 12-5 Direct Variation