Downloaded 117 times


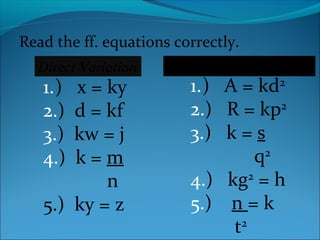
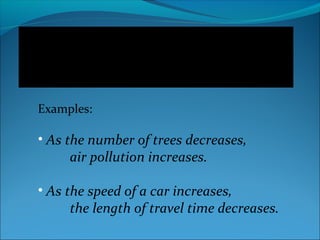
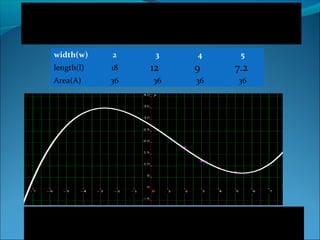

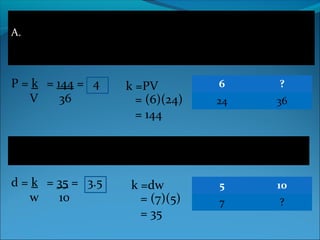
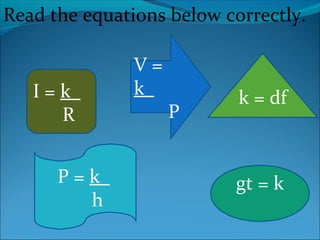

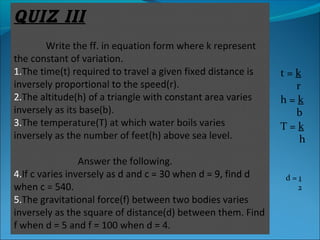


The document discusses different types of variations: 1) Direct variation results in a straight line graph, while direct square variation results in a parabolic graph. 2) Inverse variation means that as one variable increases, the other decreases, maintaining a constant product. The graph of an inverse variation is a hyperbola. 3) Examples show inverse variations between variables like pressure and volume of a gas, or jobs completed and number of workers. 4) Quiz questions test understanding of direct, inverse, and their equation representations.