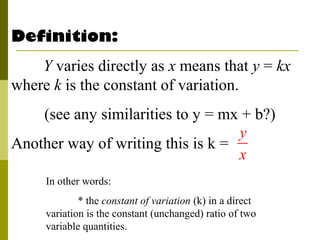
Direct variation describes the relationship between two quantities where one quantity varies as the other changes proportionally. It can be represented by the equation y = kx, where k is the constant of variation.
Some key points about direct variation:
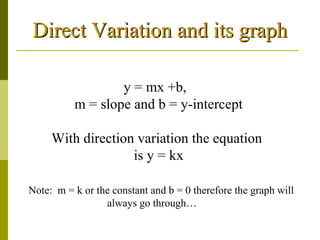
- The graph of a direct variation will pass through the origin, as there is no y-intercept term.
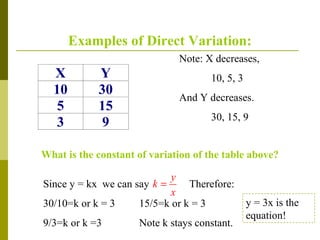
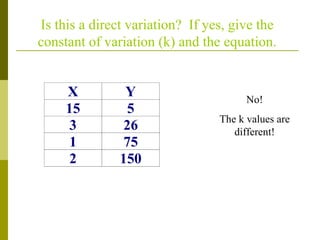
- To determine if a relationship represents direct variation, calculate the constant of variation k from the data and check if it remains the same for different values.
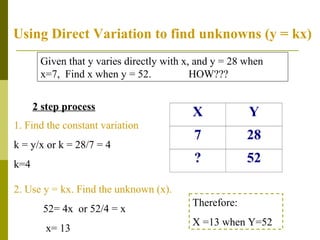
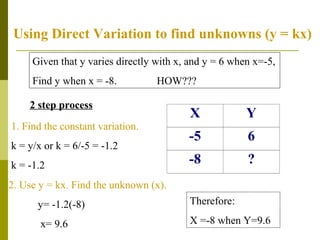
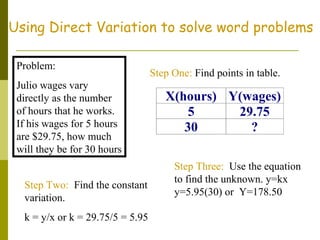
- Direct variation can be used to find unknown values by setting up a table with the known values and using the direct variation equation y = kx.