SlideShare a Scribd company logo
Descriptive Statistics
for one variable
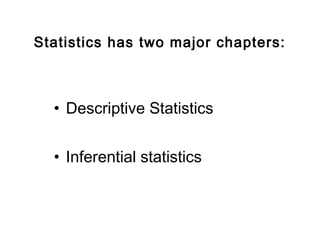
Statistics has two major chapters:
• Descriptive Statistics
• Inferential statistics
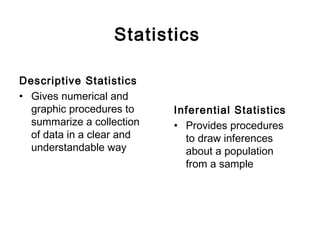
Statistics
Descriptive Statistics
• Gives numerical and
graphic procedures to
summarize a collection
of data in a clear and
understandable way
Inferential Statistics
• Provides procedures
to draw inferences
about a population
from a sample
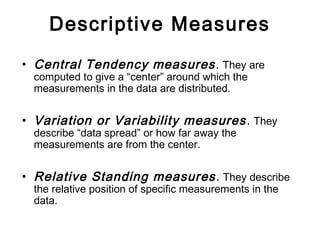
Descriptive Measures
• Central Tendency measures. They are
computed to give a “center” around which the
measurements in the data are distributed.
• Variation or Variability measures. They
describe “data spread” or how far away the
measurements are from the center.
• Relative Standing measures. They describe
the relative position of specific measurements in the
data.
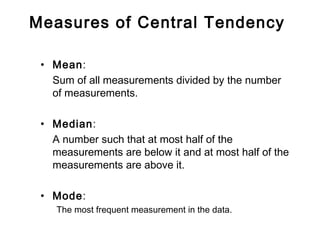
Measures of Central Tendency
• Mean:
Sum of all measurements divided by the number
of measurements.
• Median:
A number such that at most half of the
measurements are below it and at most half of the
measurements are above it.
• Mode:
The most frequent measurement in the data.
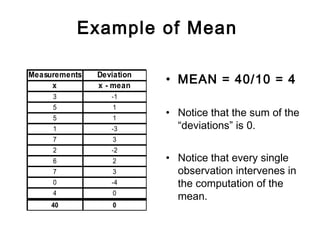
Example of Mean
Measurements Deviation
x x - mean
3 -1
5 1
5 1
1 -3
7 3
2 -2
6 2
7 3
0 -4
4 0
40 0
• MEAN = 40/10 = 4
• Notice that the sum of the
“deviations” is 0.
• Notice that every single
observation intervenes in
the computation of the
mean.
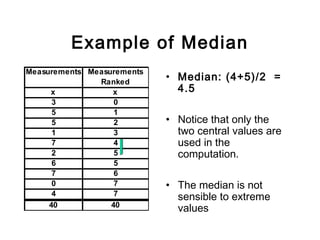
Example of Median
• Median: (4+5)/2 =
4.5
• Notice that only the
two central values are
used in the
computation.
• The median is not
sensible to extreme
values
Measurements Measurements
Ranked
x x
3 0
5 1
5 2
1 3
7 4
2 5
6 5
7 6
0 7
4 7
40 40
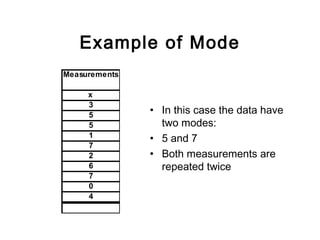
Example of Mode
Measurements
x
3
5
5
1
7
2
6
7
0
4
• In this case the data have
two modes:
• 5 and 7
• Both measurements are
repeated twice
Example of Mode
Measurements
x
3
5
1
1
4
7
3
8
3
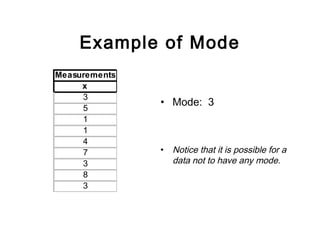
• Mode: 3
• Notice that it is possible for a
data not to have any mode.
Variance (for a sample)
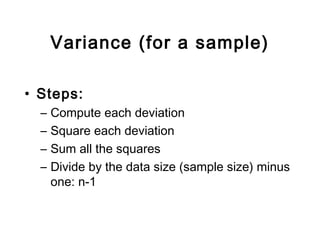
• Steps:
– Compute each deviation
– Square each deviation
– Sum all the squares
– Divide by the data size (sample size) minus
one: n-1
Example of Variance
Measurements Deviations Square of
deviations
x x - mean
3 -1 1
5 1 1
5 1 1
1 -3 9
7 3 9
2 -2 4
6 2 4
7 3 9
0 -4 16
4 0 0
40 0 54
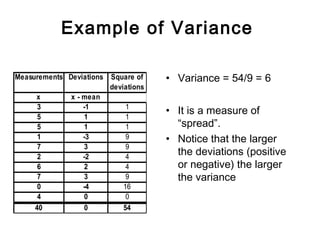
• Variance = 54/9 = 6
• It is a measure of
“spread”.
• Notice that the larger
the deviations (positive
or negative) the larger
the variance
The standard deviation
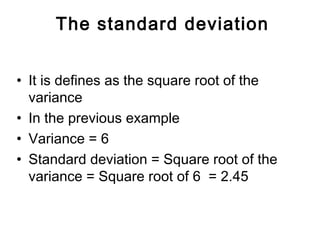
• It is defines as the square root of the
variance
• In the previous example
• Variance = 6
• Standard deviation = Square root of the
variance = Square root of 6 = 2.45
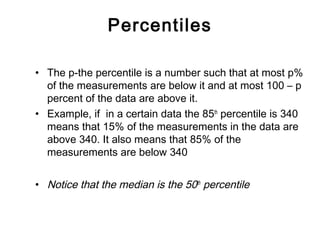
Percentiles
• The p-the percentile is a number such that at most p%
of the measurements are below it and at most 100 – p
percent of the data are above it.
• Example, if in a certain data the 85th
percentile is 340
means that 15% of the measurements in the data are
above 340. It also means that 85% of the
measurements are below 340
• Notice that the median is the 50th
percentile
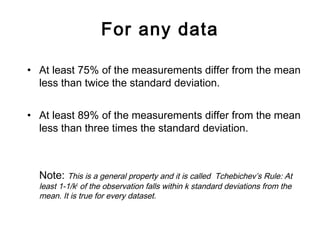
For any data
• At least 75% of the measurements differ from the mean
less than twice the standard deviation.
• At least 89% of the measurements differ from the mean
less than three times the standard deviation.
Note: This is a general property and it is called Tchebichev’s Rule: At
least 1-1/k2
of the observation falls within k standard deviations from the
mean. It is true for every dataset.
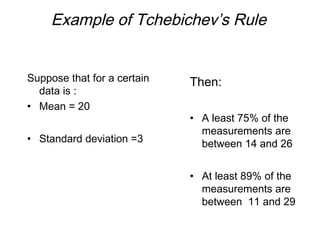
Example of Tchebichev’s Rule
Suppose that for a certain
data is :
• Mean = 20
• Standard deviation =3
Then:
• A least 75% of the
measurements are
between 14 and 26
• At least 89% of the
measurements are
between 11 and 29
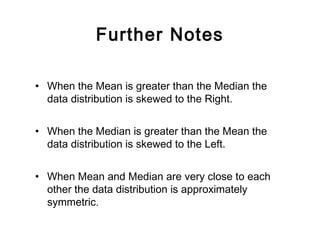
Further Notes
• When the Mean is greater than the Median the
data distribution is skewed to the Right.
• When the Median is greater than the Mean the
data distribution is skewed to the Left.
• When Mean and Median are very close to each
other the data distribution is approximately
symmetric.

More Related Content

What's hot

Inferential statistics
Inferential statisticsInferential statistics
Inferential statistics
Dalia El-Shafei
 
Descriptive Statistics
Descriptive StatisticsDescriptive Statistics
Descriptive Statistics
Neny Isharyanti
 
Descriptive statistics
Descriptive statisticsDescriptive statistics
Descriptive statisticsAiden Yeh
 
Measures of variability
Measures of variabilityMeasures of variability
Measures of variability
jennytuazon01630
 
Basics of Educational Statistics (Descriptive statistics)
Basics of Educational Statistics (Descriptive statistics)Basics of Educational Statistics (Descriptive statistics)
Basics of Educational Statistics (Descriptive statistics)
HennaAnsari
 
Descriptive statistics
Descriptive statisticsDescriptive statistics
Descriptive statisticsAileen Balbido
 
Descriptive Statistics
Descriptive StatisticsDescriptive Statistics
Descriptive Statistics
CIToolkit
 
Analysis and Interpretation of Data
Analysis and Interpretation of DataAnalysis and Interpretation of Data
Analysis and Interpretation of Data
Multan Post Graduate College, Multan
 
Descriptive Statistics
Descriptive StatisticsDescriptive Statistics
Descriptive Statistics
guest290abe
 
Statistics for Data Analytics
Statistics for Data AnalyticsStatistics for Data Analytics
Statistics for Data Analytics
SSaudia
 
Basic concepts of statistics
Basic concepts of statistics Basic concepts of statistics
Basic concepts of statistics
Dr. Trilok Kumar Jain
 
Basics of Educational Statistics (Inferential statistics)
Basics of Educational Statistics (Inferential statistics)Basics of Educational Statistics (Inferential statistics)
Basics of Educational Statistics (Inferential statistics)
HennaAnsari
 
Measures of dispersion
Measures of dispersionMeasures of dispersion
Measures of dispersionDrZahid Khan
 
Descriptive statistics
Descriptive statisticsDescriptive statistics
Descriptive statistics
Hiba Armouche
 
Data Analysis and Statistics
Data Analysis and StatisticsData Analysis and Statistics
Data Analysis and Statistics
T.S. Lim
 
Basic Descriptive statistics
Basic Descriptive statisticsBasic Descriptive statistics
Basic Descriptive statistics
Ajendra Sharma
 
Inferential statistics.ppt
Inferential statistics.pptInferential statistics.ppt
Inferential statistics.pptNursing Path
 
Frequency Distributions
Frequency DistributionsFrequency Distributions
Frequency Distributions
jasondroesch
 
Introduction to Statistics and Statistical Inference
Introduction to Statistics and Statistical InferenceIntroduction to Statistics and Statistical Inference
Introduction to Statistics and Statistical Inference
Jezhabeth Villegas
 
Quantitative data 2
Quantitative data 2Quantitative data 2
Quantitative data 2
Illi Elas
 

What's hot (20)

Inferential statistics
Inferential statisticsInferential statistics
Inferential statistics
 
Descriptive Statistics
Descriptive StatisticsDescriptive Statistics
Descriptive Statistics
 
Descriptive statistics
Descriptive statisticsDescriptive statistics
Descriptive statistics
 
Measures of variability
Measures of variabilityMeasures of variability
Measures of variability
 
Basics of Educational Statistics (Descriptive statistics)
Basics of Educational Statistics (Descriptive statistics)Basics of Educational Statistics (Descriptive statistics)
Basics of Educational Statistics (Descriptive statistics)
 
Descriptive statistics
Descriptive statisticsDescriptive statistics
Descriptive statistics
 
Descriptive Statistics
Descriptive StatisticsDescriptive Statistics
Descriptive Statistics
 
Analysis and Interpretation of Data
Analysis and Interpretation of DataAnalysis and Interpretation of Data
Analysis and Interpretation of Data
 
Descriptive Statistics
Descriptive StatisticsDescriptive Statistics
Descriptive Statistics
 
Statistics for Data Analytics
Statistics for Data AnalyticsStatistics for Data Analytics
Statistics for Data Analytics
 
Basic concepts of statistics
Basic concepts of statistics Basic concepts of statistics
Basic concepts of statistics
 
Basics of Educational Statistics (Inferential statistics)
Basics of Educational Statistics (Inferential statistics)Basics of Educational Statistics (Inferential statistics)
Basics of Educational Statistics (Inferential statistics)
 
Measures of dispersion
Measures of dispersionMeasures of dispersion
Measures of dispersion
 
Descriptive statistics
Descriptive statisticsDescriptive statistics
Descriptive statistics
 
Data Analysis and Statistics
Data Analysis and StatisticsData Analysis and Statistics
Data Analysis and Statistics
 
Basic Descriptive statistics
Basic Descriptive statisticsBasic Descriptive statistics
Basic Descriptive statistics
 
Inferential statistics.ppt
Inferential statistics.pptInferential statistics.ppt
Inferential statistics.ppt
 
Frequency Distributions
Frequency DistributionsFrequency Distributions
Frequency Distributions
 
Introduction to Statistics and Statistical Inference
Introduction to Statistics and Statistical InferenceIntroduction to Statistics and Statistical Inference
Introduction to Statistics and Statistical Inference
 
Quantitative data 2
Quantitative data 2Quantitative data 2
Quantitative data 2
 

Similar to Descriptive statistics -review(2)

Statr sessions 4 to 6
Statr sessions 4 to 6Statr sessions 4 to 6
Statr sessions 4 to 6
Ruru Chowdhury
 
2. chapter ii(analyz)
2. chapter ii(analyz)2. chapter ii(analyz)
2. chapter ii(analyz)
Chhom Karath
 
Chapter 3 Ken Black 2.ppt
Chapter 3 Ken Black 2.pptChapter 3 Ken Black 2.ppt
Chapter 3 Ken Black 2.ppt
NurinaSWGotami
 
Measure of Variability Report.pptx
Measure of Variability Report.pptxMeasure of Variability Report.pptx
Measure of Variability Report.pptx
CalvinAdorDionisio
 
IV STATISTICS I.pdf
IV STATISTICS I.pdfIV STATISTICS I.pdf
IV STATISTICS I.pdf
PyaePhyoKoKo2
 
Ch5-quantitative-data analysis.pptx
Ch5-quantitative-data analysis.pptxCh5-quantitative-data analysis.pptx
Ch5-quantitative-data analysis.pptx
zerihunnana
 
State presentation2
State presentation2State presentation2
State presentation2
Lata Bhatta
 
Business statistics
Business statisticsBusiness statistics
Business statistics
Ravi Prakash
 
Statistics for Medical students
Statistics for Medical studentsStatistics for Medical students
Statistics for Medical students
ANUSWARUM
 
3. Statistical Analysis.pptx
3. Statistical Analysis.pptx3. Statistical Analysis.pptx
3. Statistical Analysis.pptx
jeyanthisivakumar
 
LECTURE 3 - inferential statistics bmaths
LECTURE 3 - inferential statistics bmathsLECTURE 3 - inferential statistics bmaths
LECTURE 3 - inferential statistics bmaths
jafari12
 
Measures of dispersion
Measures of dispersionMeasures of dispersion
Measures of dispersion
Mayuri Joshi
 
Statistics for machine learning shifa noorulain
Statistics for machine learning   shifa noorulainStatistics for machine learning   shifa noorulain
Statistics for machine learning shifa noorulain
ShifaNoorUlAin1
 
trs-9.ppt
trs-9.ppttrs-9.ppt
trs-9.ppt
ssuserbbe0b6
 
Basic statisctis -Anandh Shankar
Basic statisctis -Anandh ShankarBasic statisctis -Anandh Shankar
Basic statisctis -Anandh Shankar
Anandh Shankar Sundararajan
 
Biostatistics mean median mode unit 1.pptx
Biostatistics mean median mode unit 1.pptxBiostatistics mean median mode unit 1.pptx
Biostatistics mean median mode unit 1.pptx
SailajaReddyGunnam
 
Descriptive Analysis.pptx
Descriptive Analysis.pptxDescriptive Analysis.pptx
Descriptive Analysis.pptx
Parveen Vashisth
 

Similar to Descriptive statistics -review(2) (20)

Statr sessions 4 to 6
Statr sessions 4 to 6Statr sessions 4 to 6
Statr sessions 4 to 6
 
2. chapter ii(analyz)
2. chapter ii(analyz)2. chapter ii(analyz)
2. chapter ii(analyz)
 
Chapter 3 Ken Black 2.ppt
Chapter 3 Ken Black 2.pptChapter 3 Ken Black 2.ppt
Chapter 3 Ken Black 2.ppt
 
determinatiion of
determinatiion of determinatiion of
determinatiion of
 
Measure of Variability Report.pptx
Measure of Variability Report.pptxMeasure of Variability Report.pptx
Measure of Variability Report.pptx
 
IV STATISTICS I.pdf
IV STATISTICS I.pdfIV STATISTICS I.pdf
IV STATISTICS I.pdf
 
Ch5-quantitative-data analysis.pptx
Ch5-quantitative-data analysis.pptxCh5-quantitative-data analysis.pptx
Ch5-quantitative-data analysis.pptx
 
State presentation2
State presentation2State presentation2
State presentation2
 
Dscriptive statistics
Dscriptive statisticsDscriptive statistics
Dscriptive statistics
 
Business statistics
Business statisticsBusiness statistics
Business statistics
 
Statistics for Medical students
Statistics for Medical studentsStatistics for Medical students
Statistics for Medical students
 
3. Statistical Analysis.pptx
3. Statistical Analysis.pptx3. Statistical Analysis.pptx
3. Statistical Analysis.pptx
 
LECTURE 3 - inferential statistics bmaths
LECTURE 3 - inferential statistics bmathsLECTURE 3 - inferential statistics bmaths
LECTURE 3 - inferential statistics bmaths
 
Measures of dispersion
Measures of dispersionMeasures of dispersion
Measures of dispersion
 
Statistics for machine learning shifa noorulain
Statistics for machine learning   shifa noorulainStatistics for machine learning   shifa noorulain
Statistics for machine learning shifa noorulain
 
trs-9.ppt
trs-9.ppttrs-9.ppt
trs-9.ppt
 
Basic statisctis -Anandh Shankar
Basic statisctis -Anandh ShankarBasic statisctis -Anandh Shankar
Basic statisctis -Anandh Shankar
 
Statistics
StatisticsStatistics
Statistics
 
Biostatistics mean median mode unit 1.pptx
Biostatistics mean median mode unit 1.pptxBiostatistics mean median mode unit 1.pptx
Biostatistics mean median mode unit 1.pptx
 
Descriptive Analysis.pptx
Descriptive Analysis.pptxDescriptive Analysis.pptx
Descriptive Analysis.pptx
 

More from Hanimarcelo slideshare (14)

Biostatistics
BiostatisticsBiostatistics
Biostatistics
 
Biostatistics
BiostatisticsBiostatistics
Biostatistics
 
History and philosophy of science
History and  philosophy of scienceHistory and  philosophy of science
History and philosophy of science
 
Genetics and evolution
Genetics and evolutionGenetics and evolution
Genetics and evolution
 
Biostatistics
BiostatisticsBiostatistics
Biostatistics
 
Understanding inferential statistics
Understanding inferential statisticsUnderstanding inferential statistics
Understanding inferential statistics
 
Plant morphology
Plant morphologyPlant morphology
Plant morphology
 
Animals let
Animals letAnimals let
Animals let
 
Philsophical foundation of Curriculum
Philsophical foundation of CurriculumPhilsophical foundation of Curriculum
Philsophical foundation of Curriculum
 
Problem Centered Approach
Problem Centered ApproachProblem Centered Approach
Problem Centered Approach
 
Professional Organization
 Professional Organization Professional Organization
Professional Organization
 
Curriculum Design Models
Curriculum Design ModelsCurriculum Design Models
Curriculum Design Models
 
Classroom management
Classroom managementClassroom management
Classroom management
 
Curriculum development internal stakeholders
Curriculum development internal stakeholdersCurriculum development internal stakeholders
Curriculum development internal stakeholders
 

Recently uploaded

Pushing the limits of ePRTC: 100ns holdover for 100 days
Pushing the limits of ePRTC: 100ns holdover for 100 daysPushing the limits of ePRTC: 100ns holdover for 100 days
Pushing the limits of ePRTC: 100ns holdover for 100 days
Adtran
 
Free Complete Python - A step towards Data Science
Free Complete Python - A step towards Data ScienceFree Complete Python - A step towards Data Science
Free Complete Python - A step towards Data Science
RinaMondal9
 
Mind map of terminologies used in context of Generative AI
Mind map of terminologies used in context of Generative AIMind map of terminologies used in context of Generative AI
Mind map of terminologies used in context of Generative AI
Kumud Singh
 
A tale of scale & speed: How the US Navy is enabling software delivery from l...
A tale of scale & speed: How the US Navy is enabling software delivery from l...A tale of scale & speed: How the US Navy is enabling software delivery from l...
A tale of scale & speed: How the US Navy is enabling software delivery from l...
sonjaschweigert1
 
みなさんこんにちはこれ何文字まで入るの?40文字以下不可とか本当に意味わからないけどこれ限界文字数書いてないからマジでやばい文字数いけるんじゃないの?えこ...
みなさんこんにちはこれ何文字まで入るの?40文字以下不可とか本当に意味わからないけどこれ限界文字数書いてないからマジでやばい文字数いけるんじゃないの?えこ...みなさんこんにちはこれ何文字まで入るの?40文字以下不可とか本当に意味わからないけどこれ限界文字数書いてないからマジでやばい文字数いけるんじゃないの?えこ...
みなさんこんにちはこれ何文字まで入るの?40文字以下不可とか本当に意味わからないけどこれ限界文字数書いてないからマジでやばい文字数いけるんじゃないの?えこ...
名前 です男
 
LF Energy Webinar: Electrical Grid Modelling and Simulation Through PowSyBl -...
LF Energy Webinar: Electrical Grid Modelling and Simulation Through PowSyBl -...LF Energy Webinar: Electrical Grid Modelling and Simulation Through PowSyBl -...
LF Energy Webinar: Electrical Grid Modelling and Simulation Through PowSyBl -...
DanBrown980551
 
20240607 QFM018 Elixir Reading List May 2024
20240607 QFM018 Elixir Reading List May 202420240607 QFM018 Elixir Reading List May 2024
20240607 QFM018 Elixir Reading List May 2024
Matthew Sinclair
 
Uni Systems Copilot event_05062024_C.Vlachos.pdf
Uni Systems Copilot event_05062024_C.Vlachos.pdfUni Systems Copilot event_05062024_C.Vlachos.pdf
Uni Systems Copilot event_05062024_C.Vlachos.pdf
Uni Systems S.M.S.A.
 
GridMate - End to end testing is a critical piece to ensure quality and avoid...
GridMate - End to end testing is a critical piece to ensure quality and avoid...GridMate - End to end testing is a critical piece to ensure quality and avoid...
GridMate - End to end testing is a critical piece to ensure quality and avoid...
ThomasParaiso2
 
Generative AI Deep Dive: Advancing from Proof of Concept to Production
Generative AI Deep Dive: Advancing from Proof of Concept to ProductionGenerative AI Deep Dive: Advancing from Proof of Concept to Production
Generative AI Deep Dive: Advancing from Proof of Concept to Production
Aggregage
 
The Art of the Pitch: WordPress Relationships and Sales
The Art of the Pitch: WordPress Relationships and SalesThe Art of the Pitch: WordPress Relationships and Sales
The Art of the Pitch: WordPress Relationships and Sales
Laura Byrne
 
GraphSummit Singapore | The Art of the Possible with Graph - Q2 2024
GraphSummit Singapore | The Art of the  Possible with Graph - Q2 2024GraphSummit Singapore | The Art of the  Possible with Graph - Q2 2024
GraphSummit Singapore | The Art of the Possible with Graph - Q2 2024
Neo4j
 
GraphSummit Singapore | The Future of Agility: Supercharging Digital Transfor...
GraphSummit Singapore | The Future of Agility: Supercharging Digital Transfor...GraphSummit Singapore | The Future of Agility: Supercharging Digital Transfor...
GraphSummit Singapore | The Future of Agility: Supercharging Digital Transfor...
Neo4j
 
Observability Concepts EVERY Developer Should Know -- DeveloperWeek Europe.pdf
Observability Concepts EVERY Developer Should Know -- DeveloperWeek Europe.pdfObservability Concepts EVERY Developer Should Know -- DeveloperWeek Europe.pdf
Observability Concepts EVERY Developer Should Know -- DeveloperWeek Europe.pdf
Paige Cruz
 
GraphSummit Singapore | Neo4j Product Vision & Roadmap - Q2 2024
GraphSummit Singapore | Neo4j Product Vision & Roadmap - Q2 2024GraphSummit Singapore | Neo4j Product Vision & Roadmap - Q2 2024
GraphSummit Singapore | Neo4j Product Vision & Roadmap - Q2 2024
Neo4j
 
Essentials of Automations: The Art of Triggers and Actions in FME
Essentials of Automations: The Art of Triggers and Actions in FMEEssentials of Automations: The Art of Triggers and Actions in FME
Essentials of Automations: The Art of Triggers and Actions in FME
Safe Software
 
Epistemic Interaction - tuning interfaces to provide information for AI support
Epistemic Interaction - tuning interfaces to provide information for AI supportEpistemic Interaction - tuning interfaces to provide information for AI support
Epistemic Interaction - tuning interfaces to provide information for AI support
Alan Dix
 
Communications Mining Series - Zero to Hero - Session 1
Communications Mining Series - Zero to Hero - Session 1Communications Mining Series - Zero to Hero - Session 1
Communications Mining Series - Zero to Hero - Session 1
DianaGray10
 
Climate Impact of Software Testing at Nordic Testing Days
Climate Impact of Software Testing at Nordic Testing DaysClimate Impact of Software Testing at Nordic Testing Days
Climate Impact of Software Testing at Nordic Testing Days
Kari Kakkonen
 
FIDO Alliance Osaka Seminar: The WebAuthn API and Discoverable Credentials.pdf
FIDO Alliance Osaka Seminar: The WebAuthn API and Discoverable Credentials.pdfFIDO Alliance Osaka Seminar: The WebAuthn API and Discoverable Credentials.pdf
FIDO Alliance Osaka Seminar: The WebAuthn API and Discoverable Credentials.pdf
FIDO Alliance
 

Recently uploaded (20)

Pushing the limits of ePRTC: 100ns holdover for 100 days
Pushing the limits of ePRTC: 100ns holdover for 100 daysPushing the limits of ePRTC: 100ns holdover for 100 days
Pushing the limits of ePRTC: 100ns holdover for 100 days
 
Free Complete Python - A step towards Data Science
Free Complete Python - A step towards Data ScienceFree Complete Python - A step towards Data Science
Free Complete Python - A step towards Data Science
 
Mind map of terminologies used in context of Generative AI
Mind map of terminologies used in context of Generative AIMind map of terminologies used in context of Generative AI
Mind map of terminologies used in context of Generative AI
 
A tale of scale & speed: How the US Navy is enabling software delivery from l...
A tale of scale & speed: How the US Navy is enabling software delivery from l...A tale of scale & speed: How the US Navy is enabling software delivery from l...
A tale of scale & speed: How the US Navy is enabling software delivery from l...
 
みなさんこんにちはこれ何文字まで入るの?40文字以下不可とか本当に意味わからないけどこれ限界文字数書いてないからマジでやばい文字数いけるんじゃないの?えこ...
みなさんこんにちはこれ何文字まで入るの?40文字以下不可とか本当に意味わからないけどこれ限界文字数書いてないからマジでやばい文字数いけるんじゃないの?えこ...みなさんこんにちはこれ何文字まで入るの?40文字以下不可とか本当に意味わからないけどこれ限界文字数書いてないからマジでやばい文字数いけるんじゃないの?えこ...
みなさんこんにちはこれ何文字まで入るの?40文字以下不可とか本当に意味わからないけどこれ限界文字数書いてないからマジでやばい文字数いけるんじゃないの?えこ...
 
LF Energy Webinar: Electrical Grid Modelling and Simulation Through PowSyBl -...
LF Energy Webinar: Electrical Grid Modelling and Simulation Through PowSyBl -...LF Energy Webinar: Electrical Grid Modelling and Simulation Through PowSyBl -...
LF Energy Webinar: Electrical Grid Modelling and Simulation Through PowSyBl -...
 
20240607 QFM018 Elixir Reading List May 2024
20240607 QFM018 Elixir Reading List May 202420240607 QFM018 Elixir Reading List May 2024
20240607 QFM018 Elixir Reading List May 2024
 
Uni Systems Copilot event_05062024_C.Vlachos.pdf
Uni Systems Copilot event_05062024_C.Vlachos.pdfUni Systems Copilot event_05062024_C.Vlachos.pdf
Uni Systems Copilot event_05062024_C.Vlachos.pdf
 
GridMate - End to end testing is a critical piece to ensure quality and avoid...
GridMate - End to end testing is a critical piece to ensure quality and avoid...GridMate - End to end testing is a critical piece to ensure quality and avoid...
GridMate - End to end testing is a critical piece to ensure quality and avoid...
 
Generative AI Deep Dive: Advancing from Proof of Concept to Production
Generative AI Deep Dive: Advancing from Proof of Concept to ProductionGenerative AI Deep Dive: Advancing from Proof of Concept to Production
Generative AI Deep Dive: Advancing from Proof of Concept to Production
 
The Art of the Pitch: WordPress Relationships and Sales
The Art of the Pitch: WordPress Relationships and SalesThe Art of the Pitch: WordPress Relationships and Sales
The Art of the Pitch: WordPress Relationships and Sales
 
GraphSummit Singapore | The Art of the Possible with Graph - Q2 2024
GraphSummit Singapore | The Art of the  Possible with Graph - Q2 2024GraphSummit Singapore | The Art of the  Possible with Graph - Q2 2024
GraphSummit Singapore | The Art of the Possible with Graph - Q2 2024
 
GraphSummit Singapore | The Future of Agility: Supercharging Digital Transfor...
GraphSummit Singapore | The Future of Agility: Supercharging Digital Transfor...GraphSummit Singapore | The Future of Agility: Supercharging Digital Transfor...
GraphSummit Singapore | The Future of Agility: Supercharging Digital Transfor...
 
Observability Concepts EVERY Developer Should Know -- DeveloperWeek Europe.pdf
Observability Concepts EVERY Developer Should Know -- DeveloperWeek Europe.pdfObservability Concepts EVERY Developer Should Know -- DeveloperWeek Europe.pdf
Observability Concepts EVERY Developer Should Know -- DeveloperWeek Europe.pdf
 
GraphSummit Singapore | Neo4j Product Vision & Roadmap - Q2 2024
GraphSummit Singapore | Neo4j Product Vision & Roadmap - Q2 2024GraphSummit Singapore | Neo4j Product Vision & Roadmap - Q2 2024
GraphSummit Singapore | Neo4j Product Vision & Roadmap - Q2 2024
 
Essentials of Automations: The Art of Triggers and Actions in FME
Essentials of Automations: The Art of Triggers and Actions in FMEEssentials of Automations: The Art of Triggers and Actions in FME
Essentials of Automations: The Art of Triggers and Actions in FME
 
Epistemic Interaction - tuning interfaces to provide information for AI support
Epistemic Interaction - tuning interfaces to provide information for AI supportEpistemic Interaction - tuning interfaces to provide information for AI support
Epistemic Interaction - tuning interfaces to provide information for AI support
 
Communications Mining Series - Zero to Hero - Session 1
Communications Mining Series - Zero to Hero - Session 1Communications Mining Series - Zero to Hero - Session 1
Communications Mining Series - Zero to Hero - Session 1
 
Climate Impact of Software Testing at Nordic Testing Days
Climate Impact of Software Testing at Nordic Testing DaysClimate Impact of Software Testing at Nordic Testing Days
Climate Impact of Software Testing at Nordic Testing Days
 
FIDO Alliance Osaka Seminar: The WebAuthn API and Discoverable Credentials.pdf
FIDO Alliance Osaka Seminar: The WebAuthn API and Discoverable Credentials.pdfFIDO Alliance Osaka Seminar: The WebAuthn API and Discoverable Credentials.pdf
FIDO Alliance Osaka Seminar: The WebAuthn API and Discoverable Credentials.pdf
 

Descriptive statistics -review(2)

  • 2. Statistics has two major chapters: • Descriptive Statistics • Inferential statistics
  • 3. Statistics Descriptive Statistics • Gives numerical and graphic procedures to summarize a collection of data in a clear and understandable way Inferential Statistics • Provides procedures to draw inferences about a population from a sample
  • 4. Descriptive Measures • Central Tendency measures. They are computed to give a “center” around which the measurements in the data are distributed. • Variation or Variability measures. They describe “data spread” or how far away the measurements are from the center. • Relative Standing measures. They describe the relative position of specific measurements in the data.
  • 5. Measures of Central Tendency • Mean: Sum of all measurements divided by the number of measurements. • Median: A number such that at most half of the measurements are below it and at most half of the measurements are above it. • Mode: The most frequent measurement in the data.
  • 6. Example of Mean Measurements Deviation x x - mean 3 -1 5 1 5 1 1 -3 7 3 2 -2 6 2 7 3 0 -4 4 0 40 0 • MEAN = 40/10 = 4 • Notice that the sum of the “deviations” is 0. • Notice that every single observation intervenes in the computation of the mean.
  • 7. Example of Median • Median: (4+5)/2 = 4.5 • Notice that only the two central values are used in the computation. • The median is not sensible to extreme values Measurements Measurements Ranked x x 3 0 5 1 5 2 1 3 7 4 2 5 6 5 7 6 0 7 4 7 40 40
  • 8. Example of Mode Measurements x 3 5 5 1 7 2 6 7 0 4 • In this case the data have two modes: • 5 and 7 • Both measurements are repeated twice
  • 9. Example of Mode Measurements x 3 5 1 1 4 7 3 8 3 • Mode: 3 • Notice that it is possible for a data not to have any mode.
  • 10. Variance (for a sample) • Steps: – Compute each deviation – Square each deviation – Sum all the squares – Divide by the data size (sample size) minus one: n-1
  • 11. Example of Variance Measurements Deviations Square of deviations x x - mean 3 -1 1 5 1 1 5 1 1 1 -3 9 7 3 9 2 -2 4 6 2 4 7 3 9 0 -4 16 4 0 0 40 0 54 • Variance = 54/9 = 6 • It is a measure of “spread”. • Notice that the larger the deviations (positive or negative) the larger the variance
  • 12. The standard deviation • It is defines as the square root of the variance • In the previous example • Variance = 6 • Standard deviation = Square root of the variance = Square root of 6 = 2.45
  • 13. Percentiles • The p-the percentile is a number such that at most p% of the measurements are below it and at most 100 – p percent of the data are above it. • Example, if in a certain data the 85th percentile is 340 means that 15% of the measurements in the data are above 340. It also means that 85% of the measurements are below 340 • Notice that the median is the 50th percentile
  • 14. For any data • At least 75% of the measurements differ from the mean less than twice the standard deviation. • At least 89% of the measurements differ from the mean less than three times the standard deviation. Note: This is a general property and it is called Tchebichev’s Rule: At least 1-1/k2 of the observation falls within k standard deviations from the mean. It is true for every dataset.
  • 15. Example of Tchebichev’s Rule Suppose that for a certain data is : • Mean = 20 • Standard deviation =3 Then: • A least 75% of the measurements are between 14 and 26 • At least 89% of the measurements are between 11 and 29
  • 16. Further Notes • When the Mean is greater than the Median the data distribution is skewed to the Right. • When the Median is greater than the Mean the data distribution is skewed to the Left. • When Mean and Median are very close to each other the data distribution is approximately symmetric.