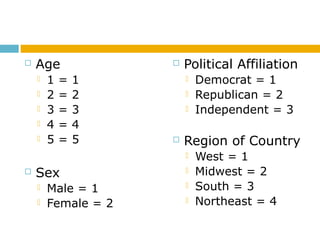
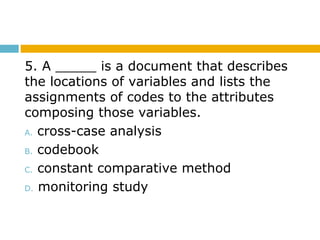
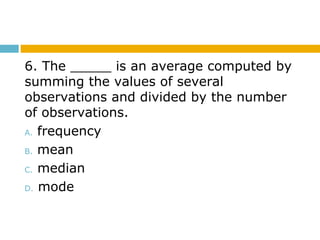
SlideShare a Scribd company logo
1 of 47
CHAPTER 14,
QUANTITATIVE DATA
ANALYSIS
Chapter Outline
 Quantification of Data
 Univariate Analysis
 Subgroup Comparisons
 Bivariate Analysis
 Introduction to Multivariate Analysis
 Sociological Diagnostics
 Ethics and Quantitative Data Analysis
 Quick Quiz
Quantification of Data
 Quantification Analysis – The numerical
representation and manipulation of
observations for the purpose of
describing and explaining the
phenomena that those observations
reflect.
 Age
 1 = 1
 2 = 2
 3 = 3
 4 = 4
 5 = 5
 Sex
 Male = 1
 Female = 2
 Political Affiliation
 Democrat = 1
 Republican = 2
 Independent = 3
 Region of Country
 West = 1
 Midwest = 2
 South = 3
 Northeast = 4
 Develop Code Categories
1. Use well-developed coding scheme.
2. Generate codes from your data.
 Codebook Construction
 Codebook – The document used in data
processing and analysis that tells the
location of different data items in a data
file.
 The codebook also identifies the locations of
data items and the meaning of the codes used.
 Purposes of the Codebook
1. Primary guide in the coking processes
2. Guide for locating variables
Figure 14.1
ATTEND
How often do you attend religious services?
0. Never
1. Less than once a year
2. About once or twice a year
3. Several times a year
4. About once a month
5. 2-3 times a month
6. Nearly every week
7. Every week
8. Several times a week
9. Don’t know, No answer
Abbreviated Variable
Name
NumericalLabel
Definition of the
Variable
Variable
Attributes
 Data Entry
 Excel
 SPSS
Univariate Analysis
 Univariate Analysis – The analysis of a
single variable, for purposes of
description (examples: frequency
distribution, averages, and measures of
dispersion).
 Example: Gender
 The number of men in a sample/population and
the number of women in a sample/population.
 Distributions
 Frequency Distributions – A description of
the number of times the various attributes
of a variable are observed in a sample.
Figure 14.3
Figure 14.4
 Central Tendency
 Average – An ambiguous term generally
suggesting typical or normal – a central
tendency (examples: mean, median,
mode).
 Mean – an average computed by summing
the values of several observations and
dividing by the number of observations.
 Mode- an average representing the most
frequently observed value or attribute.
 Median – an average representing the value
of the “middle” case in a rank-ordered set
of observations.
 Practice: The following list represents the
scores on a mid-term exam.
 100, 94, 88, 91, 75, 61, 93, 82, 70, 88, 71, 88
 Determine the mean.
 Determine the mode.
 Determine the median.
Figure 14.5
 Dispersion – The distribution of values
around some central value, such as an
average.
 Standard Deviation – A measure of
dispersion around the mean, calculated so
that approximately 68 percent of the cases
will lie within plus or minus one standard
deviation from the mean, 95 percent within
two, and 99.9 percent within three standard
deviations.
Figure 14.6
 Continuous Variable – A variable whose
attributes form a steady progression,
such as age of income.
 Discrete Variable – A variable whose
attributes are separate from one
another, such as gender or political
affiliation.
 Detail versus Manageability
 Provide reader with fullest degree of detail,
balanced with presenting data in a
manageable form.
Subgroup Comparisons
 Description of subsets of cases, subjects
or respondents.
 “Collapsing” Response Categories
 Handling “Don’t Knows”
 Numerical Descriptions in Qualitative
Research
Bivariate Analysis
 Bivariate Analysis – The analysis of two
variables simultaneously, for the
purpose of determine the empirical
relationship between them.
 Constructing a Bivariate Table
1. Determine logical direction of relationship
(independent variable and dependent
variable).
2. Percentage down versus percentage
across.
Figure 14.7
 Percentaging a
Table
 Constructing and Reading Bivariate Tables
 Example: Gender and Attitude toward
Sexual Equality
1. The cases are divided into men and women.
2. Each gender subgrouping is described in
terms of approval or disapproval of sexual
equality.
3. Men and women are compared in terms of the
percentages approving of sexual equality.
 Contingency Table – A format for
presenting the relationship among
variables as percentage distributions.
 Guidelines for Presentation of Tables
1. A table should have a heading or title that
describes what is contained in the table.
2. Original content should be clearly
presented.
3. The attributes of each variable should be
clearly indicated.
4. The base on which percentage are
computed should be indicated.
5. Missing data should be indicated in the
table.
Introduction to Multivariate
Analysis
 Multivariate Analysis – The analysis of
the simultaneous relationships among
several variables.
Quick Quiz
1. To conduct a quantitative analysis,
researchers often must engage in a _____
after the data have been collected.
A. coding process
B. case-oriented analysis
C. experimental analysis
D. field research study
Answer: A.
To conduct a quantitative analysis,
researchers often must engage in a
coding process after the data have been
collected.
2. Which of the following describe the
analysis of more than two variables?
A. experimental designs
B. quasi-experimental designs
C. qualitative evaluations
D. multivariate analysis
Answer: D.
Multivariate analyses describe the analysis
of more than two variables.
3. The process of converting data to
numerical format is called _____.
A. feminist research
B. qualification
C. quantification
ANSWER: C.
The process of converting data to
numerical format is called quantification.
4. Which of the following are basic
approaches to the coding process?
A. You can begin with a well developed
coding scheme.
B. You can generate codes from your data.
C. both of the above
D. none of the above
ANSWER: C.
The following are basic approaches to the
coding process: you can begin with a well
developing coding scheme and/or you can
generate codes from your data.
5. A _____ is a document that describes
the locations of variables and lists the
assignments of codes to the attributes
composing those variables.
A. cross-case analysis
B. codebook
C. constant comparative method
D. monitoring study
ANSWER: B.
A codebook is a document that describes
the locations of variables and lists the
assignments of codes to the attributes
composing those variables.
6. The _____ is an average computed by
summing the values of several
observations and divided by the number
of observations.
A. frequency
B. mean
C. median
D. mode
ANSWER: B.
The mean is an average computed by
summing the values of several
observations and divided by the number
of observations.
7. Which of the following are aimed at
explanation?
A. multivariate analysis
B. bivariate analysis
C. univariate analysis
D. both A and B
ANSWER: D.
Multivariate analysis and bivariate analysis
are aimed at explanation.
8. The multivariate techniques can serve
as power tools for
A. predicting behavior.
B. diagnosing social problems.
C. reacting to issues.
D. all of the above
ANSWER: B.
The multivariate techniques can serve as
powerful tools for diagnosing social
problems.

More Related Content

What's hot

Descriptive statistics
Descriptive statisticsDescriptive statistics
Descriptive statisticsAttaullah Khan
 
Analysis of data in research
Analysis of data in researchAnalysis of data in research
Analysis of data in researchAbhijeet Birari
 
Descriptive statistics
Descriptive statisticsDescriptive statistics
Descriptive statisticsSarfraz Ahmad
 
Descriptive statistics
Descriptive statisticsDescriptive statistics
Descriptive statisticsAileen Balbido
 
Qualitative research, types, data collection and analysis
Qualitative research, types, data collection and analysisQualitative research, types, data collection and analysis
Qualitative research, types, data collection and analysisVijayalakshmi Murugesan
 
Statistical Data Analysis | Data Analysis | Statistics Services | Data Collec...
Statistical Data Analysis | Data Analysis | Statistics Services | Data Collec...Statistical Data Analysis | Data Analysis | Statistics Services | Data Collec...
Statistical Data Analysis | Data Analysis | Statistics Services | Data Collec...Stats Statswork
 
HYPOTHESIS TESTING
HYPOTHESIS TESTINGHYPOTHESIS TESTING
HYPOTHESIS TESTINGAmna Sheikh
 
Qualitative research
Qualitative researchQualitative research
Qualitative researchProtik Roy
 
Descriptive Statistics
Descriptive StatisticsDescriptive Statistics
Descriptive StatisticsCIToolkit
 
Chapter 8 Data analysis and interpretation ( 2007 book )
Chapter 8 Data analysis and interpretation ( 2007 book )Chapter 8 Data analysis and interpretation ( 2007 book )
Chapter 8 Data analysis and interpretation ( 2007 book )John Carlo De Juras
 
Lecture 4: Statistical Inference
Lecture 4: Statistical InferenceLecture 4: Statistical Inference
Lecture 4: Statistical InferenceMarina Santini
 
Sampling techniques and types
Sampling techniques and typesSampling techniques and types
Sampling techniques and typesNITISH SADOTRA
 

What's hot (20)

Quantitative data analysis
Quantitative data analysisQuantitative data analysis
Quantitative data analysis
 
Sampling techniques
Sampling techniquesSampling techniques
Sampling techniques
 
Descriptive statistics
Descriptive statisticsDescriptive statistics
Descriptive statistics
 
Analysis of data in research
Analysis of data in researchAnalysis of data in research
Analysis of data in research
 
Research design
Research design Research design
Research design
 
Descriptive statistics
Descriptive statisticsDescriptive statistics
Descriptive statistics
 
Descriptive statistics
Descriptive statisticsDescriptive statistics
Descriptive statistics
 
Descriptive Statistics
Descriptive StatisticsDescriptive Statistics
Descriptive Statistics
 
Qualitative Research
Qualitative ResearchQualitative Research
Qualitative Research
 
Qualitative research, types, data collection and analysis
Qualitative research, types, data collection and analysisQualitative research, types, data collection and analysis
Qualitative research, types, data collection and analysis
 
Statistical Data Analysis | Data Analysis | Statistics Services | Data Collec...
Statistical Data Analysis | Data Analysis | Statistics Services | Data Collec...Statistical Data Analysis | Data Analysis | Statistics Services | Data Collec...
Statistical Data Analysis | Data Analysis | Statistics Services | Data Collec...
 
HYPOTHESIS TESTING
HYPOTHESIS TESTINGHYPOTHESIS TESTING
HYPOTHESIS TESTING
 
Qualitative research
Qualitative researchQualitative research
Qualitative research
 
Descriptive Statistics
Descriptive StatisticsDescriptive Statistics
Descriptive Statistics
 
Chapter 8 Data analysis and interpretation ( 2007 book )
Chapter 8 Data analysis and interpretation ( 2007 book )Chapter 8 Data analysis and interpretation ( 2007 book )
Chapter 8 Data analysis and interpretation ( 2007 book )
 
Hypothesis testing
Hypothesis testingHypothesis testing
Hypothesis testing
 
Sampling
Sampling Sampling
Sampling
 
Lecture 4: Statistical Inference
Lecture 4: Statistical InferenceLecture 4: Statistical Inference
Lecture 4: Statistical Inference
 
Quantitative Research
Quantitative ResearchQuantitative Research
Quantitative Research
 
Sampling techniques and types
Sampling techniques and typesSampling techniques and types
Sampling techniques and types
 

Similar to Quantitative data 2

Unit 8 data analysis and interpretation
Unit 8 data analysis and interpretationUnit 8 data analysis and interpretation
Unit 8 data analysis and interpretationAsima shahzadi
 
Chapter 4 MMW.pdf
Chapter 4 MMW.pdfChapter 4 MMW.pdf
Chapter 4 MMW.pdfRaRaRamirez
 
Research methodology - Analysis of Data
Research methodology - Analysis of DataResearch methodology - Analysis of Data
Research methodology - Analysis of DataThe Stockker
 
Statistics for Managers pptS for better understanding
Statistics for Managers pptS for better understandingStatistics for Managers pptS for better understanding
Statistics for Managers pptS for better understandingShamshadAli58
 
Data Analysis & Interpretation and Report Writing
Data Analysis & Interpretation and Report WritingData Analysis & Interpretation and Report Writing
Data Analysis & Interpretation and Report WritingSOMASUNDARAM T
 
Data analysis presentation by Jameel Ahmed Qureshi
Data analysis presentation by Jameel Ahmed QureshiData analysis presentation by Jameel Ahmed Qureshi
Data analysis presentation by Jameel Ahmed QureshiJameel Ahmed Qureshi
 
QUANTITATIVE METHODS NOTES.pdf
QUANTITATIVE METHODS NOTES.pdfQUANTITATIVE METHODS NOTES.pdf
QUANTITATIVE METHODS NOTES.pdfBensonNduati1
 
Scope and objective of the assignment
Scope and objective of the assignmentScope and objective of the assignment
Scope and objective of the assignmentGourab Chakraborty
 
April Heyward Research Methods Class Session - 8-5-2021
April Heyward Research Methods Class Session - 8-5-2021April Heyward Research Methods Class Session - 8-5-2021
April Heyward Research Methods Class Session - 8-5-2021April Heyward
 
Survey and correlational research (1)
Survey and correlational research (1)Survey and correlational research (1)
Survey and correlational research (1)zuraiberahim
 
Analysing/Interpreting Quantitative Research
Analysing/Interpreting  Quantitative Research Analysing/Interpreting  Quantitative Research
Analysing/Interpreting Quantitative Research HariBolKafle
 
CABT Math 8 measures of central tendency and dispersion
CABT Math 8   measures of central tendency and dispersionCABT Math 8   measures of central tendency and dispersion
CABT Math 8 measures of central tendency and dispersionGilbert Joseph Abueg
 
Level of Measurement, Frequency Distribution,Stem & Leaf
Level of Measurement, Frequency Distribution,Stem & Leaf   Level of Measurement, Frequency Distribution,Stem & Leaf
Level of Measurement, Frequency Distribution,Stem & Leaf Qasim Raza
 

Similar to Quantitative data 2 (20)

Unit 8 data analysis and interpretation
Unit 8 data analysis and interpretationUnit 8 data analysis and interpretation
Unit 8 data analysis and interpretation
 
Chapter 4 MMW.pdf
Chapter 4 MMW.pdfChapter 4 MMW.pdf
Chapter 4 MMW.pdf
 
Research methodology - Analysis of Data
Research methodology - Analysis of DataResearch methodology - Analysis of Data
Research methodology - Analysis of Data
 
Statistics for Managers pptS for better understanding
Statistics for Managers pptS for better understandingStatistics for Managers pptS for better understanding
Statistics for Managers pptS for better understanding
 
Data Analysis & Interpretation and Report Writing
Data Analysis & Interpretation and Report WritingData Analysis & Interpretation and Report Writing
Data Analysis & Interpretation and Report Writing
 
Chapter 10-DATA ANALYSIS & PRESENTATION
Chapter 10-DATA ANALYSIS & PRESENTATIONChapter 10-DATA ANALYSIS & PRESENTATION
Chapter 10-DATA ANALYSIS & PRESENTATION
 
Data analysis presentation by Jameel Ahmed Qureshi
Data analysis presentation by Jameel Ahmed QureshiData analysis presentation by Jameel Ahmed Qureshi
Data analysis presentation by Jameel Ahmed Qureshi
 
Analysis of data.pptx
Analysis of data.pptxAnalysis of data.pptx
Analysis of data.pptx
 
Module 8-S M & T C I, Regular.pptx
Module 8-S M & T C I, Regular.pptxModule 8-S M & T C I, Regular.pptx
Module 8-S M & T C I, Regular.pptx
 
QUANTITATIVE METHODS NOTES.pdf
QUANTITATIVE METHODS NOTES.pdfQUANTITATIVE METHODS NOTES.pdf
QUANTITATIVE METHODS NOTES.pdf
 
Scope and objective of the assignment
Scope and objective of the assignmentScope and objective of the assignment
Scope and objective of the assignment
 
April Heyward Research Methods Class Session - 8-5-2021
April Heyward Research Methods Class Session - 8-5-2021April Heyward Research Methods Class Session - 8-5-2021
April Heyward Research Methods Class Session - 8-5-2021
 
RM7.ppt
RM7.pptRM7.ppt
RM7.ppt
 
Survey and correlational research (1)
Survey and correlational research (1)Survey and correlational research (1)
Survey and correlational research (1)
 
Analysing/Interpreting Quantitative Research
Analysing/Interpreting  Quantitative Research Analysing/Interpreting  Quantitative Research
Analysing/Interpreting Quantitative Research
 
Edited economic statistics note
Edited economic statistics noteEdited economic statistics note
Edited economic statistics note
 
CABT Math 8 measures of central tendency and dispersion
CABT Math 8   measures of central tendency and dispersionCABT Math 8   measures of central tendency and dispersion
CABT Math 8 measures of central tendency and dispersion
 
Level of Measurement, Frequency Distribution,Stem & Leaf
Level of Measurement, Frequency Distribution,Stem & Leaf   Level of Measurement, Frequency Distribution,Stem & Leaf
Level of Measurement, Frequency Distribution,Stem & Leaf
 
Media research
Media researchMedia research
Media research
 
Advanced Statistics.pptx
Advanced Statistics.pptxAdvanced Statistics.pptx
Advanced Statistics.pptx
 

More from Illi Elas

Research methodology illi
Research methodology illiResearch methodology illi
Research methodology illiIlli Elas
 
Research methodology illi second draft
Research methodology illi second draftResearch methodology illi second draft
Research methodology illi second draftIlli Elas
 
Questionnaires for research methodology
Questionnaires for research methodologyQuestionnaires for research methodology
Questionnaires for research methodologyIlli Elas
 
Presentation mini research methdology
Presentation mini research methdologyPresentation mini research methdology
Presentation mini research methdologyIlli Elas
 
Quantitative data
Quantitative dataQuantitative data
Quantitative dataIlli Elas
 
Qualitative data 2
Qualitative data 2Qualitative data 2
Qualitative data 2Illi Elas
 
Qualitative data
Qualitative dataQualitative data
Qualitative dataIlli Elas
 
Research methodology
Research methodologyResearch methodology
Research methodologyIlli Elas
 

More from Illi Elas (12)

Grammar 4
Grammar 4Grammar 4
Grammar 4
 
Research methodology illi
Research methodology illiResearch methodology illi
Research methodology illi
 
Research methodology illi second draft
Research methodology illi second draftResearch methodology illi second draft
Research methodology illi second draft
 
Grammar 3
Grammar 3Grammar 3
Grammar 3
 
Questionnaires for research methodology
Questionnaires for research methodologyQuestionnaires for research methodology
Questionnaires for research methodology
 
Presentation mini research methdology
Presentation mini research methdologyPresentation mini research methdology
Presentation mini research methdology
 
Grammar 2
Grammar 2Grammar 2
Grammar 2
 
Grammar 1
Grammar 1Grammar 1
Grammar 1
 
Quantitative data
Quantitative dataQuantitative data
Quantitative data
 
Qualitative data 2
Qualitative data 2Qualitative data 2
Qualitative data 2
 
Qualitative data
Qualitative dataQualitative data
Qualitative data
 
Research methodology
Research methodologyResearch methodology
Research methodology
 

Recently uploaded

Pharmacognosy Flower 3. Compositae 2023.pdf
Pharmacognosy Flower 3. Compositae 2023.pdfPharmacognosy Flower 3. Compositae 2023.pdf
Pharmacognosy Flower 3. Compositae 2023.pdfMahmoud M. Sallam
 
Presiding Officer Training module 2024 lok sabha elections
Presiding Officer Training module 2024 lok sabha electionsPresiding Officer Training module 2024 lok sabha elections
Presiding Officer Training module 2024 lok sabha electionsanshu789521
 
EPANDING THE CONTENT OF AN OUTLINE using notes.pptx
EPANDING THE CONTENT OF AN OUTLINE using notes.pptxEPANDING THE CONTENT OF AN OUTLINE using notes.pptx
EPANDING THE CONTENT OF AN OUTLINE using notes.pptxRaymartEstabillo3
 
Solving Puzzles Benefits Everyone (English).pptx
Solving Puzzles Benefits Everyone (English).pptxSolving Puzzles Benefits Everyone (English).pptx
Solving Puzzles Benefits Everyone (English).pptxOH TEIK BIN
 
Final demo Grade 9 for demo Plan dessert.pptx
Final demo Grade 9 for demo Plan dessert.pptxFinal demo Grade 9 for demo Plan dessert.pptx
Final demo Grade 9 for demo Plan dessert.pptxAvyJaneVismanos
 
Employee wellbeing at the workplace.pptx
Employee wellbeing at the workplace.pptxEmployee wellbeing at the workplace.pptx
Employee wellbeing at the workplace.pptxNirmalaLoungPoorunde1
 
Software Engineering Methodologies (overview)
Software Engineering Methodologies (overview)Software Engineering Methodologies (overview)
Software Engineering Methodologies (overview)eniolaolutunde
 
Kisan Call Centre - To harness potential of ICT in Agriculture by answer farm...
Kisan Call Centre - To harness potential of ICT in Agriculture by answer farm...Kisan Call Centre - To harness potential of ICT in Agriculture by answer farm...
Kisan Call Centre - To harness potential of ICT in Agriculture by answer farm...Krashi Coaching
 
Introduction to ArtificiaI Intelligence in Higher Education
Introduction to ArtificiaI Intelligence in Higher EducationIntroduction to ArtificiaI Intelligence in Higher Education
Introduction to ArtificiaI Intelligence in Higher Educationpboyjonauth
 
internship ppt on smartinternz platform as salesforce developer
internship ppt on smartinternz platform as salesforce developerinternship ppt on smartinternz platform as salesforce developer
internship ppt on smartinternz platform as salesforce developerunnathinaik
 
Mastering the Unannounced Regulatory Inspection
Mastering the Unannounced Regulatory InspectionMastering the Unannounced Regulatory Inspection
Mastering the Unannounced Regulatory InspectionSafetyChain Software
 
How to Configure Email Server in Odoo 17
How to Configure Email Server in Odoo 17How to Configure Email Server in Odoo 17
How to Configure Email Server in Odoo 17Celine George
 
ECONOMIC CONTEXT - LONG FORM TV DRAMA - PPT
ECONOMIC CONTEXT - LONG FORM TV DRAMA - PPTECONOMIC CONTEXT - LONG FORM TV DRAMA - PPT
ECONOMIC CONTEXT - LONG FORM TV DRAMA - PPTiammrhaywood
 
History Class XII Ch. 3 Kinship, Caste and Class (1).pptx
History Class XII Ch. 3 Kinship, Caste and Class (1).pptxHistory Class XII Ch. 3 Kinship, Caste and Class (1).pptx
History Class XII Ch. 3 Kinship, Caste and Class (1).pptxsocialsciencegdgrohi
 
Painted Grey Ware.pptx, PGW Culture of India
Painted Grey Ware.pptx, PGW Culture of IndiaPainted Grey Ware.pptx, PGW Culture of India
Painted Grey Ware.pptx, PGW Culture of IndiaVirag Sontakke
 
Science lesson Moon for 4th quarter lesson
Science lesson Moon for 4th quarter lessonScience lesson Moon for 4th quarter lesson
Science lesson Moon for 4th quarter lessonJericReyAuditor
 
Proudly South Africa powerpoint Thorisha.pptx
Proudly South Africa powerpoint Thorisha.pptxProudly South Africa powerpoint Thorisha.pptx
Proudly South Africa powerpoint Thorisha.pptxthorishapillay1
 
Crayon Activity Handout For the Crayon A
Crayon Activity Handout For the Crayon ACrayon Activity Handout For the Crayon A
Crayon Activity Handout For the Crayon AUnboundStockton
 
Computed Fields and api Depends in the Odoo 17
Computed Fields and api Depends in the Odoo 17Computed Fields and api Depends in the Odoo 17
Computed Fields and api Depends in the Odoo 17Celine George
 

Recently uploaded (20)

Pharmacognosy Flower 3. Compositae 2023.pdf
Pharmacognosy Flower 3. Compositae 2023.pdfPharmacognosy Flower 3. Compositae 2023.pdf
Pharmacognosy Flower 3. Compositae 2023.pdf
 
Presiding Officer Training module 2024 lok sabha elections
Presiding Officer Training module 2024 lok sabha electionsPresiding Officer Training module 2024 lok sabha elections
Presiding Officer Training module 2024 lok sabha elections
 
EPANDING THE CONTENT OF AN OUTLINE using notes.pptx
EPANDING THE CONTENT OF AN OUTLINE using notes.pptxEPANDING THE CONTENT OF AN OUTLINE using notes.pptx
EPANDING THE CONTENT OF AN OUTLINE using notes.pptx
 
Solving Puzzles Benefits Everyone (English).pptx
Solving Puzzles Benefits Everyone (English).pptxSolving Puzzles Benefits Everyone (English).pptx
Solving Puzzles Benefits Everyone (English).pptx
 
Final demo Grade 9 for demo Plan dessert.pptx
Final demo Grade 9 for demo Plan dessert.pptxFinal demo Grade 9 for demo Plan dessert.pptx
Final demo Grade 9 for demo Plan dessert.pptx
 
Employee wellbeing at the workplace.pptx
Employee wellbeing at the workplace.pptxEmployee wellbeing at the workplace.pptx
Employee wellbeing at the workplace.pptx
 
Software Engineering Methodologies (overview)
Software Engineering Methodologies (overview)Software Engineering Methodologies (overview)
Software Engineering Methodologies (overview)
 
Kisan Call Centre - To harness potential of ICT in Agriculture by answer farm...
Kisan Call Centre - To harness potential of ICT in Agriculture by answer farm...Kisan Call Centre - To harness potential of ICT in Agriculture by answer farm...
Kisan Call Centre - To harness potential of ICT in Agriculture by answer farm...
 
Introduction to ArtificiaI Intelligence in Higher Education
Introduction to ArtificiaI Intelligence in Higher EducationIntroduction to ArtificiaI Intelligence in Higher Education
Introduction to ArtificiaI Intelligence in Higher Education
 
internship ppt on smartinternz platform as salesforce developer
internship ppt on smartinternz platform as salesforce developerinternship ppt on smartinternz platform as salesforce developer
internship ppt on smartinternz platform as salesforce developer
 
Mastering the Unannounced Regulatory Inspection
Mastering the Unannounced Regulatory InspectionMastering the Unannounced Regulatory Inspection
Mastering the Unannounced Regulatory Inspection
 
How to Configure Email Server in Odoo 17
How to Configure Email Server in Odoo 17How to Configure Email Server in Odoo 17
How to Configure Email Server in Odoo 17
 
ECONOMIC CONTEXT - LONG FORM TV DRAMA - PPT
ECONOMIC CONTEXT - LONG FORM TV DRAMA - PPTECONOMIC CONTEXT - LONG FORM TV DRAMA - PPT
ECONOMIC CONTEXT - LONG FORM TV DRAMA - PPT
 
History Class XII Ch. 3 Kinship, Caste and Class (1).pptx
History Class XII Ch. 3 Kinship, Caste and Class (1).pptxHistory Class XII Ch. 3 Kinship, Caste and Class (1).pptx
History Class XII Ch. 3 Kinship, Caste and Class (1).pptx
 
Painted Grey Ware.pptx, PGW Culture of India
Painted Grey Ware.pptx, PGW Culture of IndiaPainted Grey Ware.pptx, PGW Culture of India
Painted Grey Ware.pptx, PGW Culture of India
 
Science lesson Moon for 4th quarter lesson
Science lesson Moon for 4th quarter lessonScience lesson Moon for 4th quarter lesson
Science lesson Moon for 4th quarter lesson
 
9953330565 Low Rate Call Girls In Rohini Delhi NCR
9953330565 Low Rate Call Girls In Rohini  Delhi NCR9953330565 Low Rate Call Girls In Rohini  Delhi NCR
9953330565 Low Rate Call Girls In Rohini Delhi NCR
 
Proudly South Africa powerpoint Thorisha.pptx
Proudly South Africa powerpoint Thorisha.pptxProudly South Africa powerpoint Thorisha.pptx
Proudly South Africa powerpoint Thorisha.pptx
 
Crayon Activity Handout For the Crayon A
Crayon Activity Handout For the Crayon ACrayon Activity Handout For the Crayon A
Crayon Activity Handout For the Crayon A
 
Computed Fields and api Depends in the Odoo 17
Computed Fields and api Depends in the Odoo 17Computed Fields and api Depends in the Odoo 17
Computed Fields and api Depends in the Odoo 17
 

Quantitative data 2

  • 2. Chapter Outline  Quantification of Data  Univariate Analysis  Subgroup Comparisons  Bivariate Analysis  Introduction to Multivariate Analysis  Sociological Diagnostics  Ethics and Quantitative Data Analysis  Quick Quiz
  • 3. Quantification of Data  Quantification Analysis – The numerical representation and manipulation of observations for the purpose of describing and explaining the phenomena that those observations reflect.
  • 4.  Age  1 = 1  2 = 2  3 = 3  4 = 4  5 = 5  Sex  Male = 1  Female = 2  Political Affiliation  Democrat = 1  Republican = 2  Independent = 3  Region of Country  West = 1  Midwest = 2  South = 3  Northeast = 4
  • 5.  Develop Code Categories 1. Use well-developed coding scheme. 2. Generate codes from your data.
  • 6.  Codebook Construction  Codebook – The document used in data processing and analysis that tells the location of different data items in a data file.
  • 7.  The codebook also identifies the locations of data items and the meaning of the codes used.  Purposes of the Codebook 1. Primary guide in the coking processes 2. Guide for locating variables
  • 9. ATTEND How often do you attend religious services? 0. Never 1. Less than once a year 2. About once or twice a year 3. Several times a year 4. About once a month 5. 2-3 times a month 6. Nearly every week 7. Every week 8. Several times a week 9. Don’t know, No answer Abbreviated Variable Name NumericalLabel Definition of the Variable Variable Attributes
  • 10.  Data Entry  Excel  SPSS
  • 11. Univariate Analysis  Univariate Analysis – The analysis of a single variable, for purposes of description (examples: frequency distribution, averages, and measures of dispersion).  Example: Gender  The number of men in a sample/population and the number of women in a sample/population.
  • 12.  Distributions  Frequency Distributions – A description of the number of times the various attributes of a variable are observed in a sample.
  • 15.  Central Tendency  Average – An ambiguous term generally suggesting typical or normal – a central tendency (examples: mean, median, mode).
  • 16.  Mean – an average computed by summing the values of several observations and dividing by the number of observations.  Mode- an average representing the most frequently observed value or attribute.  Median – an average representing the value of the “middle” case in a rank-ordered set of observations.
  • 17.  Practice: The following list represents the scores on a mid-term exam.  100, 94, 88, 91, 75, 61, 93, 82, 70, 88, 71, 88  Determine the mean.  Determine the mode.  Determine the median.
  • 19.  Dispersion – The distribution of values around some central value, such as an average.  Standard Deviation – A measure of dispersion around the mean, calculated so that approximately 68 percent of the cases will lie within plus or minus one standard deviation from the mean, 95 percent within two, and 99.9 percent within three standard deviations.
  • 21.  Continuous Variable – A variable whose attributes form a steady progression, such as age of income.  Discrete Variable – A variable whose attributes are separate from one another, such as gender or political affiliation.
  • 22.  Detail versus Manageability  Provide reader with fullest degree of detail, balanced with presenting data in a manageable form.
  • 23. Subgroup Comparisons  Description of subsets of cases, subjects or respondents.  “Collapsing” Response Categories  Handling “Don’t Knows”  Numerical Descriptions in Qualitative Research
  • 24. Bivariate Analysis  Bivariate Analysis – The analysis of two variables simultaneously, for the purpose of determine the empirical relationship between them.
  • 25.  Constructing a Bivariate Table 1. Determine logical direction of relationship (independent variable and dependent variable). 2. Percentage down versus percentage across.
  • 27.  Constructing and Reading Bivariate Tables  Example: Gender and Attitude toward Sexual Equality 1. The cases are divided into men and women. 2. Each gender subgrouping is described in terms of approval or disapproval of sexual equality. 3. Men and women are compared in terms of the percentages approving of sexual equality.
  • 28.  Contingency Table – A format for presenting the relationship among variables as percentage distributions.
  • 29.  Guidelines for Presentation of Tables 1. A table should have a heading or title that describes what is contained in the table. 2. Original content should be clearly presented. 3. The attributes of each variable should be clearly indicated. 4. The base on which percentage are computed should be indicated. 5. Missing data should be indicated in the table.
  • 30. Introduction to Multivariate Analysis  Multivariate Analysis – The analysis of the simultaneous relationships among several variables.
  • 32. 1. To conduct a quantitative analysis, researchers often must engage in a _____ after the data have been collected. A. coding process B. case-oriented analysis C. experimental analysis D. field research study
  • 33. Answer: A. To conduct a quantitative analysis, researchers often must engage in a coding process after the data have been collected.
  • 34. 2. Which of the following describe the analysis of more than two variables? A. experimental designs B. quasi-experimental designs C. qualitative evaluations D. multivariate analysis
  • 35. Answer: D. Multivariate analyses describe the analysis of more than two variables.
  • 36. 3. The process of converting data to numerical format is called _____. A. feminist research B. qualification C. quantification
  • 37. ANSWER: C. The process of converting data to numerical format is called quantification.
  • 38. 4. Which of the following are basic approaches to the coding process? A. You can begin with a well developed coding scheme. B. You can generate codes from your data. C. both of the above D. none of the above
  • 39. ANSWER: C. The following are basic approaches to the coding process: you can begin with a well developing coding scheme and/or you can generate codes from your data.
  • 40. 5. A _____ is a document that describes the locations of variables and lists the assignments of codes to the attributes composing those variables. A. cross-case analysis B. codebook C. constant comparative method D. monitoring study
  • 41. ANSWER: B. A codebook is a document that describes the locations of variables and lists the assignments of codes to the attributes composing those variables.
  • 42. 6. The _____ is an average computed by summing the values of several observations and divided by the number of observations. A. frequency B. mean C. median D. mode
  • 43. ANSWER: B. The mean is an average computed by summing the values of several observations and divided by the number of observations.
  • 44. 7. Which of the following are aimed at explanation? A. multivariate analysis B. bivariate analysis C. univariate analysis D. both A and B
  • 45. ANSWER: D. Multivariate analysis and bivariate analysis are aimed at explanation.
  • 46. 8. The multivariate techniques can serve as power tools for A. predicting behavior. B. diagnosing social problems. C. reacting to issues. D. all of the above
  • 47. ANSWER: B. The multivariate techniques can serve as powerful tools for diagnosing social problems.