Download to read offline

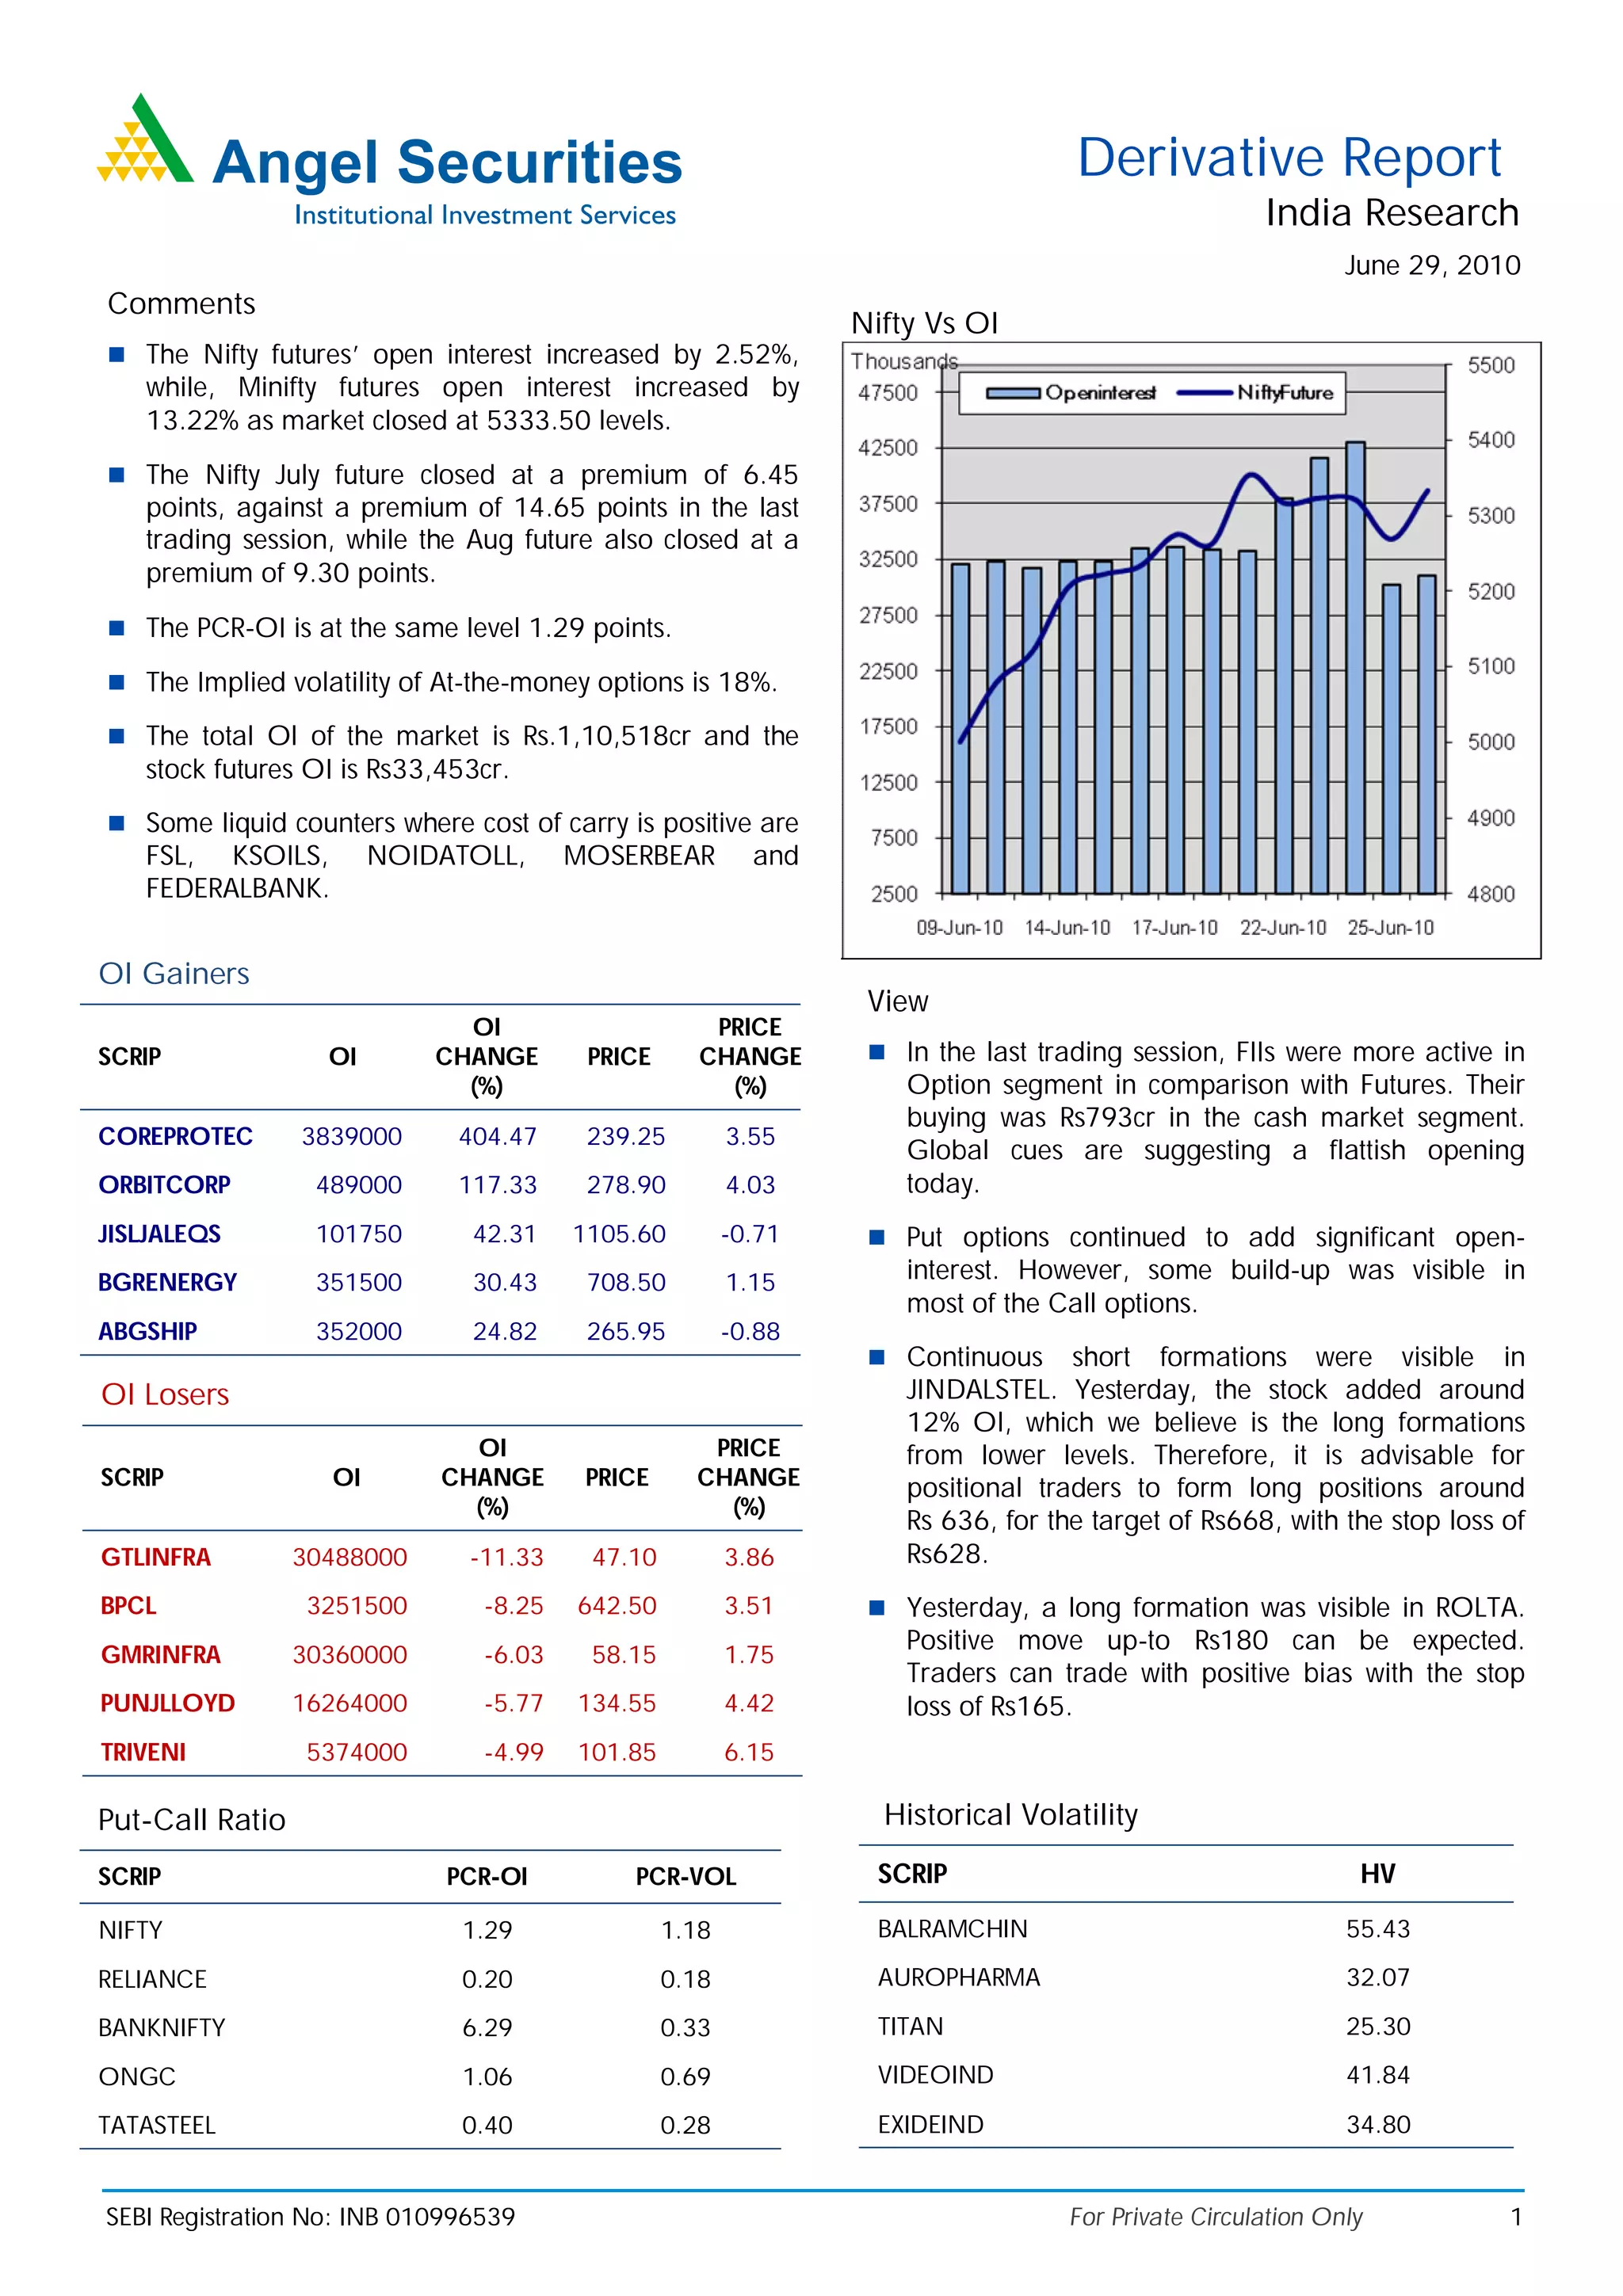

The document provides a summary of derivative market activity in India for June 29, 2010. Open interest in Nifty futures increased by 2.52% while open interest in Mini Nifty futures rose by 13.22%. Key points covered include changes in open interest and premium levels for various contracts, implied volatility, total open interest in the market, and top gainers and losers by change in open interest.


