Download to read offline
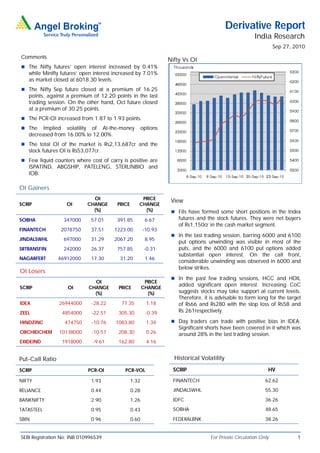
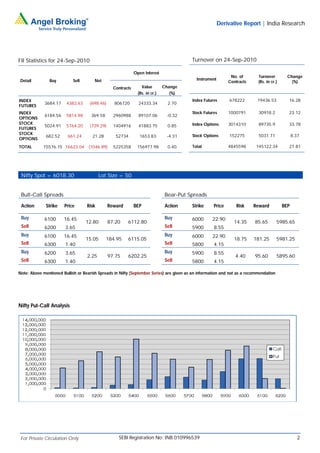

The document provides a summary of derivative market activity in India for September 27, 2010. It notes that open interest for Nifty futures increased slightly while open interest for Mini Nifty futures increased more significantly. The Nifty September future closed at a premium. Implied volatility for at-the-money options decreased. Specific stocks that saw increases in open interest included SOBHA, FINANTECH, and JINDALSWHL. Stocks with decreases in open interest included IDEA, ZEEL, and HINDZINC. The document also provides details on FII positions, turnover, volatility levels for various stocks, suggested trading strategies, and open derivative strategies.


