Download to read offline
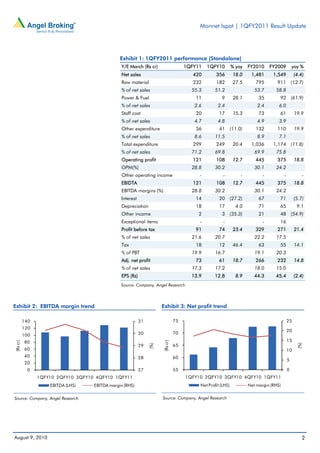
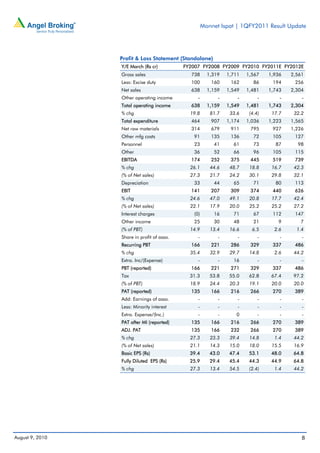

1) Monnet Ispat & Energy reported an 18% year-over-year increase in net sales to Rs420 crore for the first quarter of FY2011 due to higher realizations in steel sales. 2) EBITDA margins dipped slightly by 138 basis points to 28.8% despite sales growth, due to a 27.5% rise in raw material costs from higher iron ore prices. 3) Net profit grew by 18.7% year-over-year to Rs73 crore for the quarter, in line with top-line growth, as interest expenses declined.


