Download to read offline

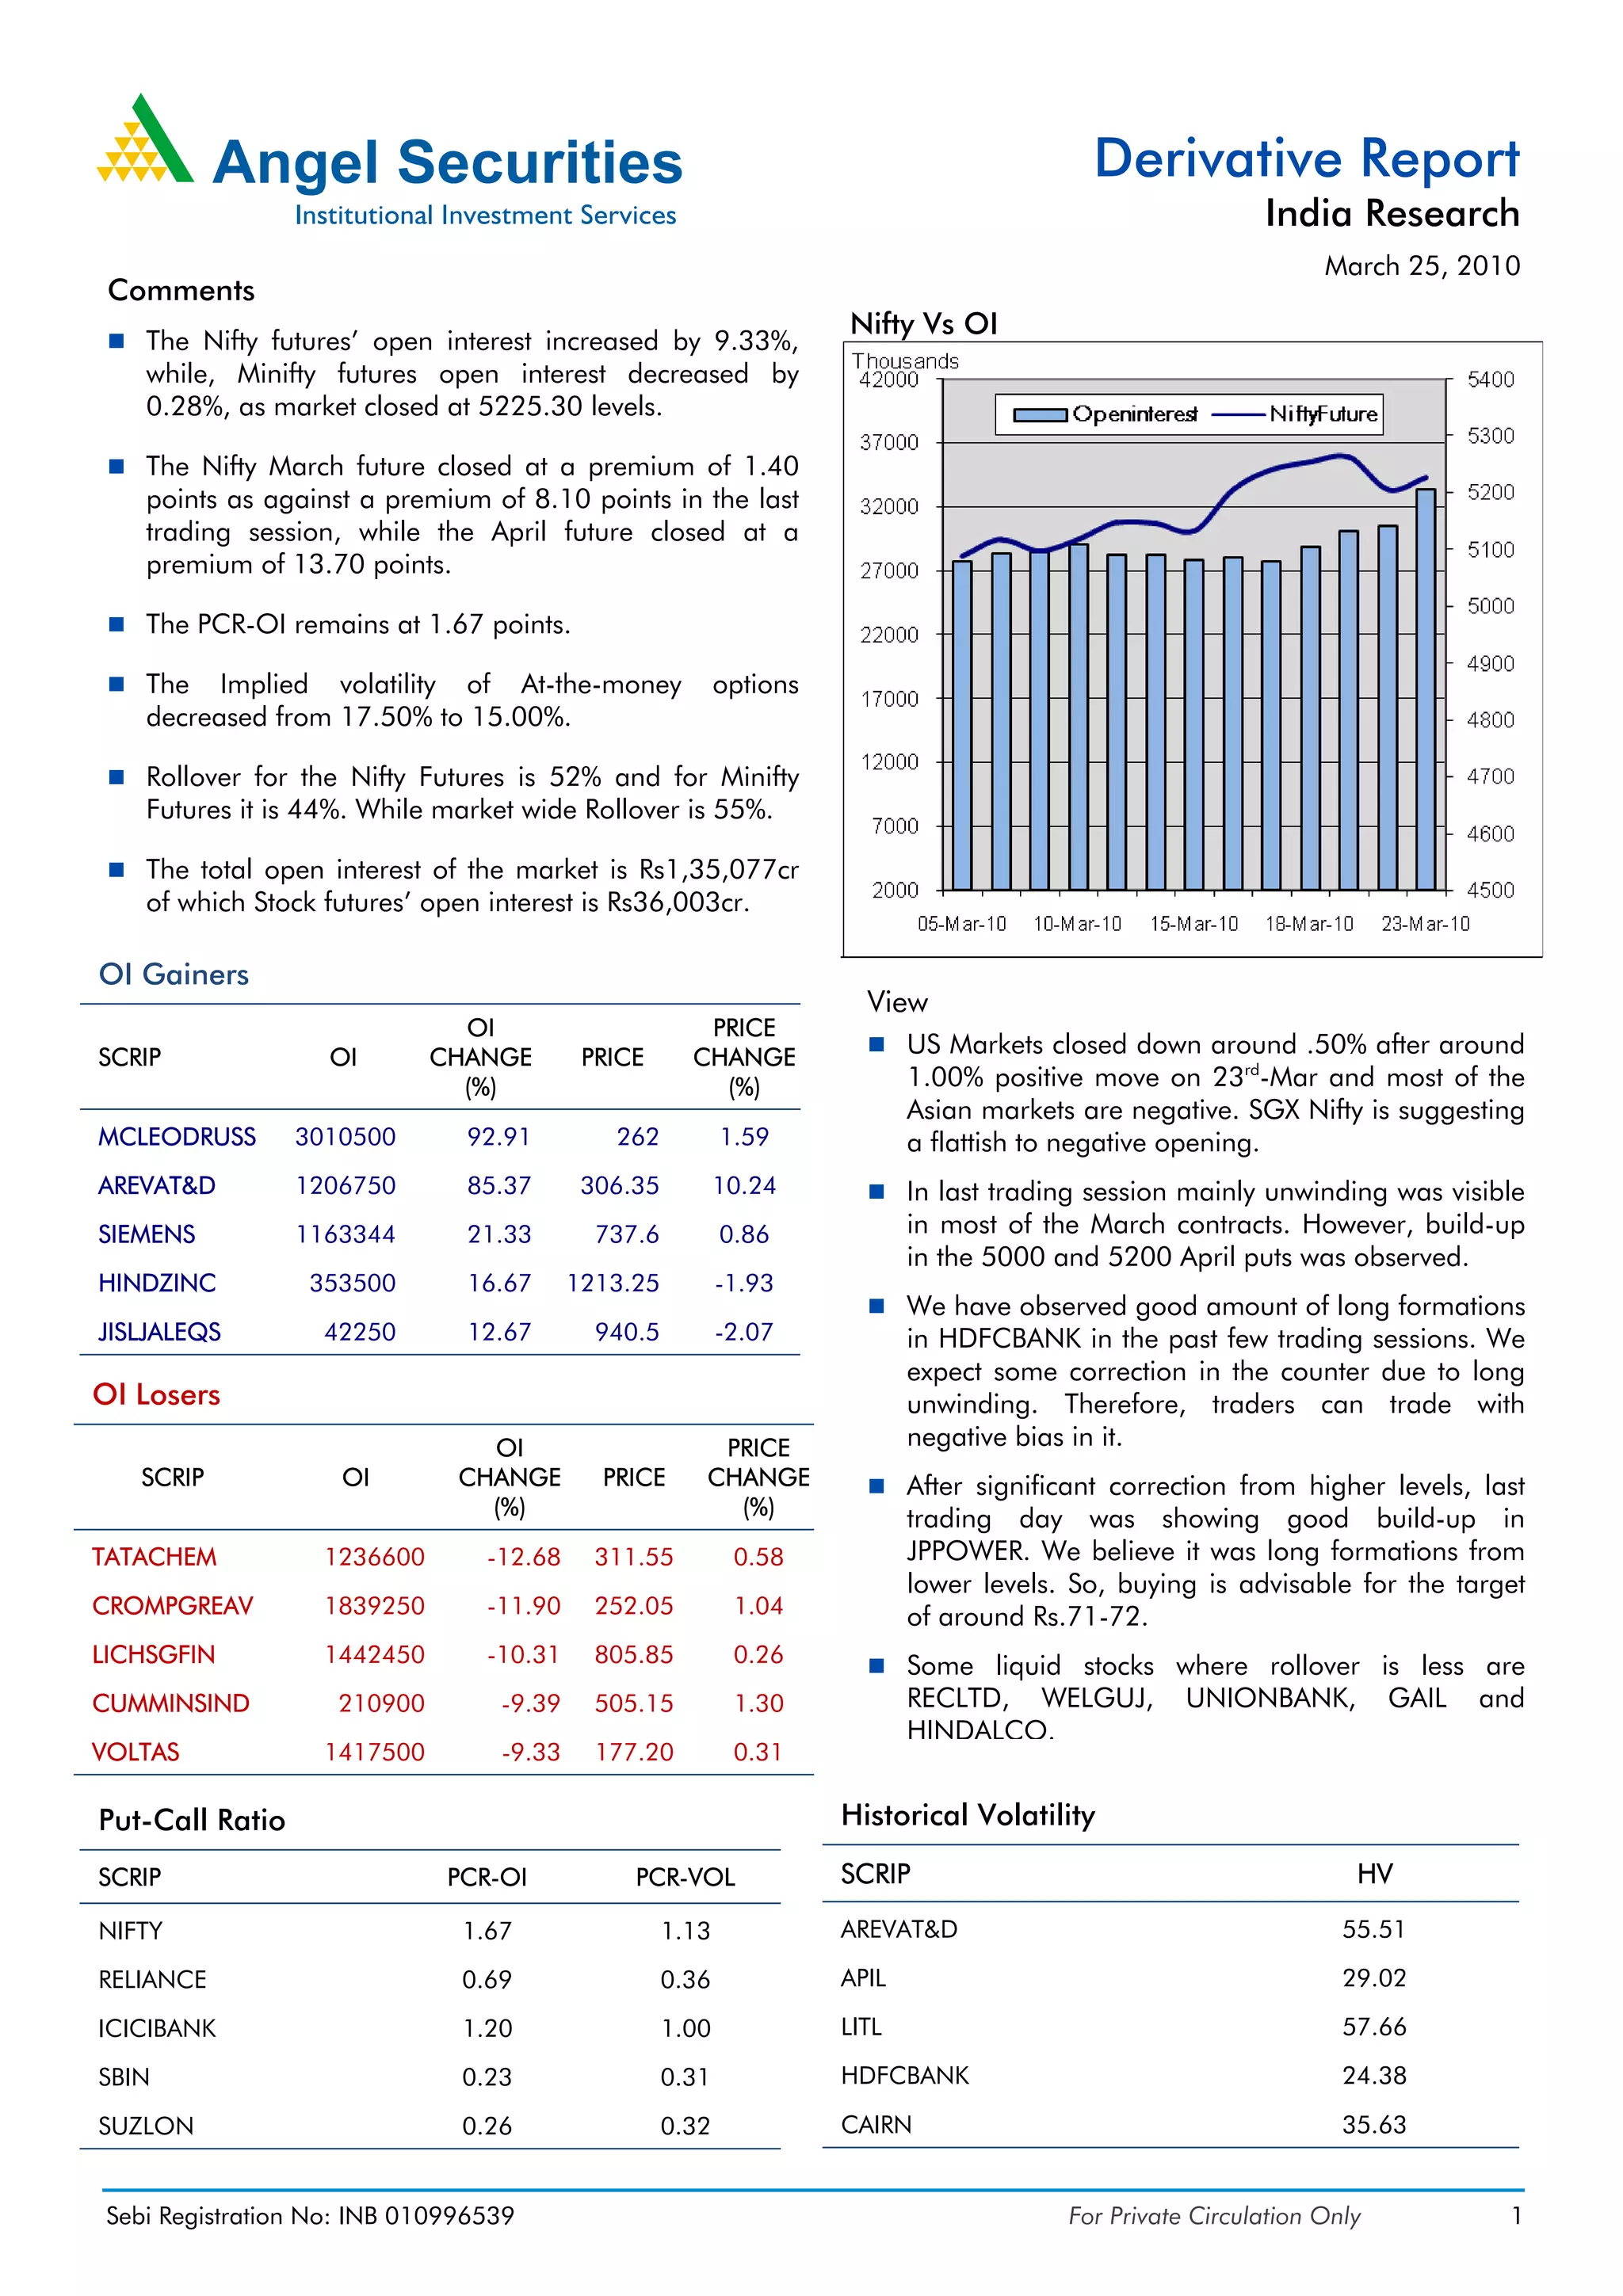

The document provides a summary of India's derivative market activity for March 25, 2010. It notes that open interest for Nifty futures increased by 9.33% while open interest for Minifity futures decreased by 0.28%. Rollover levels for Nifty futures was 52% and for Minifity futures was 44%. The total open interest in the market was Rs1,35,077cr, with stock futures open interest being Rs36,003cr. Top gainers in open interest included MCLEODRUSS, AREVAT&D, and SIEMENS, while top losers included TATACHEM, CROMPGREAV, and LICHSGFIN.