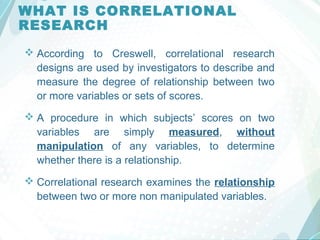
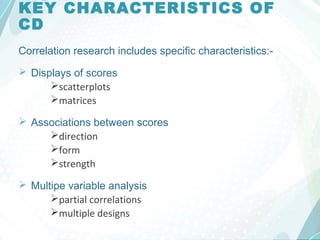
Correlational research designs examine relationships between two or more variables without manipulating any variables. They are used to describe and measure the degree of association between variables or sets of scores. There are two main types of correlational designs: explanatory/explanation designs which examine associations between variables, and prediction designs which identify predictor variables that can anticipate outcomes. Key aspects of correlational research include scatterplots, correlation coefficients, significance testing, and multiple variable techniques like partial correlation and multiple regression.
Data and data collection in qualitative researchRizky Amelia
This is about data and data collection methods in qualitative research, including interviews, observations, introspective, think-aloud, retrospective, questionnaires, documents, and production task. completely great :)
This presentation is about Quantitative Research, its types and important aspects including advantages and disadvantages, characteristics and definitions.
By the end of this presentation you should be able to:
Describe the justification of qualitative Sampling Techniques
Understand different types of Sampling Techniques
Data Processing and Statistical Treatment: Spreads and CorrelationJanet Penilla
A hyperlinked presentation. The objectives of the topic were written. The presentation was started with the variance and then the standard deviation provided with examples. It also answers on when to use the sample standard deviation and the population standard deviation or what type of data should we use when we calculate a standard deviation. The presentation also includes Correlations and other correlation techniques(Pearson-product moment correlation; Spearman - rank order correlation coefficient; t-test for correlation).
Review of "Survey Research Methods & Design in Psychology"James Neill
Reviews the 150 hour, third year psychology unit which examined survey research methods, with an emphasis on the second-half of the unit on MLR, ANOVA, power, and effect size.
CHAPTER 2 - NORM, CORRELATION AND REGRESSION.pptkriti137049
Norms are the accepted standards on particular test.
Norms consist of data that make it possible to determine the relative standing of an individual who has taken a test.
Research is a systematic and scientific method of finding solutions by obtaining various types of data and systematic analysis of the multiple aspects of the issues related.
The techniques or the specific procedure which helps to identify, choose, process, and analyze information about a subject is called Research Methodology
Experimental design is a statistical tool for improving product design and solving production problems.
How to Make a Field invisible in Odoo 17Celine George
It is possible to hide or invisible some fields in odoo. Commonly using “invisible” attribute in the field definition to invisible the fields. This slide will show how to make a field invisible in odoo 17.
Unit 8 - Information and Communication Technology (Paper I).pdfThiyagu K
This slides describes the basic concepts of ICT, basics of Email, Emerging Technology and Digital Initiatives in Education. This presentations aligns with the UGC Paper I syllabus.
Biological screening of herbal drugs: Introduction and Need for
Phyto-Pharmacological Screening, New Strategies for evaluating
Natural Products, In vitro evaluation techniques for Antioxidants, Antimicrobial and Anticancer drugs. In vivo evaluation techniques
for Anti-inflammatory, Antiulcer, Anticancer, Wound healing, Antidiabetic, Hepatoprotective, Cardio protective, Diuretics and
Antifertility, Toxicity studies as per OECD guidelines
Francesca Gottschalk - How can education support child empowerment.pptxEduSkills OECD
Francesca Gottschalk from the OECD’s Centre for Educational Research and Innovation presents at the Ask an Expert Webinar: How can education support child empowerment?
Introduction to AI for Nonprofits with Tapp NetworkTechSoup
Dive into the world of AI! Experts Jon Hill and Tareq Monaur will guide you through AI's role in enhancing nonprofit websites and basic marketing strategies, making it easy to understand and apply.
The Roman Empire A Historical Colossus.pdfkaushalkr1407
The Roman Empire, a vast and enduring power, stands as one of history's most remarkable civilizations, leaving an indelible imprint on the world. It emerged from the Roman Republic, transitioning into an imperial powerhouse under the leadership of Augustus Caesar in 27 BCE. This transformation marked the beginning of an era defined by unprecedented territorial expansion, architectural marvels, and profound cultural influence.
The empire's roots lie in the city of Rome, founded, according to legend, by Romulus in 753 BCE. Over centuries, Rome evolved from a small settlement to a formidable republic, characterized by a complex political system with elected officials and checks on power. However, internal strife, class conflicts, and military ambitions paved the way for the end of the Republic. Julius Caesar’s dictatorship and subsequent assassination in 44 BCE created a power vacuum, leading to a civil war. Octavian, later Augustus, emerged victorious, heralding the Roman Empire’s birth.
Under Augustus, the empire experienced the Pax Romana, a 200-year period of relative peace and stability. Augustus reformed the military, established efficient administrative systems, and initiated grand construction projects. The empire's borders expanded, encompassing territories from Britain to Egypt and from Spain to the Euphrates. Roman legions, renowned for their discipline and engineering prowess, secured and maintained these vast territories, building roads, fortifications, and cities that facilitated control and integration.
The Roman Empire’s society was hierarchical, with a rigid class system. At the top were the patricians, wealthy elites who held significant political power. Below them were the plebeians, free citizens with limited political influence, and the vast numbers of slaves who formed the backbone of the economy. The family unit was central, governed by the paterfamilias, the male head who held absolute authority.
Culturally, the Romans were eclectic, absorbing and adapting elements from the civilizations they encountered, particularly the Greeks. Roman art, literature, and philosophy reflected this synthesis, creating a rich cultural tapestry. Latin, the Roman language, became the lingua franca of the Western world, influencing numerous modern languages.
Roman architecture and engineering achievements were monumental. They perfected the arch, vault, and dome, constructing enduring structures like the Colosseum, Pantheon, and aqueducts. These engineering marvels not only showcased Roman ingenuity but also served practical purposes, from public entertainment to water supply.
2024.06.01 Introducing a competency framework for languag learning materials ...Sandy Millin
http://sandymillin.wordpress.com/iateflwebinar2024
Published classroom materials form the basis of syllabuses, drive teacher professional development, and have a potentially huge influence on learners, teachers and education systems. All teachers also create their own materials, whether a few sentences on a blackboard, a highly-structured fully-realised online course, or anything in between. Despite this, the knowledge and skills needed to create effective language learning materials are rarely part of teacher training, and are mostly learnt by trial and error.
Knowledge and skills frameworks, generally called competency frameworks, for ELT teachers, trainers and managers have existed for a few years now. However, until I created one for my MA dissertation, there wasn’t one drawing together what we need to know and do to be able to effectively produce language learning materials.
This webinar will introduce you to my framework, highlighting the key competencies I identified from my research. It will also show how anybody involved in language teaching (any language, not just English!), teacher training, managing schools or developing language learning materials can benefit from using the framework.
The French Revolution, which began in 1789, was a period of radical social and political upheaval in France. It marked the decline of absolute monarchies, the rise of secular and democratic republics, and the eventual rise of Napoleon Bonaparte. This revolutionary period is crucial in understanding the transition from feudalism to modernity in Europe.
For more information, visit-www.vavaclasses.com
1. CORRELATIONAL
DESIGNS [CD]
RESEARCH METHODOLOGY GB6013 - UKM [TESL
GROUP]
GROUP MEMBERS
DHACHAINI A/P PRABHAKARAN (GP03743)
JASIDAH IDANG (GP03760)
KUMARESEN A/L MAHALINGAM (GP03771)
LU HUI PING (GP04061)
VIMALA A/P P. MOOKIAH (GP03810)
2. POINTS OF DISCUSSION
1. WHAT IS CD?
2. WHEN TO USE CD?
3. HOW DID CD DEVELOP?
4. TYPES OF CD
5. KEY CHARACTERISTICS OF CD
6. HOW TO CONDUCT CORRELATIONAL STUDY?
7. HOW TO EVALUATE CORRELATIONAL STUDY?
* Reference: Cresswell, J.A. (2008) Educational Research: Planning,
Conducting, and Evaluating Quantitative and Qualitative Research.
Third Edition. Pearson Prentice Hall. USA.
3. WHAT IS CORRELATIONAL
RESEARCH
According to Creswell, correlational research
designs are used by investigators to describe and
measure the degree of relationship between two
or more variables or sets of scores.
A procedure in which subjects’ scores on two
variables are simply measured, without
manipulation of any variables, to determine
whether there is a relationship.
Correlational research examines the relationship
between two or more non manipulated variables.
4. WHAT IS CORRELATIONAL
RESEARCH
What is the relationship
between smoking and
the healthcare cost?
What is the link between ethnicity and certain
healthcare condition?
5. WHEN DO WE USE CD?
when we want to see if there is a relationship
between variables or to predict an outcome.
important NOTE:
Correlation can be positive or negative.
There is no perfect 1:1 relationship between
items
Correlations cannot tell us the cause of any
relationship.
6. WHEN DO WE USE CD?
simple example:
We, as teachers, practice correlation
research often in the forms of pre-tests,
quizzes, etc., where we correlate
(based on years of experience) the
outcome of these assessments with
anticipated final test results. We will
often modify our teaching in response
to the data to modify the outcome.
7. HOW DID CD DEVELOP?
Late 19th century
Karl Pearson (1895)
correlation formula
Yule (1897)
theory of regression & the ability to predict scores using info based on
correlating correlation coefficients.
Spearman (1904)
Spearman's rho
Fisher (1935)
significant testing & ANOVA
Campbell & Stanley (1963)
new impetus (encouraged researchers to both recognize and specify the
extensive threats to validity in this form of research)
Advent of computers
8. HOW DID CD DEVELOP?
Statisticians first developed the procedures for
calculating the correlation statistics in the late 19th
century
(Cowles, 1989).
Karl Pearson presented the familiar correlation formula
we know today in a paper before the Royal Society in
England in November 1895 (Cowles, 1989).
In 1897, Yule (Pearson’s student) developed solutions
for correlating two, three, and four variables.
With Pearson, Yule also advanced the theory of
regression and the ability to predict scores using
information based on correlating correlation
coefficients.
9. HOW DID CD DEVELOP?
During the 1970s and 1980s, quantitative researchers
started the correlation studies.
Hence, with computers, they could statistically
remove the effects of a large number variables to
examine the relationship among a small set of
variables.
For example, they could explore the combination of
variables (eg. Gender, age, and SAT scores) and an
outcome (e.g., college grade point average)
10. TYPES OF CD
The two primary correlation designs:-
1. THE EXPLANATORY/explanation DESIGN
2. THE PREDICTION DESIGN
11. TYPES OF CD
Explanation Prediction
explain the association between or
among variables
Identify variables that will predict an
outcome or criterion.
correlate two or more variables In this form of research, the
investigators identifies one or more
predictor variable and a criterion.
collect data at one point in time measure the predictor variable(s) at
one point in time and the criterion
variable at a later point in time
The researcher obtains at least two
scores for each individual in the
group.
The authors forecast performance
12. THE EXPLANATION DESIGN
Other names of this designs:
• 'relational' research (Cohen & Manion, 1994, p.123)
• 'accounting-for-variance studies' (Punch, 1998, p.78)
• 'explanatory' research (Fraenkel & Wallen, 2000, p.
360)
Is a correlational design in which we are interested in the
extent to which two/more variables co-vary.
Consists of a simple association between two or more
variables.
13. THE EXPLANATION DESIGN
Characteristics
• we correlate two/more variables
• we collect data at one point in time
• we analyze all participants as a single group
• we obtain at least 2 scores for each individual in the
group (one for each variable)
• we report the use of the correlation statistical test in
the data analysis
• we make interpretations/draw conclusions from the
statistical test results.
14. THE PREDICTION DESIGN
Seek to anticipate outcomes by using certain variables
as predictors.
Purpose = to identify predictor variables that will predict
an outcome or criterion.
Will report correlations using the correlation statistical
test; may include advanced statistical procedures.
Characteristics:
• typically include the word 'prediction' in the title (might
also be in the purpose statement/research questions).
• typically measure the predictor variable(s) at one point
in time and the criterion variable at a later point in
time.
• forecast future performance.
15. KEY CHARACTERISTICS OF
CD
Correlation research includes specific characteristics:-
Displays of scores
scatterplots
matrices
Associations between scores
direction
form
strength
Multipe variable analysis
partial correlations
multiple designs
16.
17. Scatterplot are
vitally important to
correlational
research as they
allow researchers
to determine:
The degree of
the
association
The form of
the
association
The type of
association
The existence
of extreme
scores
The direction
of the
association
21. Degree of association
-is the association between two variables or set
-scores is a correlation coefficient of -1.00 to +1.00
-with 0.00 indicating no linear association at all
-reflects consistent and predictable association between the scores
-square the correlation and use the r value to measure the strength
Coefficient of determination
-assesses the proportion of variability in one variable that can be determined or
explained by a second variable
22. Standards for interpreting the strength of the
association.
.20 - .35 - there is only a slight relationship
.35 –.65 - useful for limited prediction.
- used to identify variable membership in the statistical procedure of
factor analysis
- many correlation coefficients for bivariate relationships fall into this
area.
.66 –.85 - good prediction can result from one variable to the other.
- considered very good.
.86 and above - typically achieved for studies of construct validity or test– retest
reliability.
- when two or more variables are related, correlations this high are
seldom achieved.
23. - Significant testing - determine whether the value is
meaningful
- The null hypothesis would be no relationship or
association among the scores in the population.
Testing these hypothesis involves:
- setting a level of significance
- calculating the test statistic
- examining whether the correlation coefficient value falls
into the region of
rejection rejecting or failing to reject the null hypothesis.
r squared
- expresses the magnitude of two variables or sets of scores.
- represents the effect size
24. Multiple Variable Analysis
-Partial Correlations
-Multiple Regression
Partial Correlation
-Determine the amount of variance that an intervening
variable explains in both the independent and dependent
variables.
-Used because of various number of variables as
predictors of the outcome.
-These variables are called as the mediating or
intervening variable.
-The variables ‘stands between’ the independent and
dependent variables and influences both of them.
25.
26. Multiple regression.
- Regression analysis used to see the impact of multiple
variables on an outcome.
- Involves a regression line and the analysis using
regression.
Regression line
- Is a line ‘best fit’ for all of the points of scores on the
graph.
- The line comes the closest to all the points on the plot.
- Calculated by drawing a line that minimizes the squared
distance of the points
from the line.
27.
28.
29. Multiple Regression / Multiple Correlation
- multiple independent variables combines to correlate
with a dependent variable
30. Regression Table
-calculate regression coefficients for each variable,
assess the combined influence of all variables and provide
a picture of the results
-shows the overall amount of variance explained in a
dependent variable by all independent variables, called R²
or R squared
-shows the regression weight (beta)
31.
32. Beta Weight
-beta weight indicates the magnitude of prediction for
a variable after removing the effects of all other
predictors.
-identifies the strength of the relationship of a
predictor variable of the outcomes.
-reported in a standardised form, a z score with a
value from +1.00 to -1.00.
33. Meta analysis
•Authors integrate the findings of many research studies in meta
analysis.
•Meta-analysis conducting process follows systematic steps.
1.locate the studies on a single topic and notes the results for all
the studies.
2.Calculates an overall result for all of the studies and reports this
information.
•By conducting this process, the investigator synthesizes the
literature, providing a secondary source of primary research report.
34. HOW TO CONDUCT CD?
1.
Identify two
variables that
maybe related
rather indicates
an association
between two or more variables
Sample r.q. :
- Is creativity related to IQ test
scores for elementary children?
(associating two variables)
- What factors explain a student
teacher’s ethical behaviour
during student-teaching
experience? (exploring a
complex relationship)
- Does high school class rank
predict a college student’s grade
point average in the first
semester of the college? (prediction)
avoid the
“shotgun
approach”
35. HOW TO CONDUCT CD?
2.
Identify
sample to
study
at least 30
individuals;
select randomly
heterogeneous sample
produces wide ranges of scores
compared to homogenous
sample; helps to determine the
true relationship between
variables.
narrowed group of
population may
influence the
strength of the
correlation
relationships
36. HOW TO CONDUCT CD?
3.
Select a method of
measurement
complex part of a correlational
study is determining how to
effectively measure each
variable.
validity and reliability
from literature search of past
studies to obtain instruments
obtaining permissions from
publishers or authors to use
the instruments
37. HOW TO CONDUCT CD?
4.
Collect Data
and Monitor
Potential
Threats
the two sets of data should be
collected for each of the
participants
multiple independent
variables are collected to
understand complex
relationshipsprediction studies require data
collection at more than one
point in time. In such cases,
researchers often assign
numbers to participants to
ensure that data remains
confidential
38. Student
Iowa Assessment National
Standard Score
Average Time Spent on
Homework Nightly
Matthew 142 0
Jane 167 10
Daniel 130 10
Jose 180 10
Armando 150 30
Kelby 194 15
Loren 162 20
Samantha 202 15
Andrew 216 50
Britney 216 45
Kiedis 219 40
Ethan 223 60
Dakota 230 65
Mia 244 90
Damarcus 270 80
Alejandro 252 75
39. HOW TO CONDUCT CD?
5.
Analyze the Data
and Represent
the Results
look for a pattern of
responses and uses
statistical procedures to
determine the strength of
the relationship
If a statistically significant
relationship is found, it is not
the cause and effect but merely
an association between the
variables relationships
needs to determine the
appropriate statistic to use. --an
initial question is whether the
data are linearly or curvilinearly
Data from
correlational
research is
analyzed by using
statistical tests that
depend greatly on
the type of
variables being
studied
41. HOW TO CONDUCT CD?
6.
Interpret the
Results
findings of correlational
research is often presented in a
correlational matrix
Asterisks are often used to
indicate correlations that
are statistically significant.
Overall concern is whether the
data support the theory, the
hypotheses, or
questionsremains confidential
42. HOW DO YOU EVALUATE A
CORRELATIONAL STUDY?
Below are the criteria we use to evaluate and assess the quality of a
correlational study:-
Is the size of the sample adequate for hypothesis testing?
Does the researcher adequately display the results in matrices or graphs?
Is there an interpretation about the direction and magnitude of the association
between two variables?
Is there an assessment of the magnitude of the relationship based on the coefficient
of determination, p values, effect size, or the size of the coefficient?
Is the researcher concerned about the form of the relationship so that an appropriate
statistic is chosen for analysis?
Has the researcher identified the predictor and the criterion variables?
If a visual model of the relationships is advanced, does the researcher indicate the
expected direction of the relationships among variables? Or the predicted direction
based on observed data?
Are the statistical procedures clearly identified?