Downloaded 122 times

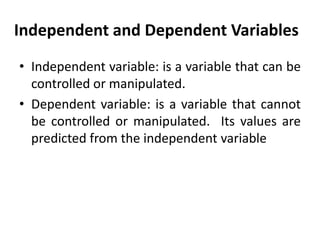
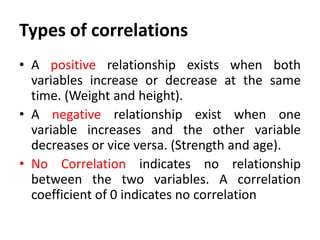
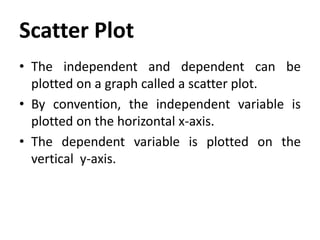
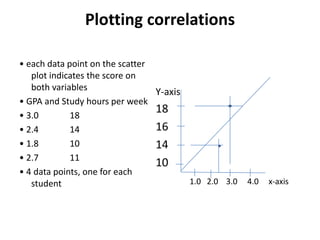
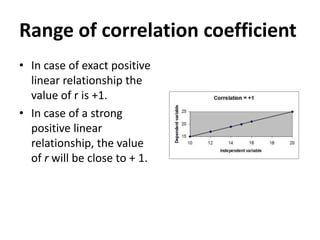
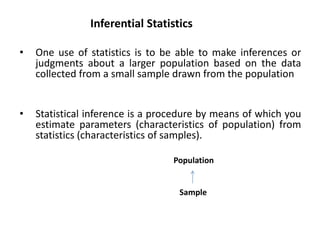

This document provides an overview of correlational research and inferential statistics. It defines correlation as measuring the relationship between two variables, and explains that correlational research allows determining if variables are related but not if there is a causal relationship. Key aspects covered include independent and dependent variables, the Pearson correlation coefficient for measuring strength and direction of relationships, and types of correlations. Scatter plots and examples are used to illustrate concepts. Hypothesis testing and different sampling methods are also summarized.


![BASIC CONCEPTS in STAT 1 [Autosaved].pptx](https://cdn.slidesharecdn.com/ss_thumbnails/basicconceptsinstat1autosaved-221027115944-55c11ebb-thumbnail.jpg?width=640&height=640&fit=bounds)


![Getting Started with Apache Spark: Big Data Made Simple [Free Meetup]](https://cdn.slidesharecdn.com/ss_thumbnails/apachesparkgettingstarted-260203175547-8361bcc3-thumbnail.jpg?width=640&height=640&fit=bounds)

