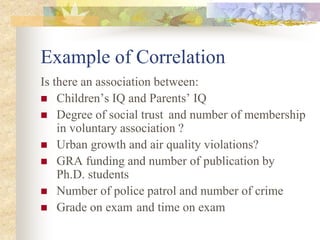
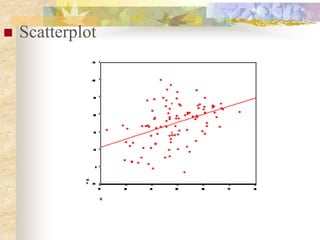
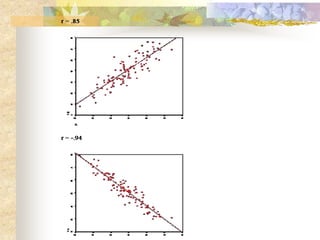
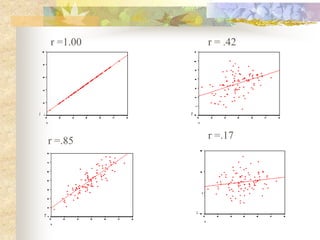
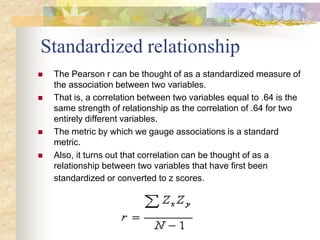
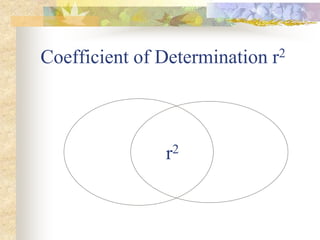
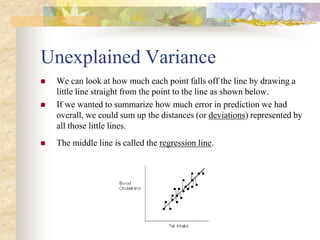
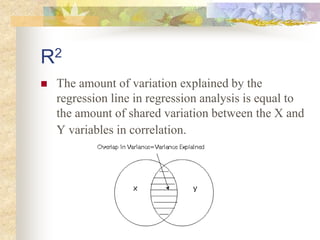
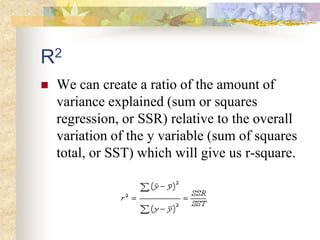
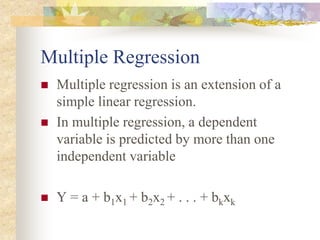
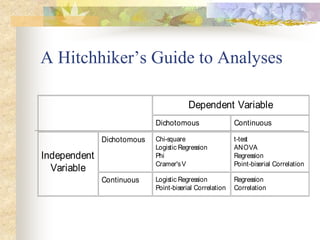
This document discusses correlation and regression analysis. It defines correlation as a statistical measure of how two variables are related. A correlation coefficient between -1 and 1 indicates the strength and direction of the linear relationship between variables. A scatterplot can show this graphically. Regression analysis involves using one variable to predict scores on another variable. Simple linear regression uses one independent variable to predict a dependent variable, while multiple regression uses two or more independent variables. The goal is to identify the regression line that best fits the data with the least error. The coefficient of determination, R2, indicates how much variance in the dependent variable is explained by the independent variables.
Explaining correlation, assumptions,coefficients of correlation, coefficient of determination, variate, partial correlation, assumption, order and hypothesis of partial correlation with example, checking significance and graphical representation of partial correlation.
Correlation and regression.
It shows different aspects of Correlation and regression.
A small comparison of these two is also listed in this presentation.
HOW IS IT USEFUL IN FIELD OF FORENSIC SCIENCE AND IN THIS I HAVE SHOWN THE TYPES OF CORRELATION, SIGNIFICANCE , METHODS AND KARL PEARSON'S METHOD OF CORRELATION
Overviews non-parametric and parametric approaches to (bivariate) linear correlation. See also: http://en.wikiversity.org/wiki/Survey_research_and_design_in_psychology/Lectures/Correlation
It is most useful for the students of BBA for the subject of "Data Analysis and Modeling"/
It has covered the content of chapter- Data regression Model
Visit for more on www.ramkumarshah.com.np/
Memorandum Of Association Constitution of Company.pptseri bangash
www.seribangash.com
A Memorandum of Association (MOA) is a legal document that outlines the fundamental principles and objectives upon which a company operates. It serves as the company's charter or constitution and defines the scope of its activities. Here's a detailed note on the MOA:
Contents of Memorandum of Association:
Name Clause: This clause states the name of the company, which should end with words like "Limited" or "Ltd." for a public limited company and "Private Limited" or "Pvt. Ltd." for a private limited company.
https://seribangash.com/article-of-association-is-legal-doc-of-company/
Registered Office Clause: It specifies the location where the company's registered office is situated. This office is where all official communications and notices are sent.
Objective Clause: This clause delineates the main objectives for which the company is formed. It's important to define these objectives clearly, as the company cannot undertake activities beyond those mentioned in this clause.
www.seribangash.com
Liability Clause: It outlines the extent of liability of the company's members. In the case of companies limited by shares, the liability of members is limited to the amount unpaid on their shares. For companies limited by guarantee, members' liability is limited to the amount they undertake to contribute if the company is wound up.
https://seribangash.com/promotors-is-person-conceived-formation-company/
Capital Clause: This clause specifies the authorized capital of the company, i.e., the maximum amount of share capital the company is authorized to issue. It also mentions the division of this capital into shares and their respective nominal value.
Association Clause: It simply states that the subscribers wish to form a company and agree to become members of it, in accordance with the terms of the MOA.
Importance of Memorandum of Association:
Legal Requirement: The MOA is a legal requirement for the formation of a company. It must be filed with the Registrar of Companies during the incorporation process.
Constitutional Document: It serves as the company's constitutional document, defining its scope, powers, and limitations.
Protection of Members: It protects the interests of the company's members by clearly defining the objectives and limiting their liability.
External Communication: It provides clarity to external parties, such as investors, creditors, and regulatory authorities, regarding the company's objectives and powers.
https://seribangash.com/difference-public-and-private-company-law/
Binding Authority: The company and its members are bound by the provisions of the MOA. Any action taken beyond its scope may be considered ultra vires (beyond the powers) of the company and therefore void.
Amendment of MOA:
While the MOA lays down the company's fundamental principles, it is not entirely immutable. It can be amended, but only under specific circumstances and in compliance with legal procedures. Amendments typically require shareholder
"𝑩𝑬𝑮𝑼𝑵 𝑾𝑰𝑻𝑯 𝑻𝑱 𝑰𝑺 𝑯𝑨𝑳𝑭 𝑫𝑶𝑵𝑬"
𝐓𝐉 𝐂𝐨𝐦𝐬 (𝐓𝐉 𝐂𝐨𝐦𝐦𝐮𝐧𝐢𝐜𝐚𝐭𝐢𝐨𝐧𝐬) is a professional event agency that includes experts in the event-organizing market in Vietnam, Korea, and ASEAN countries. We provide unlimited types of events from Music concerts, Fan meetings, and Culture festivals to Corporate events, Internal company events, Golf tournaments, MICE events, and Exhibitions.
𝐓𝐉 𝐂𝐨𝐦𝐬 provides unlimited package services including such as Event organizing, Event planning, Event production, Manpower, PR marketing, Design 2D/3D, VIP protocols, Interpreter agency, etc.
Sports events - Golf competitions/billiards competitions/company sports events: dynamic and challenging
⭐ 𝐅𝐞𝐚𝐭𝐮𝐫𝐞𝐝 𝐩𝐫𝐨𝐣𝐞𝐜𝐭𝐬:
➢ 2024 BAEKHYUN [Lonsdaleite] IN HO CHI MINH
➢ SUPER JUNIOR-L.S.S. THE SHOW : Th3ee Guys in HO CHI MINH
➢FreenBecky 1st Fan Meeting in Vietnam
➢CHILDREN ART EXHIBITION 2024: BEYOND BARRIERS
➢ WOW K-Music Festival 2023
➢ Winner [CROSS] Tour in HCM
➢ Super Show 9 in HCM with Super Junior
➢ HCMC - Gyeongsangbuk-do Culture and Tourism Festival
➢ Korean Vietnam Partnership - Fair with LG
➢ Korean President visits Samsung Electronics R&D Center
➢ Vietnam Food Expo with Lotte Wellfood
"𝐄𝐯𝐞𝐫𝐲 𝐞𝐯𝐞𝐧𝐭 𝐢𝐬 𝐚 𝐬𝐭𝐨𝐫𝐲, 𝐚 𝐬𝐩𝐞𝐜𝐢𝐚𝐥 𝐣𝐨𝐮𝐫𝐧𝐞𝐲. 𝐖𝐞 𝐚𝐥𝐰𝐚𝐲𝐬 𝐛𝐞𝐥𝐢𝐞𝐯𝐞 𝐭𝐡𝐚𝐭 𝐬𝐡𝐨𝐫𝐭𝐥𝐲 𝐲𝐨𝐮 𝐰𝐢𝐥𝐥 𝐛𝐞 𝐚 𝐩𝐚𝐫𝐭 𝐨𝐟 𝐨𝐮𝐫 𝐬𝐭𝐨𝐫𝐢𝐞𝐬."
Enterprise Excellence is Inclusive Excellence.pdfKaiNexus
Enterprise excellence and inclusive excellence are closely linked, and real-world challenges have shown that both are essential to the success of any organization. To achieve enterprise excellence, organizations must focus on improving their operations and processes while creating an inclusive environment that engages everyone. In this interactive session, the facilitator will highlight commonly established business practices and how they limit our ability to engage everyone every day. More importantly, though, participants will likely gain increased awareness of what we can do differently to maximize enterprise excellence through deliberate inclusion.
What is Enterprise Excellence?
Enterprise Excellence is a holistic approach that's aimed at achieving world-class performance across all aspects of the organization.
What might I learn?
A way to engage all in creating Inclusive Excellence. Lessons from the US military and their parallels to the story of Harry Potter. How belt systems and CI teams can destroy inclusive practices. How leadership language invites people to the party. There are three things leaders can do to engage everyone every day: maximizing psychological safety to create environments where folks learn, contribute, and challenge the status quo.
Who might benefit? Anyone and everyone leading folks from the shop floor to top floor.
Dr. William Harvey is a seasoned Operations Leader with extensive experience in chemical processing, manufacturing, and operations management. At Michelman, he currently oversees multiple sites, leading teams in strategic planning and coaching/practicing continuous improvement. William is set to start his eighth year of teaching at the University of Cincinnati where he teaches marketing, finance, and management. William holds various certifications in change management, quality, leadership, operational excellence, team building, and DiSC, among others.
Premium MEAN Stack Development Solutions for Modern BusinessesSynapseIndia
Stay ahead of the curve with our premium MEAN Stack Development Solutions. Our expert developers utilize MongoDB, Express.js, AngularJS, and Node.js to create modern and responsive web applications. Trust us for cutting-edge solutions that drive your business growth and success.
Know more: https://www.synapseindia.com/technology/mean-stack-development-company.html
Putting the SPARK into Virtual Training.pptxCynthia Clay
This 60-minute webinar, sponsored by Adobe, was delivered for the Training Mag Network. It explored the five elements of SPARK: Storytelling, Purpose, Action, Relationships, and Kudos. Knowing how to tell a well-structured story is key to building long-term memory. Stating a clear purpose that doesn't take away from the discovery learning process is critical. Ensuring that people move from theory to practical application is imperative. Creating strong social learning is the key to commitment and engagement. Validating and affirming participants' comments is the way to create a positive learning environment.
RMD24 | Retail media: hoe zet je dit in als je geen AH of Unilever bent? Heid...BBPMedia1
Grote partijen zijn al een tijdje onderweg met retail media. Ondertussen worden in dit domein ook de kansen zichtbaar voor andere spelers in de markt. Maar met die kansen ontstaan ook vragen: Zelf retail media worden of erop adverteren? In welke fase van de funnel past het en hoe integreer je het in een mediaplan? Wat is nu precies het verschil met marketplaces en Programmatic ads? In dit half uur beslechten we de dilemma's en krijg je antwoorden op wanneer het voor jou tijd is om de volgende stap te zetten.
Improving profitability for small businessBen Wann
In this comprehensive presentation, we will explore strategies and practical tips for enhancing profitability in small businesses. Tailored to meet the unique challenges faced by small enterprises, this session covers various aspects that directly impact the bottom line. Attendees will learn how to optimize operational efficiency, manage expenses, and increase revenue through innovative marketing and customer engagement techniques.
Buy Verified PayPal Account | Buy Google 5 Star Reviewsusawebmarket
Buy Verified PayPal Account
Looking to buy verified PayPal accounts? Discover 7 expert tips for safely purchasing a verified PayPal account in 2024. Ensure security and reliability for your transactions.
PayPal Services Features-
🟢 Email Access
🟢 Bank Added
🟢 Card Verified
🟢 Full SSN Provided
🟢 Phone Number Access
🟢 Driving License Copy
🟢 Fasted Delivery
Client Satisfaction is Our First priority. Our services is very appropriate to buy. We assume that the first-rate way to purchase our offerings is to order on the website. If you have any worry in our cooperation usually You can order us on Skype or Telegram.
24/7 Hours Reply/Please Contact
usawebmarketEmail: support@usawebmarket.com
Skype: usawebmarket
Telegram: @usawebmarket
WhatsApp: +1(218) 203-5951
USA WEB MARKET is the Best Verified PayPal, Payoneer, Cash App, Skrill, Neteller, Stripe Account and SEO, SMM Service provider.100%Satisfection granted.100% replacement Granted.
Personal Brand Statement:
As an Army veteran dedicated to lifelong learning, I bring a disciplined, strategic mindset to my pursuits. I am constantly expanding my knowledge to innovate and lead effectively. My journey is driven by a commitment to excellence, and to make a meaningful impact in the world.
Cracking the Workplace Discipline Code Main.pptxWorkforce Group
Cultivating and maintaining discipline within teams is a critical differentiator for successful organisations.
Forward-thinking leaders and business managers understand the impact that discipline has on organisational success. A disciplined workforce operates with clarity, focus, and a shared understanding of expectations, ultimately driving better results, optimising productivity, and facilitating seamless collaboration.
Although discipline is not a one-size-fits-all approach, it can help create a work environment that encourages personal growth and accountability rather than solely relying on punitive measures.
In this deck, you will learn the significance of workplace discipline for organisational success. You’ll also learn
• Four (4) workplace discipline methods you should consider
• The best and most practical approach to implementing workplace discipline.
• Three (3) key tips to maintain a disciplined workplace.
India Orthopedic Devices Market: Unlocking Growth Secrets, Trends and Develop...Kumar Satyam
According to TechSci Research report, “India Orthopedic Devices Market -Industry Size, Share, Trends, Competition Forecast & Opportunities, 2030”, the India Orthopedic Devices Market stood at USD 1,280.54 Million in 2024 and is anticipated to grow with a CAGR of 7.84% in the forecast period, 2026-2030F. The India Orthopedic Devices Market is being driven by several factors. The most prominent ones include an increase in the elderly population, who are more prone to orthopedic conditions such as osteoporosis and arthritis. Moreover, the rise in sports injuries and road accidents are also contributing to the demand for orthopedic devices. Advances in technology and the introduction of innovative implants and prosthetics have further propelled the market growth. Additionally, government initiatives aimed at improving healthcare infrastructure and the increasing prevalence of lifestyle diseases have led to an upward trend in orthopedic surgeries, thereby fueling the market demand for these devices.
Accpac to QuickBooks Conversion Navigating the Transition with Online Account...PaulBryant58
This article provides a comprehensive guide on how to
effectively manage the convert Accpac to QuickBooks , with a particular focus on utilizing online accounting services to streamline the process.
2. Example of Correlation
Is there an association between:
Children’s IQ and Parents’ IQ
Degree of social trust and number of membership
in voluntary association ?
Urban growth and air quality violations?
GRA funding and number of publication by
Ph.D. students
Number of police patrol and number of crime
Grade on exam and time on exam
3. Correlation
Correlation coefficient: statistical index of
the degree to which two variables are
associated, or related.
We can determine whether one variable is
related to another by seeing whether scores
on the two variables covary---whether they
vary together.
4. Scatterplot
The relationship between any two variables
can be portrayed graphically on an x- and
y- axis.
Each subject i1 has (x1, y1). When score s
for an entire sample are plotted, the result
is called scatter plot.
6. Direction of the relationship
Variables can be positively or negatively
correlated.
Positive correlation: A value of one variable
increase, value of other variable increase.
Negative correlation: A value of one variable
increase, value of other variable decrease.
7.
8. Strength of the relationship
The magnitude of correlation:
Indicated by its numerical value
ignoring the sign
expresses the strength of the linear
relationship between the variables.
10. Pearson’s correlation coefficient
There are many kinds of correlation coefficients
but the most commonly used measure of
correlation is the Pearson’s correlation
coefficient. (r)
The Pearson r range between -1 to +1.
Sign indicate the direction.
The numerical value indicates the strength.
Perfect correlation : -1 or 1
No correlation: 0
A correlation of zero indicates the value are not linearly related.
However, it is possible they are related in curvilinear fashion.
11. Standardized relationship
The Pearson r can be thought of as a standardized measure of
the association between two variables.
That is, a correlation between two variables equal to .64 is the
same strength of relationship as the correlation of .64 for two
entirely different variables.
The metric by which we gauge associations is a standard
metric.
Also, it turns out that correlation can be thought of as a
relationship between two variables that have first been
standardized or converted to z scores.
12. Correlation Represents
a Linear Relationship
Correlation involves a linear relationship.
"Linear" refers to the fact that, when we graph our
two variables, and there is a correlation, we get a
line of points.
Correlation tells you how much two variables are
linearly related, not necessarily how much they are
related in general.
There are some cases that two variables may have
a strong, or even perfect, relationship, yet the
relationship is not at all linear. In these cases, the
correlation coefficient might be zero.
13.
14. Coefficient of Determination r2
The percentage of shared variance is represented
by the square of the correlation coefficient, r2 .
Variance indicates the amount of variability in a
set of data.
If the two variables are correlated, that means that
we can account for some of the variance in one
variable by the other variable.
16. Statistical significance of r
A correlation coefficient calculated on a sample is
statistically significant if it has a very probability
of being zero in the population.
In other words, to test r for significance, we test
the null hypothesis that, in the population the
correlation is zero by computing a t statistic.
Ho: r = 0
HA: r = 0
17. Some consideration in
interpreting correlation
1. Correlation represents a linear relations.
Correlation tells you how much two variables are
linearly related, not necessarily how much they
are related in general.
There are some cases that two variables may
have a strong perfect relationship but not linear.
For example, there can be a curvilinear
relationship.
18. Some consideration in
interpreting correlation
2. Restricted range (Slide: Truncated)
Correlation can be deceiving if the full
information about each of the variable is not
available. A correlation between two variable is
smaller if the range of one or both variables is
truncated.
Because the full variation of one variables is not
available, there is not enough information to see
the two variables covary together.
19. Some consideration in
interpreting correlation
3. Outliers
Outliers are scores that are so obviously deviant
from the remainder of the data.
On-line outliers ---- artificially inflate the
correlation coefficient.
Off-line outliers --- artificially deflate the
correlation coefficient
20. On-line outlier
An outlier which falls near where the regression
line would normally fall would necessarily
increase the size of the correlation coefficient, as
seen below.
r = .457
21. Off-line outliers
An outlier that falls some distance away from the
original regression line would decrease the size of
the correlation coefficient, as seen below:
r = .336
22. Correlation and Causation
Two things that go together may not necessarily
mean that there is a causation.
One variable can be strongly related to another,
yet not cause it. Correlation does not imply
causality.
When there is a correlation between X and Y.
Does X cause Y or Y cause X, or both?
Or is there a third variable Z causing both X and
Y , and therefore, X and Y are correlated?
23. Simple Linear Regression
One objective of simple linear regression is
to predict a person’s score on a dependent
variable from knowledge of their score on
an independent variable.
It is also used to examine the degree of
linear relationship between an independent
variable and a dependent variable.
24. Example of Linear Regression
Predict “productivity” of factory workers
based on the “Test of Assembly Speed”
score.
Predict “GPA” of college students based on
the “SAT” score.
Examine the linear relationship between
“Blood cholesterol” and “fat intake”.
25. Prediction
A perfect correlation between two variables produces a
line when plotted in a bivariate scatterplot
In this figure, every increase of the value of X is
associated with an increase in Y without any exceptions.
If we wanted to predict values of Y based on a certain
value of X, we would have no problem in doing so with
this figure. A value of 2 for X should be associated with a
value of 10 on the Y variable, as indicated by this graph.
26. Error of Prediction:
“Unexplained Variance”
Usually, prediction won't be so perfect. Most
often, not all the points will fall perfectly on the
line. There will be some error in the prediction.
For each value of X, we know the approximate
value of Y but not the exact value.
27. Unexplained Variance
We can look at how much each point falls off the line by drawing a
little line straight from the point to the line as shown below.
If we wanted to summarize how much error in prediction we had
overall, we could sum up the distances (or deviations) represented by
all those little lines.
The middle line is called the regression line.
28. The Regression Equation
The regression equation is simply a
mathematical equation for a line. It is the
equation that describes the regression line.
In algebra, we represent the equation for a
line with something like this:
y = a + bx
29. Sum of Squares Residual
Summing up the deviations of the points gives us an
overall idea of how much error in prediction there is.
Unfortunately, this method does not work very well.
If we choose a line that goes exactly through the middle
of the points, about half of the points that fall off of the
line should be below the line and about half should be
above. Some of the deviations will be negative and some
will be positive, and, thus the sum of all of them will
equal 0.
30. Sum of Squares Residual
The (imaginary) scores that fall exactly on the
regression line are called the predicted scores,
and there is a predicted score for each value of
X. The predicted scores are represented by y^
(sometimes referred to as "y-hat", because of the
little hat; or as "y-predict").
So the sum of the squared deviations from the
predicted scores is represented by
31. Sum of Square Residual
• y scores is subtracted from the predicted score (or the line)
and then squared. Then all the squared deviations are
summed a measure of the residual variation
•sum of the squared deviations from the regression line (or
the predicted points) is a summary of the error up.
•Notice that this is a type of variation. It is the unexplained
variation in the prediction of y when x is used to predict the
y scores. Some books refer to this as the "sum of squares
residual" because it is of prediction
32. Regression Line
If we want to draw a line that is perfectly through the
middle of the points, we would choose a line that had the
squared deviations from the line. Actually, we would use
the smallest squared deviations. This criterion for best line
is called the "Least Squares" criterion or Ordinary Least
Squares (OLS).
We use the least squares criterion to pick the regression
line. The regression line is sometimes called the "line of
best fit" because it is the line that fits best when drawn
through the points. It is a line that minimizes the distance
of the actual scores from the predicted scores.
33. No relationship vs.
Strong relationship
•The regression line is flat when there is no ability to predict
whatsoever.
•The regression line is sloped at an angle when there is a
relationship.
34. Sum of Squares Regression: The
Explained Variance
The extent to which the regression line is sloped represents the
amount we can predict y scores based on x scores, and the extent to
which the regression line is beneficial in predicting y scores over and
above the mean of the y scores.
To represent this, we could look at how much the predicted points
(which fall on the regression line) deviate from the mean.
This deviation is represented by the little vertical lines I've drawn in
the figure below.
35. Formula for Sum of Squares
Regression: Explained Variance
The squared deviations of the predicted
scores from the mean score, or
represent the amount of variance explained
in the y scores by the x scores.
36. Total Variation
The total variation in the y score is
measured simply by the sum of the
squared deviations of the y scores from
the mean.
37. Total Variation
The explained sum of squares and
unexplained sum of squares add up to equal
the total sum of squares. The variation of the
scores is either explained by x or not.
Total sum of squares = explained sum of
squares + unexplained sum of squares.
38. R2
The amount of variation explained by the
regression line in regression analysis is equal to
the amount of shared variation between the X and
Y variables in correlation.
39. R2
We can create a ratio of the amount of
variance explained (sum or squares
regression, or SSR) relative to the overall
variation of the y variable (sum of squares
total, or SST) which will give us r-square.
41. Multiple Regression
Multiple regression is an extension of a
simple linear regression.
In multiple regression, a dependent
variable is predicted by more than one
independent variable
Y = a + b1x1 + b2x2 + . . . + bkxk