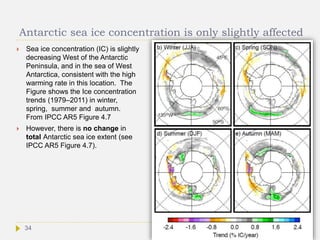
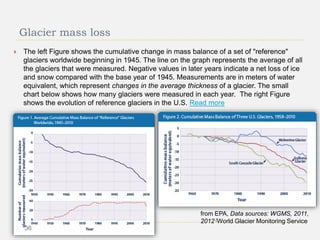
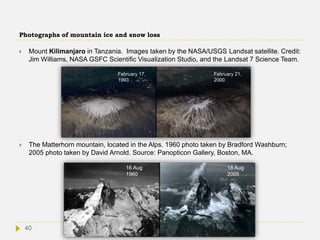
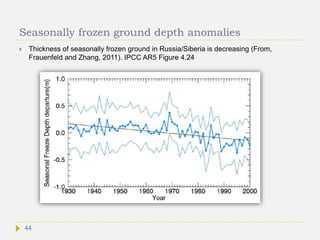
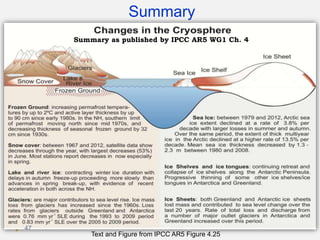
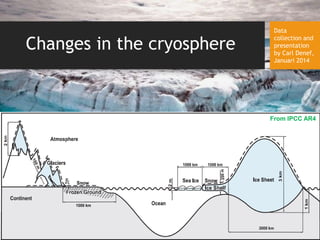
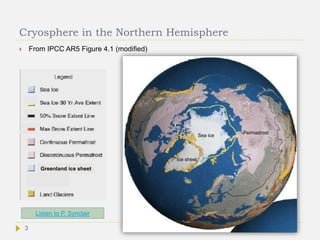
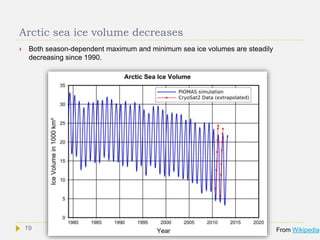
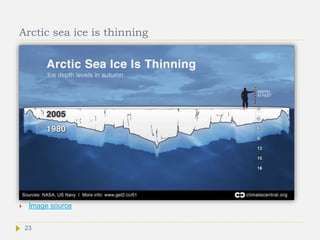
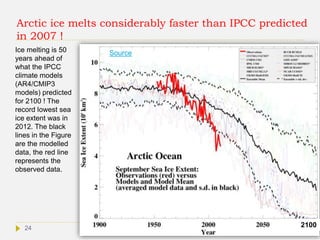
The document discusses changes occurring in the cryosphere (frozen parts of the Earth's surface) including polar ice sheets, glaciers, sea ice and permafrost. It provides details on factors contributing to melting and decline of ice sheets in Greenland and Antarctica, such as rising air and ocean temperatures, increased surface meltwater, glacier acceleration and ice shelf instability. Graphs and maps show decreasing trends in Arctic sea ice extent, thickness and concentration over recent decades, as well as rising ice loss from both the Greenland and Antarctic ice sheets.
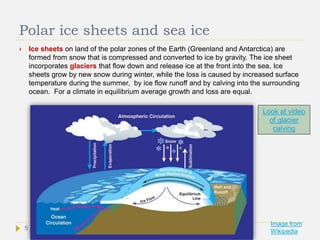
![ Ice can melt and sublimate. Melt water on the ice sheet can run off directly into the
ocean at the edges of the ice sheet and via ‘Moulins’ into the ice interior. A moulin or
glacier mill is a roughly circular, vertical to nearly vertical well-like shaft within a glacier
through which water enters from the surface. Moulins can reach the bottom of the
glacier, hundreds of metres deep. Melting water can accumulate in ice lakes or exit
the glacier at the base level and runoff into the sea. Flowing water makes ice to melt
faster.
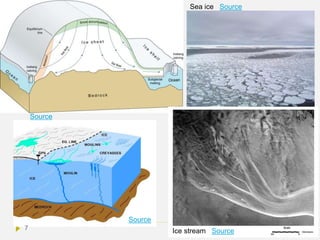
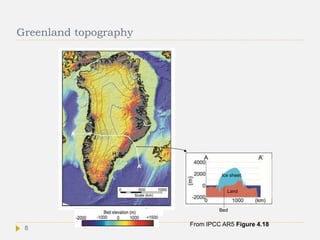
The ice sheet itself flows down by gravity to the coastline and onto the ocean surface
where it makes ice shelves. These are thick platforms of ice of about 100 to 1000 m
thick floating on the sea. Shelves may break off (calving), releasing large pieces of
ice into the sea (icebergs). Vast ice shelves sometimes abruptly collapse, releasing
massive amounts of ice into the sea.
A significant proportion of the ice volume is fast-moving ice or ice streams that move
significantly faster than the rest of the ice sheet. For example, the Whillans Ice
Stream moves about 0.5 m within approximately 30 minutes,[2] remains still for 12
hours, and then moves another 0.5 m and so on.
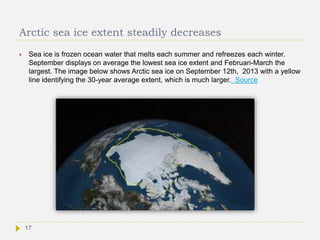
Sea ice is frozen seawater. It may be attached to land or drift off-shore and move with
currents and winds. Because ice is less dense than liquid water, sea ice floats on the
ocean's surface. Sea ice covers about 7% of the Earth’s surface, or about 12% of the
world’s oceans.[1][2] It may incorporate icebergs.
6](https://image.slidesharecdn.com/climatechangecryosphere-140804075104-phpapp02/85/Climate-change-changes-in-the-cryosphere-6-320.jpg)
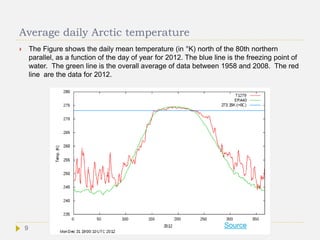
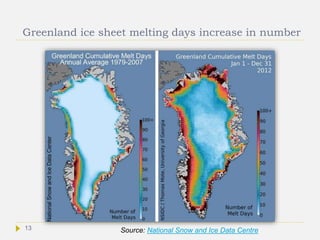
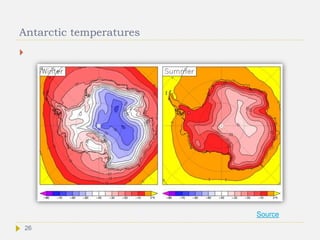
![Arctic temperature by region and season
Average January temperatures range from about −40 to 0 °C, and can drop below −50 °C.
Average July temperatures range from about −10 to +10 °C, with some land areas occasionally
exceeding 30 °C. The freezing point of sea water is about −2 °C.[1] So, there is considerable sea
ice melting during the summer. In the right panel, the dark blue zone is Greenland.
Average January temperature Average July temperature Source10](https://image.slidesharecdn.com/climatechangecryosphere-140804075104-phpapp02/85/Climate-change-changes-in-the-cryosphere-10-320.jpg)
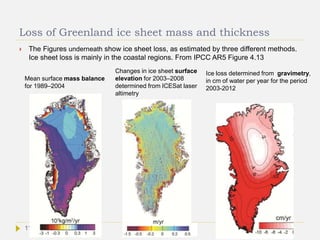
![ this glacier. The glacier seemed to be in balance from 1955-1985,[13] with a speed of
around 20 m/day.[11] After 1997 it began to accelerate rapidly, reaching an average
velocity of 34 m/day in the terminus region. It also thinned at a rate of up to 15 m/year
and retreated 5 km in six years.
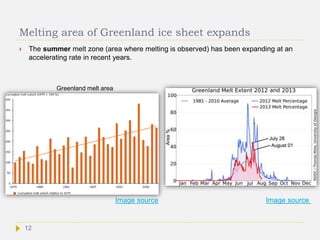
In July 2012, the melt zone extended to 97 percent of the ice cover.[12] Ice core-based
reconstruction studies showed that events such as this occur approximately every 150
years on average. The last time a melt this large happened was in 1889. This
particular melt may be part of cyclical behavior, but it cannot be excluded that similar
events will get more frequent[13]
Look the video of the collapse of
Ilulissat Glacier in Western Greenland
Look at a video of water
runoff in Greenland
15](https://image.slidesharecdn.com/climatechangecryosphere-140804075104-phpapp02/85/Climate-change-changes-in-the-cryosphere-15-320.jpg)
![ According to Dr. C Zender black carbon
(BC) is a significant contributor to Arctic
ice-melt.[72] BC decreases the snow/ice
albedo, leading to an increased warming
trend. The radiative forcing induced by BC is
presently of the order of 1 W/m2 at middle-
and high-latitudes in the Northern
Hemisphere and over the Arctic Ocean.[73] BC
deposition on ice and snow increases surface
melt of ice, and the meltwater in turn
accelerates ice disintegration.[75] There are
long-range pollution pathways to the Arctic
during winter and spring,[Ref] causing haze
containing BC, which increases surface
temperature by 0.5 °C.[77]
Albedo has been shown to have decreased
in Greenland (see Figure on the right),
consistent with the relative higher impact of
global warming on Greenland. Decreased
albedo leads to more sunlight absorbed by
the snow, leading to further melting.
Difference from average reflectivity in percent
16](https://image.slidesharecdn.com/climatechangecryosphere-140804075104-phpapp02/85/Climate-change-changes-in-the-cryosphere-16-320.jpg)
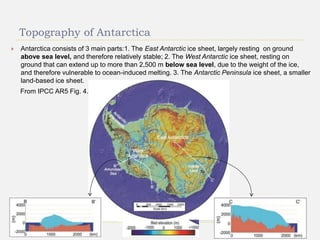
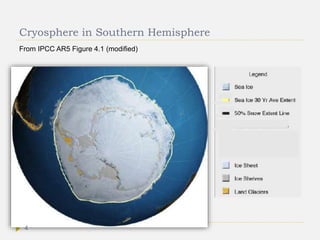
![Antarctic ice sheet, shelves and glaciers
The Antarctic ice sheet has been in existence for at
least 40 million years. It covers about 98% of the
Antarctic continent, an area of almost 14 million km2,
and contains 26.5 million km3 of ice (26 million
gigatons).[2] That is ~61 % of all fresh water on the
Earth. Antarctic ice is over 4,200 m thick in some
areas. If all Antarctic ice would melt, sea level would
rise with 60-70 m.
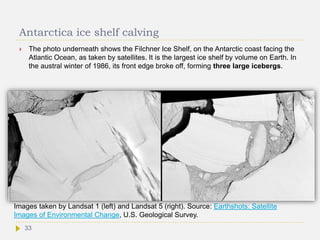
A total of 44 percent of the Antarctic coastline are ice
shelves. Their aggregate area is 1,541,700 km² [1]
and are about 100 to 1000 m thick. Antarctic ice
shelves may calve icebergs that are over 80
kilometers long. Calving accounts for about half the
mass lost from ice sheets.
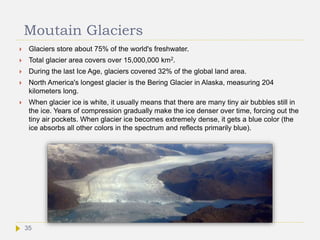
Presently, 10% of land area is covered with glaciers
that flow and may calve ice. About 10% of the ice
volume is fast-moving ice or ice streams that move
significantly faster than the surrounding ice. Entire ice
shelves or glaciers may suddenly collapse, over
hours to days or weeks, releasing massive amounts of
ice into the sea, where it drifts away and melts. That
happened recently to the Larsen A and B shelve.
Large Ice shelves distribution.
Image from Ted Scambos, National Snow and Ice
Data Center, University of Colorado, Boulder.
Look at animation of
glacier flow
27](https://image.slidesharecdn.com/climatechangecryosphere-140804075104-phpapp02/85/Climate-change-changes-in-the-cryosphere-27-320.jpg)
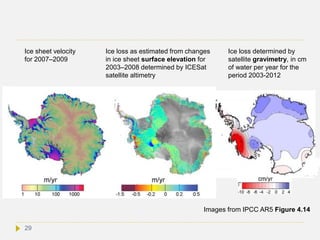
![Antarctic ice sheet losses
Based on satellite altimetry, interferometry, and gravimetry data, it was estimated that between
1992 and 2011, the ice sheets of East Antarctica, West Antarctica, and the Antarctic Peninsula
changed in mass by +14 ± 43, –65 ± 26, and –20 ± 14 gigatonnes per year, respectively.
(Science 30 November 2012).
IPCC AR5 comes to a similar conclusion from studies made by 10 different groups with
satellite gravimetry, satellite altimetry and the mass balance method. Over the period 1992–
2012 there is “very high confidence that [ice] losses are mainly from the northern Antarctic
Peninsula and the Amundsen Sea sector of West Antarctica, and high confidence that they
result from the acceleration of outlet ” through fast-moving ice or ice stream. Ice flow can
reach velocities of higher than 1 km/year.
Satellite records and in situ observations from ocean buoys indicate warming of the Southern
Ocean since the 1950s. The mean temperature of the Antarctic Circumpolar Current ranges
from -1 to 5°C and studies suggest an ocean warming of 1°C could activate the natural
process of basal melting of ice shelves by 10 m/year (IPCC AR4). Melting is due to the
interaction between warmer ocean waters and the base of the shelves. Ice-shelf melting is the
largest ablation process in Antarctica (Science, 19 July 2013). Basal melt of shelves was
estimated to be 1325 ± 235 gigatons per year (Gt/year), while calving flux was 1089 ± 139
Gt/year. Note that shelves that melt no longer impede glacier flow off the continent, so that
glacier flow will accelerate and lead to further ice loss.
28](https://image.slidesharecdn.com/climatechangecryosphere-140804075104-phpapp02/85/Climate-change-changes-in-the-cryosphere-28-320.jpg)
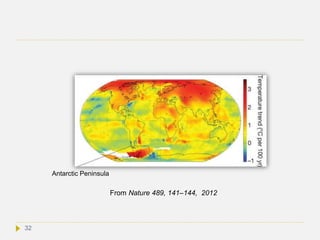
![Super warming in Antarctic Peninsula
The Antarctic Peninsula is one of the most warming areas of the World. Seven ice shelves
have retreated or disintegrated in the last two decades.[20] Every ice front on the southern
half of the peninsula experienced a retreat between 1947 and 2009.[24] Glaciers on the
Peninsula are also increasing their flow rate.[25]
The present warming, however, is not unprecedented. A recent paper in Nature (Nature
489, 141–144, 2012) reports an Antarctic Peninsula ice core study on the temperature
trends during the entire Holocene period. About 2,000 years ago average temperatures
were as warm as at present. From about 12000 to 9500 years ago it was considerably
warmer than today. Another relatively warm period similar to modern-day levels was from
about 9,200 to 2,500 years ago. There was a pronounced cooling from 2,500 to 600 years
ago, Since then there was again warming over the last 600 years, the rate of which became
steeper during the last 100 years (1.56 °C). Although this steep rise is not unprecedented,
it is highly unusual in the context of natural variability in the Antarctic Peninsula. Importantly,
during the cooling period a permanent ice shelf was established (based on marine
sediments studies) on the eastern part of the Peninsula, while it was not conspicuous during
the warm periods. This observation suggests that present warming may drive the partial
collapse of ice shelves that began decades ago, into a full collapse, which would seriously
fasten sea level rise.
31](https://image.slidesharecdn.com/climatechangecryosphere-140804075104-phpapp02/85/Climate-change-changes-in-the-cryosphere-31-320.jpg)