SlideShare a Scribd company logo
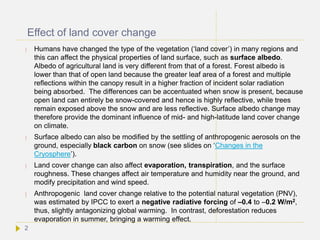
Changes in the biosphere
Land cover
Plants
Marine life
Land life
Humans
1
Data collection
and presentation
by Carl Denef,
Januari 2014
Effect of land cover change
 Humans have changed the type of the vegetation (‘land cover’) in many regions and
this can affect the physical properties of land surface, such as surface albedo.
Albedo of agricultural land is very different from that of a forest. Forest albedo is
lower than that of open land because the greater leaf area of a forest and multiple
reflections within the canopy result in a higher fraction of incident solar radiation
being absorbed. The differences can be accentuated when snow is present, because
open land can entirely be snow-covered and hence is highly reflective, while trees
remain exposed above the snow and are less reflective. Surface albedo change may
therefore provide the dominant influence of mid- and high-latitude land cover change
on climate.
 Surface albedo can also be modified by the settling of anthropogenic aerosols on the
ground, especially black carbon on snow (see slides on ‘Changes in the
Cryosphere’).
 Land cover change can also affect evaporation, transpiration, and the surface
roughness. These changes affect air temperature and humidity near the ground, and
modify precipitation and wind speed.
 Anthropogenic land cover change relative to the potential natural vegetation (PNV),
was estimated by IPCC to exert a negative radiative forcing of –0.4 to –0.2 W/m2,
thus, slightly antagonizing global warming. In contrast, deforestation reduces
evaporation in summer, bringing a warming effect.
2
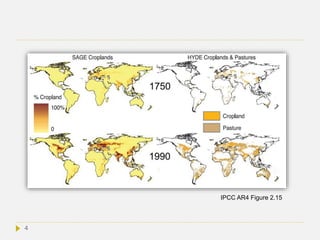
 In 1750, ~8 million km2 (6 to 7% of the global land surface) were used for crops and
pasture, while forest cover had decreased by ~11 million km2 . By 1990, croplands and
pasture covered ~50 million km2 (~37% of global land). Over the last century
croplands were abandoned along the eastern USA, while the eastern forests
regenerated. However, deforestation is occurring more rapidly in the tropics. In the
1990s, net removal of tropical forest increased in Africa and Asia. Latin America, Africa
and South and Southeast Asia showed exponential increases in cropland in the
last 50 years.
 With tropical deforestation becoming more significant in recent decades, warming due
to reduced evaporation may globally become more significant than increased surface
albedo of cropland and pasture surface change. Land change may then result in a
net warming instead of a small cooling.
3
IPCC AR4 Figure 2.15
4
Forest plant diseases and wildfires
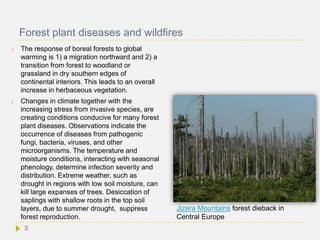
 The response of boreal forests to global
warming is 1) a migration northward and 2) a
transition from forest to woodland or
grassland in dry southern edges of
continental interiors. This leads to an overall
increase in herbaceous vegetation.
 Changes in climate together with the
increasing stress from invasive species, are
creating conditions conducive for many forest
plant diseases. Observations indicate the
occurrence of diseases from pathogenic
fungi, bacteria, viruses, and other
microorganisms. The temperature and
moisture conditions, interacting with seasonal
phenology, determine infection severity and
distribution. Extreme weather, such as
drought in regions with low soil moisture, can
kill large expanses of trees. Desiccation of
saplings with shallow roots in the top soil
layers, due to summer drought, suppress
forest reproduction.
5
Jizera Mountains forest dieback in
Central Europe
 Alaska yellow-cedar decline is drought-related. A weak native pathogen causes red band
needle blight [Dothistroma septosporum]. An aggressive nonnative pathogen causes sudden
oak death [Phytophthora ramorum]). In California and Oregon, sudden oak death rates
abruptly increased and then subsided, the patterm being driven by heavy rains and extended
wet weather during warm periods. Infected trees suffer a reduced capacity to manage water,
but survive until high temperatures and extended dry periods overwhelm their vascular
capability, resulting in death. Two cycles of this pattern have been noted in California: 1998-
2001 and 2005 -2008 (Frankel 2007). The Bay Area experienced an all-time record for rainy
days in March 2006, followed in July by the longest string of hot weather ever recorded.
 The Amazon rainforest. The strongest growth in the Amazon rainforest occurs during the dry
season as there is strong insolation, with water drawn from underground that stores the
previous wet season’s rainfall. In 2005, 1,900,000 km2 of rainforest experienced the worst
drought in 100 years.[59] Woods Hole Research Center showed that the forest could survive
only three years of drought.[61][62] Scientists at the Brazilian National Institute of Amazonian
Research argue that this drought response, coupled with the effects of deforestation by
humans, are pushing the rainforest towards a "tipping point" where it would start to die on a
centennial timescale. In the worst case the forest may turn into savanna or desert, with
catastrophic consequences for the World's climate. However, the IPCC AR5 report is less
pessimistic on this issue. In 2010 the Amazon rainforest experienced another severe drought
over 3,000,000 km2. In a typical year the Amazon forest absorbs 1.5 Gt of CO2; instead 8 Gt
less CO2 was captured.[64][65]
6
Wildfires
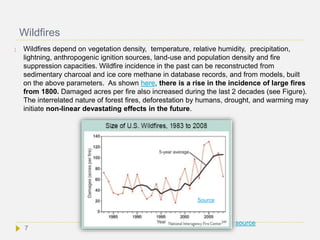
 Wildfires depend on vegetation density, temperature, relative humidity, precipitation,
lightning, anthropogenic ignition sources, land-use and population density and fire
suppression capacities. Wildfire incidence in the past can be reconstructed from
sedimentary charcoal and ice core methane in database records, and from models, built
on the above parameters. As shown here, there is a rise in the incidence of large fires
from 1800. Damaged acres per fire also increased during the last 2 decades (see Figure).
The interrelated nature of forest fires, deforestation by humans, drought, and warming may
initiate non-linear devastating effects in the future.
source
Source
7
Marine life
 When CO2 dissolves in water (aq) the following dissociations and chemical aquilibria
exist:
About 90% of the dissolved inorganic carbon occurs as HCO3
–
and H+
ions. The latter
react with ocean CO3
2–
ions in an equilibrium:
The CO3
2–
ions make an equilibrium with Ca2+
ions and solid CaCO3 which is the
building block of shells and skeletons of marine species:
As a result, CO3
2–
concentrations decrease.
 Many calcifying species such as planktonic coccolithophores, pteropods, clams,
oysters, mussels and corals may be adversely affected by a decreased capability to
produce their shells or skeletons. Fish and shellfish will also be negatively impacted.
 Other consequences are depression of metabolic rates in jumbo squid,[7] depression of
immune responses of blue mussels,[8] and coral bleaching. On the basis of our present
understandings, the potential for environmental and economic risks is high (IPCC AR5:
Cooley et al., 2009).
 Ocean acidification may also generate genome-wide changes in purple sea urchins.
When tested in culture under different CO2 levels, genetic changes occurred in genes
for biomineralization, lipid metabolism, and ion homeostasis, gene classes that build
skeletons and interact in pH regulation[Ref] .
8
Coral rifs
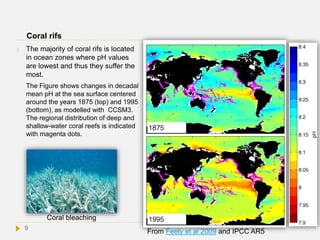
 The majority of coral rifs is located
in ocean zones where pH values
are lowest and thus they suffer the
most.
The Figure shows changes in decadal
mean pH at the sea surface centered
around the years 1875 (top) and 1995
(bottom), as modelled with CCSM3.
The regional distribution of deep and
shallow-water coral reefs is indicated
with magenta dots.
Coral bleaching
9
From Feely et al 2009 and IPCC AR5
Life in the Arctic
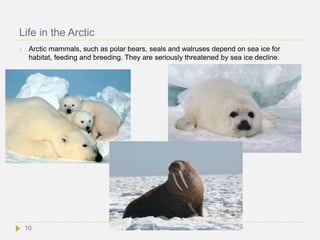
 Arctic mammals, such as polar bears, seals and walruses depend on sea ice for
habitat, feeding and breeding. They are seriously threatened by sea ice decline.
10
Biodiversity
 Terrestrial biodiversity tends to be highest near the equator,[2] which seems to be the result
of the warm climate and high primary productivity (growth of their biomass ).[3] Marine
biodiversity tends to be highest along coasts in the Western Pacific, where sea surface
temperature is highest and in the mid-latitudinal band in all oceans.[4 Not the climate itself
but rapid climate change has been associated in the past with biodiversity loss. At least 5
large and several smaller mass extinctions have occurred during the last 500 million years,
but biodiversity over long time periods has steadily expanded despite these massive losses.
Only 1%-3% of the species that have existed on Earth still exist today.[12]
 At present, biodiversity is declining again but this is already going on from the beginning of
the Holocene, more than 10,000 years ago. It is thought to be caused primarily by human
impacts, particularly by habitat destruction from human-induced land use change. Thus,
biodiversity loss in not an Industial Era event alone, but there are indications that climate
change may accelerate loss of biodiversity. However, other factors that are human-related
play an even more important role, such as pollution.
 From 1950 to 2011, human world population increased from 2.5 billion to >7 billion and is
predicted to reach a plateau of more than 9 billion during the 21st century.[162] It has been
claimed that the massive growth in the human population through the 20th century has had
more impact on biodiversity than any other single factor.[163][164] Whatever the causes,
biodiversity loss means loss of ‘ecosystem services’ to humans.
 Biodiversity is a broad subject on its own, it is not further dealt with here but read more here
11
Human health
Many deleterious effects of anthropogenic climate change have been reported, such
as:
 Heat-related morbidity and mortality
The 2003 summer caused ~15,000 deaths in France. Belgium, the Czech Republic,
Germany, Italy, Portugal, Spain, Switzerland, the Netherlands, and the UK all reported
excess mortality during the same period, with total deaths in the range of 35,000. In
France, deaths were massively reported for people aged 75 and over (60%).
Heat waves were also reported in 2003 in Andhra Pradesh, India, and caused the
deaths of 3,000 people
In July 1995, a heat wave killed more than 700 people in the Chicago area alone.
Read more here.
 Injuries and death from storms and floods
 Changes in infectious disease vectors in some areas in Europe (e.g. the tiger
mosquito)
 Allergenic pollen in the Northern Hemisphere at high and mid-latitudes
 Disturbed water and food supply leading to malnutrition
12
Exposure and vulnerability
 According to the 2011 Global Assessment Report, the average population exposed
to flooding every year more than doubled globally between 1970 and 2010, a
period in which the world’s population increased by 87 %. The number of people
exposed to severe storms almost tripled in cyclone-prone areas in the same period.
Read more
 Trends in human development along coasts amplify vulnerability, even if climate does
not change. For example, in China 100 million people moved from inland to the coast
in the last 20 years for reasons of benefits to the national economy, but this
population redistribution generated an increased risk from floods and storms. Sea-
level rise also adversely affects development in coastal areas, most seriously in
developing countries, in part due to their lower adaptive capacity. (IPCC AR5).
 Coastal areas already experiencing adverse effects of temperature rise are Coral
reefs, Arctic coasts (USA, Canada, Russia) and Antarctic Peninsula
 Another example of increased vulnerability is the ‘urban heat island effect’. In cities
plants are replaced with road and building surfaces, that trap heat while the cooling
by evaporating water of plants disappears.The temperature can be up to 7 °C higher
than in the surrounding rural areas. Since more and more people inhabit cities and
cities rapidly expand worldwide, global warming will affect an increasing number of
people more than average temperature trends indicate.
13
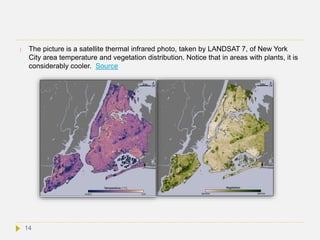
 The picture is a satellite thermal infrared photo, taken by LANDSAT 7, of New York
City area temperature and vegetation distribution. Notice that in areas with plants, it is
considerably cooler. Source
14
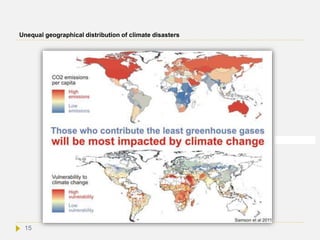
Unequal geographical distribution of climate disasters
15
Economical impacts
 Climate change is slowing down world economic output by 1.6 % a year and will lead
to a doubling of damage costs in the next two decades.
Read more here.
 Global loss rose from a few billions in the 1980’ to above 200 billions per year (in
2010 US$). (from IPCC “Managing the Risks of Extreme Events and Disasters to
Advance Climate Change Adaptation (SREX)”
Economic losses in percentage of Gross Domestic Product (GDP) (2001- 2006) are:
 - 0.3% in low-income countries.
 - 1% in middle income countries,
 - 0.1% in developped countries,
 - 1% in Small Island Developing States (up to 8 % in extreme case).
 Most of the increase is due to increase in exposure (high confidence), but
a role of climate change has not been excluded.
 During the exceptionally hot 2003 summer in France some nuclear power reactors
had to be temporarily shut down due to lack of cooling water.[Ref] Russia referred an
annual crop failure of ~25%, more than 1 million ha of burned areas, and ~$15 billion
(~1% GDP) of total economic loss.
16
Season creep
 Observations indicate earlier arrival of spring-like temperatures and later arrival of
winter-like temperatures (season creep), although evidence is not robust enough to
distinguish the change from natural variability with high confidence. In Europe, arrival
of spring appears to have moved up by approximately one week in a recent 30 year
period.[9][10] Studies of plant phenology found advancement in spring in the range of 2–
3 days per decade, and 0.3–1.6 days per decade delay in autumn, over the past 30–
80 years.[11] Studies have suggested that changes in the season-determined
synchrony of biological events is disturbed by climate chang, as different species have
changed their seasonal timing to different degrees. For example, woodland birds feed
moth larvae to their young and produce the greatest number of chicks when caterpillar
number peaks. In warm years caterpillar are now most numerous before the nestlings
have hatched, which can result in starvation and decrease in population size. A large
phenological examination on 542 plant species in 21 European countries from 1971–
2000 showed that 78% of all leafing, flowering, and fruiting records advanced while
only 3% were significantly delayed.[10][30] However, more needs to be studied before
the overall impact of seasonal change on ecosystems can be estimated with high
confidence. Efforts are now being made to gather more data and implement them in
models[Ref].
17
View other slide shows on climate change and biosphere
18

More Related Content

What's hot

Study of avian diversity in and around chinari
Study of avian diversity in and around chinariStudy of avian diversity in and around chinari
Study of avian diversity in and around chinari
Hamid Ur-Rahman
 
3 schools of systematics
3 schools of systematics3 schools of systematics
3 schools of systematics
Shaina Mavreen Villaroza
 
The Savanna Ecosystem
The Savanna EcosystemThe Savanna Ecosystem
The Savanna Ecosystem
Kieron Hunter
 
Educational Facilities Manual - Chapter 1-2
Educational Facilities Manual - Chapter 1-2Educational Facilities Manual - Chapter 1-2
Educational Facilities Manual - Chapter 1-2
MelisaSumbilon3
 
Deforestation - Causes, Effects and Solution
Deforestation - Causes, Effects and SolutionDeforestation - Causes, Effects and Solution
Deforestation - Causes, Effects and Solution
Nicole Angelique Pangilinan
 
Fossils & Fossilization.ppt
Fossils & Fossilization.pptFossils & Fossilization.ppt
Fossils & Fossilization.ppt
kashafAzam1
 
Terrestrial Biomes
Terrestrial BiomesTerrestrial Biomes
Terrestrial Biomes
Joemar Cabradilla
 
Human activities and impact on environment
Human activities and impact on environmentHuman activities and impact on environment
Human activities and impact on environment
Bahauddin Zakariya University lahore
 
Forest management
Forest managementForest management
Forest management
Chirag Pipalia
 
Layers of the atmosphere
Layers of the atmosphereLayers of the atmosphere
Layers of the atmosphere
Jaime Pena
 
Systematics
SystematicsSystematics
Systematics
Dr. Manoj Bangadkar
 
Modes of wildlife conservation
Modes of wildlife conservationModes of wildlife conservation
Modes of wildlife conservation
SibghaS
 
Archaeopteryx
ArchaeopteryxArchaeopteryx
Wildlife rules in world. Wildlife rules in pakistan.
Wildlife rules in world. Wildlife rules in pakistan. Wildlife rules in world. Wildlife rules in pakistan.
Wildlife rules in world. Wildlife rules in pakistan.
Tahir Ali,Punjab University Lahore
 
Tundra 1
Tundra 1Tundra 1
Tundra 1
Erin Maccarelli
 
Ecological niche
Ecological niche Ecological niche
Ecological niche
Dr. Karri Ramarao
 
MAJOR BIOMES OF WORLD
MAJOR BIOMES OF WORLDMAJOR BIOMES OF WORLD
MAJOR BIOMES OF WORLD
NikkiM12
 
Wild life of pakistan
Wild life of pakistanWild life of pakistan
Wild life of pakistan
Qamar iqbal
 
Speciation and domestication
Speciation and domesticationSpeciation and domestication
Speciation and domestication
Hemalatha Munichamy
 
Ecosystem
EcosystemEcosystem
Ecosystem
Jay Maheshwari
 

What's hot (20)

Study of avian diversity in and around chinari
Study of avian diversity in and around chinariStudy of avian diversity in and around chinari
Study of avian diversity in and around chinari
 
3 schools of systematics
3 schools of systematics3 schools of systematics
3 schools of systematics
 
The Savanna Ecosystem
The Savanna EcosystemThe Savanna Ecosystem
The Savanna Ecosystem
 
Educational Facilities Manual - Chapter 1-2
Educational Facilities Manual - Chapter 1-2Educational Facilities Manual - Chapter 1-2
Educational Facilities Manual - Chapter 1-2
 
Deforestation - Causes, Effects and Solution
Deforestation - Causes, Effects and SolutionDeforestation - Causes, Effects and Solution
Deforestation - Causes, Effects and Solution
 
Fossils & Fossilization.ppt
Fossils & Fossilization.pptFossils & Fossilization.ppt
Fossils & Fossilization.ppt
 
Terrestrial Biomes
Terrestrial BiomesTerrestrial Biomes
Terrestrial Biomes
 
Human activities and impact on environment
Human activities and impact on environmentHuman activities and impact on environment
Human activities and impact on environment
 
Forest management
Forest managementForest management
Forest management
 
Layers of the atmosphere
Layers of the atmosphereLayers of the atmosphere
Layers of the atmosphere
 
Systematics
SystematicsSystematics
Systematics
 
Modes of wildlife conservation
Modes of wildlife conservationModes of wildlife conservation
Modes of wildlife conservation
 
Archaeopteryx
ArchaeopteryxArchaeopteryx
Archaeopteryx
 
Wildlife rules in world. Wildlife rules in pakistan.
Wildlife rules in world. Wildlife rules in pakistan. Wildlife rules in world. Wildlife rules in pakistan.
Wildlife rules in world. Wildlife rules in pakistan.
 
Tundra 1
Tundra 1Tundra 1
Tundra 1
 
Ecological niche
Ecological niche Ecological niche
Ecological niche
 
MAJOR BIOMES OF WORLD
MAJOR BIOMES OF WORLDMAJOR BIOMES OF WORLD
MAJOR BIOMES OF WORLD
 
Wild life of pakistan
Wild life of pakistanWild life of pakistan
Wild life of pakistan
 
Speciation and domestication
Speciation and domesticationSpeciation and domestication
Speciation and domestication
 
Ecosystem
EcosystemEcosystem
Ecosystem
 

Similar to Climate change: Changes in the biosphere

Golbal Warming
Golbal WarmingGolbal Warming
Golbal Warming
Gaurav Jawalkar
 
Environmental conditions play a key role in defining the function an.pdf
Environmental conditions play a key role in defining the function an.pdfEnvironmental conditions play a key role in defining the function an.pdf
Environmental conditions play a key role in defining the function an.pdf
anandhomeneeds
 
Forest and climate change a study how world By Mr Allah Dad Khan
Forest and climate change a study how world By Mr Allah Dad Khan Forest and climate change a study how world By Mr Allah Dad Khan
Forest and climate change a study how world By Mr Allah Dad Khan
Mr.Allah Dad Khan
 
Forest and climate change a study how world By Mr Allah Dad Khan
Forest and climate change a study how world By Mr Allah Dad Khan Forest and climate change a study how world By Mr Allah Dad Khan
Forest and climate change a study how world By Mr Allah Dad Khan
Mr.Allah Dad Khan
 
Ecological Effects
Ecological EffectsEcological Effects
Ecological Effects
Nicole Cocco
 
Deforestation.pptx
Deforestation.pptxDeforestation.pptx
Deforestation.pptx
sanjauliTraders
 
Tropical Rainforest Biomes
Tropical Rainforest BiomesTropical Rainforest Biomes
Tropical Rainforest Biomes
fatin filzah
 
#SciChallenge2017 - Global warming
#SciChallenge2017 - Global warming #SciChallenge2017 - Global warming
#SciChallenge2017 - Global warming
Bianca Mitroi Alexandra
 
Forest and climate change a study how world A Presentation by Mr Allah Dad K...
Forest and climate change a study how world  A Presentation by Mr Allah Dad K...Forest and climate change a study how world  A Presentation by Mr Allah Dad K...
Forest and climate change a study how world A Presentation by Mr Allah Dad K...
Mr.Allah Dad Khan
 
Man Environmental Interaction
Man Environmental Interaction  Man Environmental Interaction
Man Environmental Interaction
Safeere1
 
Rain forest and golbal warming
Rain forest and golbal warmingRain forest and golbal warming
Rain forest and golbal warming
ManjunathBetageri
 
A presentation on impact of human activities on weather and climate
A presentation on impact of human activities on weather and climateA presentation on impact of human activities on weather and climate
A presentation on impact of human activities on weather and climate
Vasu Malhotra
 
Qura presentation
Qura presentationQura presentation
Qura presentation
QuratulAin106
 
28.wild l ife as affected by climate change A series of Presentation ByMr All...
28.wild l ife as affected by climate change A series of Presentation ByMr All...28.wild l ife as affected by climate change A series of Presentation ByMr All...
28.wild l ife as affected by climate change A series of Presentation ByMr All...
Mr.Allah Dad Khan
 
8.wild life and impacts of climate change on wildlife
8.wild life and  impacts of climate change on wildlife8.wild life and  impacts of climate change on wildlife
8.wild life and impacts of climate change on wildlife
Mr.Allah Dad Khan
 
Chahat
ChahatChahat
Chahat
Rahat2009
 
IMPACTS OF GLOBAL CLIMATE CHANGE ON AQUATIC BIOTA
IMPACTS OF GLOBAL CLIMATE CHANGE ON AQUATIC BIOTAIMPACTS OF GLOBAL CLIMATE CHANGE ON AQUATIC BIOTA
IMPACTS OF GLOBAL CLIMATE CHANGE ON AQUATIC BIOTA
Albert Wandera
 
Climate Change and Its Dangerous Effect
Climate Change and Its Dangerous EffectClimate Change and Its Dangerous Effect
Climate Change and Its Dangerous Effect
Acharya Jagadish Chandra Bose College
 
Presentation1
Presentation1Presentation1
Presentation1
Albein Vivek
 
ENVIRONMENT & POLLUTIONS
ENVIRONMENT & POLLUTIONSENVIRONMENT & POLLUTIONS
ENVIRONMENT & POLLUTIONS
Lakshya Sharma
 

Similar to Climate change: Changes in the biosphere (20)

Golbal Warming
Golbal WarmingGolbal Warming
Golbal Warming
 
Environmental conditions play a key role in defining the function an.pdf
Environmental conditions play a key role in defining the function an.pdfEnvironmental conditions play a key role in defining the function an.pdf
Environmental conditions play a key role in defining the function an.pdf
 
Forest and climate change a study how world By Mr Allah Dad Khan
Forest and climate change a study how world By Mr Allah Dad Khan Forest and climate change a study how world By Mr Allah Dad Khan
Forest and climate change a study how world By Mr Allah Dad Khan
 
Forest and climate change a study how world By Mr Allah Dad Khan
Forest and climate change a study how world By Mr Allah Dad Khan Forest and climate change a study how world By Mr Allah Dad Khan
Forest and climate change a study how world By Mr Allah Dad Khan
 
Ecological Effects
Ecological EffectsEcological Effects
Ecological Effects
 
Deforestation.pptx
Deforestation.pptxDeforestation.pptx
Deforestation.pptx
 
Tropical Rainforest Biomes
Tropical Rainforest BiomesTropical Rainforest Biomes
Tropical Rainforest Biomes
 
#SciChallenge2017 - Global warming
#SciChallenge2017 - Global warming #SciChallenge2017 - Global warming
#SciChallenge2017 - Global warming
 
Forest and climate change a study how world A Presentation by Mr Allah Dad K...
Forest and climate change a study how world  A Presentation by Mr Allah Dad K...Forest and climate change a study how world  A Presentation by Mr Allah Dad K...
Forest and climate change a study how world A Presentation by Mr Allah Dad K...
 
Man Environmental Interaction
Man Environmental Interaction  Man Environmental Interaction
Man Environmental Interaction
 
Rain forest and golbal warming
Rain forest and golbal warmingRain forest and golbal warming
Rain forest and golbal warming
 
A presentation on impact of human activities on weather and climate
A presentation on impact of human activities on weather and climateA presentation on impact of human activities on weather and climate
A presentation on impact of human activities on weather and climate
 
Qura presentation
Qura presentationQura presentation
Qura presentation
 
28.wild l ife as affected by climate change A series of Presentation ByMr All...
28.wild l ife as affected by climate change A series of Presentation ByMr All...28.wild l ife as affected by climate change A series of Presentation ByMr All...
28.wild l ife as affected by climate change A series of Presentation ByMr All...
 
8.wild life and impacts of climate change on wildlife
8.wild life and  impacts of climate change on wildlife8.wild life and  impacts of climate change on wildlife
8.wild life and impacts of climate change on wildlife
 
Chahat
ChahatChahat
Chahat
 
IMPACTS OF GLOBAL CLIMATE CHANGE ON AQUATIC BIOTA
IMPACTS OF GLOBAL CLIMATE CHANGE ON AQUATIC BIOTAIMPACTS OF GLOBAL CLIMATE CHANGE ON AQUATIC BIOTA
IMPACTS OF GLOBAL CLIMATE CHANGE ON AQUATIC BIOTA
 
Climate Change and Its Dangerous Effect
Climate Change and Its Dangerous EffectClimate Change and Its Dangerous Effect
Climate Change and Its Dangerous Effect
 
Presentation1
Presentation1Presentation1
Presentation1
 
ENVIRONMENT & POLLUTIONS
ENVIRONMENT & POLLUTIONSENVIRONMENT & POLLUTIONS
ENVIRONMENT & POLLUTIONS
 

More from cdenef

Renewable energy
Renewable energyRenewable energy
Renewable energy
cdenef
 
climate change in the past: Palaeoclimate
climate change in the past: Palaeoclimateclimate change in the past: Palaeoclimate
climate change in the past: Palaeoclimate
cdenef
 
Nuclear energy
Nuclear energyNuclear energy
Nuclear energy
cdenef
 
Fossil energy
Fossil energyFossil energy
Fossil energy
cdenef
 
Fixing climate change
Fixing climate changeFixing climate change
Fixing climate change
cdenef
 
Climate change: Extreme weather events
Climate change: Extreme weather eventsClimate change: Extreme weather events
Climate change: Extreme weather events
cdenef
 
Energy costs
Energy costsEnergy costs
Energy costs
cdenef
 
Climate change prediction
Climate change predictionClimate change prediction
Climate change prediction
cdenef
 
Climate change: changes in the cryosphere
Climate change: changes in the cryosphereClimate change: changes in the cryosphere
Climate change: changes in the cryosphere
cdenef
 
Climate change: Changes in the hydrosphere
Climate change: Changes in the hydrosphereClimate change: Changes in the hydrosphere
Climate change: Changes in the hydrosphere
cdenef
 
Climate change: Changes in the atmosphere
Climate change: Changes in the atmosphereClimate change: Changes in the atmosphere
Climate change: Changes in the atmosphere
cdenef
 
Changes in the atmosphere
Changes in the atmosphereChanges in the atmosphere
Changes in the atmosphere
cdenef
 
Key concepts in Climate Science
Key concepts in Climate  ScienceKey concepts in Climate  Science
Key concepts in Climate Science
cdenef
 
Energy production & consumption
Energy production & consumptionEnergy production & consumption
Energy production & consumption
cdenef
 
Climate change summary and conclusions
Climate change summary and conclusionsClimate change summary and conclusions
Climate change summary and conclusions
cdenef
 
Energy in everyday life
Energy in everyday lifeEnergy in everyday life
Energy in everyday life
cdenef
 

More from cdenef (16)

Renewable energy
Renewable energyRenewable energy
Renewable energy
 
climate change in the past: Palaeoclimate
climate change in the past: Palaeoclimateclimate change in the past: Palaeoclimate
climate change in the past: Palaeoclimate
 
Nuclear energy
Nuclear energyNuclear energy
Nuclear energy
 
Fossil energy
Fossil energyFossil energy
Fossil energy
 
Fixing climate change
Fixing climate changeFixing climate change
Fixing climate change
 
Climate change: Extreme weather events
Climate change: Extreme weather eventsClimate change: Extreme weather events
Climate change: Extreme weather events
 
Energy costs
Energy costsEnergy costs
Energy costs
 
Climate change prediction
Climate change predictionClimate change prediction
Climate change prediction
 
Climate change: changes in the cryosphere
Climate change: changes in the cryosphereClimate change: changes in the cryosphere
Climate change: changes in the cryosphere
 
Climate change: Changes in the hydrosphere
Climate change: Changes in the hydrosphereClimate change: Changes in the hydrosphere
Climate change: Changes in the hydrosphere
 
Climate change: Changes in the atmosphere
Climate change: Changes in the atmosphereClimate change: Changes in the atmosphere
Climate change: Changes in the atmosphere
 
Changes in the atmosphere
Changes in the atmosphereChanges in the atmosphere
Changes in the atmosphere
 
Key concepts in Climate Science
Key concepts in Climate  ScienceKey concepts in Climate  Science
Key concepts in Climate Science
 
Energy production & consumption
Energy production & consumptionEnergy production & consumption
Energy production & consumption
 
Climate change summary and conclusions
Climate change summary and conclusionsClimate change summary and conclusions
Climate change summary and conclusions
 
Energy in everyday life
Energy in everyday lifeEnergy in everyday life
Energy in everyday life
 

Recently uploaded

一比一原版美国亚利桑那大学毕业证(ua学位证)如何办理
一比一原版美国亚利桑那大学毕业证(ua学位证)如何办理一比一原版美国亚利桑那大学毕业证(ua学位证)如何办理
一比一原版美国亚利桑那大学毕业证(ua学位证)如何办理
lyurzi7r
 
学校原版(unuk学位证书)英国牛津布鲁克斯大学毕业证硕士文凭原版一模一样
学校原版(unuk学位证书)英国牛津布鲁克斯大学毕业证硕士文凭原版一模一样学校原版(unuk学位证书)英国牛津布鲁克斯大学毕业证硕士文凭原版一模一样
学校原版(unuk学位证书)英国牛津布鲁克斯大学毕业证硕士文凭原版一模一样
ehfyqtu
 
2024-06-22 Composting at Home 101 on Zoom
2024-06-22 Composting at Home 101  on Zoom2024-06-22 Composting at Home 101  on Zoom
2024-06-22 Composting at Home 101 on Zoom
Ellen Book
 
GFW Office Hours: How to Use Planet Imagery on Global Forest Watch_June 11, 2024
GFW Office Hours: How to Use Planet Imagery on Global Forest Watch_June 11, 2024GFW Office Hours: How to Use Planet Imagery on Global Forest Watch_June 11, 2024
GFW Office Hours: How to Use Planet Imagery on Global Forest Watch_June 11, 2024
Global Forest Watch
 
Lessons from operationalizing integrated landscape approaches
Lessons from operationalizing integrated landscape approachesLessons from operationalizing integrated landscape approaches
Lessons from operationalizing integrated landscape approaches
CIFOR-ICRAF
 
一比一原版(unuk毕业证书)英国诺丁汉大学毕业证如何办理
一比一原版(unuk毕业证书)英国诺丁汉大学毕业证如何办理一比一原版(unuk毕业证书)英国诺丁汉大学毕业证如何办理
一比一原版(unuk毕业证书)英国诺丁汉大学毕业证如何办理
evtena
 
Notes on National Green Tribunal, Environmental laws
Notes on National Green Tribunal, Environmental lawsNotes on National Green Tribunal, Environmental laws
Notes on National Green Tribunal, Environmental laws
sforsidd
 
Welcoming Wolves Back Home and the Effects of Manifest Destiny
Welcoming Wolves Back Home and the Effects of Manifest DestinyWelcoming Wolves Back Home and the Effects of Manifest Destiny
Welcoming Wolves Back Home and the Effects of Manifest Destiny
Megan Hughes
 
一比一原版西澳大学毕业证学历证书如何办理
一比一原版西澳大学毕业证学历证书如何办理一比一原版西澳大学毕业证学历证书如何办理
一比一原版西澳大学毕业证学历证书如何办理
yxfus
 
原版制作(UPSaclay毕业证书)巴黎萨克雷大学毕业证PDF成绩单一模一样
原版制作(UPSaclay毕业证书)巴黎萨克雷大学毕业证PDF成绩单一模一样原版制作(UPSaclay毕业证书)巴黎萨克雷大学毕业证PDF成绩单一模一样
原版制作(UPSaclay毕业证书)巴黎萨克雷大学毕业证PDF成绩单一模一样
astuz
 
一比一原版美国丹佛大学毕业证(ud学位证)如何办理
一比一原版美国丹佛大学毕业证(ud学位证)如何办理一比一原版美国丹佛大学毕业证(ud学位证)如何办理
一比一原版美国丹佛大学毕业证(ud学位证)如何办理
43ekmxzp
 
Formulation of aramang baked products enriched with malunggay
Formulation of aramang baked products enriched with malunggayFormulation of aramang baked products enriched with malunggay
Formulation of aramang baked products enriched with malunggay
Open Access Research Paper
 
Good Agricultural Practices Presentation PDF.pdf
Good Agricultural Practices Presentation PDF.pdfGood Agricultural Practices Presentation PDF.pdf
Good Agricultural Practices Presentation PDF.pdf
ronnelapilado23
 
REPORT-PRESENTATION BY CHIEF SECRETARY, ANDAMAN NICOBAR ADMINISTRATION IN OA ...
REPORT-PRESENTATION BY CHIEF SECRETARY, ANDAMAN NICOBAR ADMINISTRATION IN OA ...REPORT-PRESENTATION BY CHIEF SECRETARY, ANDAMAN NICOBAR ADMINISTRATION IN OA ...
REPORT-PRESENTATION BY CHIEF SECRETARY, ANDAMAN NICOBAR ADMINISTRATION IN OA ...
pareeksulkash
 
一比一原版美国迈阿密大学毕业证如何办理
一比一原版美国迈阿密大学毕业证如何办理一比一原版美国迈阿密大学毕业证如何办理
一比一原版美国迈阿密大学毕业证如何办理
yfvet
 
A Comprehensive Guide on Cable Location Services Detections Method, Tools, an...
A Comprehensive Guide on Cable Location Services Detections Method, Tools, an...A Comprehensive Guide on Cable Location Services Detections Method, Tools, an...
A Comprehensive Guide on Cable Location Services Detections Method, Tools, an...
Aussie Hydro-Vac Services
 
一比一原版美国堪萨斯大学毕业证(KU学位证)如何办理
一比一原版美国堪萨斯大学毕业证(KU学位证)如何办理一比一原版美国堪萨斯大学毕业证(KU学位证)如何办理
一比一原版美国堪萨斯大学毕业证(KU学位证)如何办理
7kvwgv0y
 
Republic of Ethiopia EPA (2003) Ambient Environment Standards for Ethiopia.pdf
Republic of Ethiopia EPA (2003) Ambient Environment Standards for Ethiopia.pdfRepublic of Ethiopia EPA (2003) Ambient Environment Standards for Ethiopia.pdf
Republic of Ethiopia EPA (2003) Ambient Environment Standards for Ethiopia.pdf
Abraham Lebeza
 
Green Wealth Management - UBS A world of access and opportunuty
Green Wealth Management - UBS A world of access and opportunutyGreen Wealth Management - UBS A world of access and opportunuty
Green Wealth Management - UBS A world of access and opportunuty
adrianmaruntelu
 
21321321321sfsdfdsfsdfsdfsfddsfppt ai.pptx
21321321321sfsdfdsfsdfsdfsfddsfppt ai.pptx21321321321sfsdfdsfsdfsdfsfddsfppt ai.pptx
21321321321sfsdfdsfsdfsdfsfddsfppt ai.pptx
JustineGarcia32
 

Recently uploaded (20)

一比一原版美国亚利桑那大学毕业证(ua学位证)如何办理
一比一原版美国亚利桑那大学毕业证(ua学位证)如何办理一比一原版美国亚利桑那大学毕业证(ua学位证)如何办理
一比一原版美国亚利桑那大学毕业证(ua学位证)如何办理
 
学校原版(unuk学位证书)英国牛津布鲁克斯大学毕业证硕士文凭原版一模一样
学校原版(unuk学位证书)英国牛津布鲁克斯大学毕业证硕士文凭原版一模一样学校原版(unuk学位证书)英国牛津布鲁克斯大学毕业证硕士文凭原版一模一样
学校原版(unuk学位证书)英国牛津布鲁克斯大学毕业证硕士文凭原版一模一样
 
2024-06-22 Composting at Home 101 on Zoom
2024-06-22 Composting at Home 101  on Zoom2024-06-22 Composting at Home 101  on Zoom
2024-06-22 Composting at Home 101 on Zoom
 
GFW Office Hours: How to Use Planet Imagery on Global Forest Watch_June 11, 2024
GFW Office Hours: How to Use Planet Imagery on Global Forest Watch_June 11, 2024GFW Office Hours: How to Use Planet Imagery on Global Forest Watch_June 11, 2024
GFW Office Hours: How to Use Planet Imagery on Global Forest Watch_June 11, 2024
 
Lessons from operationalizing integrated landscape approaches
Lessons from operationalizing integrated landscape approachesLessons from operationalizing integrated landscape approaches
Lessons from operationalizing integrated landscape approaches
 
一比一原版(unuk毕业证书)英国诺丁汉大学毕业证如何办理
一比一原版(unuk毕业证书)英国诺丁汉大学毕业证如何办理一比一原版(unuk毕业证书)英国诺丁汉大学毕业证如何办理
一比一原版(unuk毕业证书)英国诺丁汉大学毕业证如何办理
 
Notes on National Green Tribunal, Environmental laws
Notes on National Green Tribunal, Environmental lawsNotes on National Green Tribunal, Environmental laws
Notes on National Green Tribunal, Environmental laws
 
Welcoming Wolves Back Home and the Effects of Manifest Destiny
Welcoming Wolves Back Home and the Effects of Manifest DestinyWelcoming Wolves Back Home and the Effects of Manifest Destiny
Welcoming Wolves Back Home and the Effects of Manifest Destiny
 
一比一原版西澳大学毕业证学历证书如何办理
一比一原版西澳大学毕业证学历证书如何办理一比一原版西澳大学毕业证学历证书如何办理
一比一原版西澳大学毕业证学历证书如何办理
 
原版制作(UPSaclay毕业证书)巴黎萨克雷大学毕业证PDF成绩单一模一样
原版制作(UPSaclay毕业证书)巴黎萨克雷大学毕业证PDF成绩单一模一样原版制作(UPSaclay毕业证书)巴黎萨克雷大学毕业证PDF成绩单一模一样
原版制作(UPSaclay毕业证书)巴黎萨克雷大学毕业证PDF成绩单一模一样
 
一比一原版美国丹佛大学毕业证(ud学位证)如何办理
一比一原版美国丹佛大学毕业证(ud学位证)如何办理一比一原版美国丹佛大学毕业证(ud学位证)如何办理
一比一原版美国丹佛大学毕业证(ud学位证)如何办理
 
Formulation of aramang baked products enriched with malunggay
Formulation of aramang baked products enriched with malunggayFormulation of aramang baked products enriched with malunggay
Formulation of aramang baked products enriched with malunggay
 
Good Agricultural Practices Presentation PDF.pdf
Good Agricultural Practices Presentation PDF.pdfGood Agricultural Practices Presentation PDF.pdf
Good Agricultural Practices Presentation PDF.pdf
 
REPORT-PRESENTATION BY CHIEF SECRETARY, ANDAMAN NICOBAR ADMINISTRATION IN OA ...
REPORT-PRESENTATION BY CHIEF SECRETARY, ANDAMAN NICOBAR ADMINISTRATION IN OA ...REPORT-PRESENTATION BY CHIEF SECRETARY, ANDAMAN NICOBAR ADMINISTRATION IN OA ...
REPORT-PRESENTATION BY CHIEF SECRETARY, ANDAMAN NICOBAR ADMINISTRATION IN OA ...
 
一比一原版美国迈阿密大学毕业证如何办理
一比一原版美国迈阿密大学毕业证如何办理一比一原版美国迈阿密大学毕业证如何办理
一比一原版美国迈阿密大学毕业证如何办理
 
A Comprehensive Guide on Cable Location Services Detections Method, Tools, an...
A Comprehensive Guide on Cable Location Services Detections Method, Tools, an...A Comprehensive Guide on Cable Location Services Detections Method, Tools, an...
A Comprehensive Guide on Cable Location Services Detections Method, Tools, an...
 
一比一原版美国堪萨斯大学毕业证(KU学位证)如何办理
一比一原版美国堪萨斯大学毕业证(KU学位证)如何办理一比一原版美国堪萨斯大学毕业证(KU学位证)如何办理
一比一原版美国堪萨斯大学毕业证(KU学位证)如何办理
 
Republic of Ethiopia EPA (2003) Ambient Environment Standards for Ethiopia.pdf
Republic of Ethiopia EPA (2003) Ambient Environment Standards for Ethiopia.pdfRepublic of Ethiopia EPA (2003) Ambient Environment Standards for Ethiopia.pdf
Republic of Ethiopia EPA (2003) Ambient Environment Standards for Ethiopia.pdf
 
Green Wealth Management - UBS A world of access and opportunuty
Green Wealth Management - UBS A world of access and opportunutyGreen Wealth Management - UBS A world of access and opportunuty
Green Wealth Management - UBS A world of access and opportunuty
 
21321321321sfsdfdsfsdfsdfsfddsfppt ai.pptx
21321321321sfsdfdsfsdfsdfsfddsfppt ai.pptx21321321321sfsdfdsfsdfsdfsfddsfppt ai.pptx
21321321321sfsdfdsfsdfsdfsfddsfppt ai.pptx
 

Climate change: Changes in the biosphere

  • 1. Changes in the biosphere Land cover Plants Marine life Land life Humans 1 Data collection and presentation by Carl Denef, Januari 2014
  • 2. Effect of land cover change  Humans have changed the type of the vegetation (‘land cover’) in many regions and this can affect the physical properties of land surface, such as surface albedo. Albedo of agricultural land is very different from that of a forest. Forest albedo is lower than that of open land because the greater leaf area of a forest and multiple reflections within the canopy result in a higher fraction of incident solar radiation being absorbed. The differences can be accentuated when snow is present, because open land can entirely be snow-covered and hence is highly reflective, while trees remain exposed above the snow and are less reflective. Surface albedo change may therefore provide the dominant influence of mid- and high-latitude land cover change on climate.  Surface albedo can also be modified by the settling of anthropogenic aerosols on the ground, especially black carbon on snow (see slides on ‘Changes in the Cryosphere’).  Land cover change can also affect evaporation, transpiration, and the surface roughness. These changes affect air temperature and humidity near the ground, and modify precipitation and wind speed.  Anthropogenic land cover change relative to the potential natural vegetation (PNV), was estimated by IPCC to exert a negative radiative forcing of –0.4 to –0.2 W/m2, thus, slightly antagonizing global warming. In contrast, deforestation reduces evaporation in summer, bringing a warming effect. 2
  • 3.  In 1750, ~8 million km2 (6 to 7% of the global land surface) were used for crops and pasture, while forest cover had decreased by ~11 million km2 . By 1990, croplands and pasture covered ~50 million km2 (~37% of global land). Over the last century croplands were abandoned along the eastern USA, while the eastern forests regenerated. However, deforestation is occurring more rapidly in the tropics. In the 1990s, net removal of tropical forest increased in Africa and Asia. Latin America, Africa and South and Southeast Asia showed exponential increases in cropland in the last 50 years.  With tropical deforestation becoming more significant in recent decades, warming due to reduced evaporation may globally become more significant than increased surface albedo of cropland and pasture surface change. Land change may then result in a net warming instead of a small cooling. 3
  • 5. Forest plant diseases and wildfires  The response of boreal forests to global warming is 1) a migration northward and 2) a transition from forest to woodland or grassland in dry southern edges of continental interiors. This leads to an overall increase in herbaceous vegetation.  Changes in climate together with the increasing stress from invasive species, are creating conditions conducive for many forest plant diseases. Observations indicate the occurrence of diseases from pathogenic fungi, bacteria, viruses, and other microorganisms. The temperature and moisture conditions, interacting with seasonal phenology, determine infection severity and distribution. Extreme weather, such as drought in regions with low soil moisture, can kill large expanses of trees. Desiccation of saplings with shallow roots in the top soil layers, due to summer drought, suppress forest reproduction. 5 Jizera Mountains forest dieback in Central Europe
  • 6.  Alaska yellow-cedar decline is drought-related. A weak native pathogen causes red band needle blight [Dothistroma septosporum]. An aggressive nonnative pathogen causes sudden oak death [Phytophthora ramorum]). In California and Oregon, sudden oak death rates abruptly increased and then subsided, the patterm being driven by heavy rains and extended wet weather during warm periods. Infected trees suffer a reduced capacity to manage water, but survive until high temperatures and extended dry periods overwhelm their vascular capability, resulting in death. Two cycles of this pattern have been noted in California: 1998- 2001 and 2005 -2008 (Frankel 2007). The Bay Area experienced an all-time record for rainy days in March 2006, followed in July by the longest string of hot weather ever recorded.  The Amazon rainforest. The strongest growth in the Amazon rainforest occurs during the dry season as there is strong insolation, with water drawn from underground that stores the previous wet season’s rainfall. In 2005, 1,900,000 km2 of rainforest experienced the worst drought in 100 years.[59] Woods Hole Research Center showed that the forest could survive only three years of drought.[61][62] Scientists at the Brazilian National Institute of Amazonian Research argue that this drought response, coupled with the effects of deforestation by humans, are pushing the rainforest towards a "tipping point" where it would start to die on a centennial timescale. In the worst case the forest may turn into savanna or desert, with catastrophic consequences for the World's climate. However, the IPCC AR5 report is less pessimistic on this issue. In 2010 the Amazon rainforest experienced another severe drought over 3,000,000 km2. In a typical year the Amazon forest absorbs 1.5 Gt of CO2; instead 8 Gt less CO2 was captured.[64][65] 6
  • 7. Wildfires  Wildfires depend on vegetation density, temperature, relative humidity, precipitation, lightning, anthropogenic ignition sources, land-use and population density and fire suppression capacities. Wildfire incidence in the past can be reconstructed from sedimentary charcoal and ice core methane in database records, and from models, built on the above parameters. As shown here, there is a rise in the incidence of large fires from 1800. Damaged acres per fire also increased during the last 2 decades (see Figure). The interrelated nature of forest fires, deforestation by humans, drought, and warming may initiate non-linear devastating effects in the future. source Source 7
  • 8. Marine life  When CO2 dissolves in water (aq) the following dissociations and chemical aquilibria exist: About 90% of the dissolved inorganic carbon occurs as HCO3 – and H+ ions. The latter react with ocean CO3 2– ions in an equilibrium: The CO3 2– ions make an equilibrium with Ca2+ ions and solid CaCO3 which is the building block of shells and skeletons of marine species: As a result, CO3 2– concentrations decrease.  Many calcifying species such as planktonic coccolithophores, pteropods, clams, oysters, mussels and corals may be adversely affected by a decreased capability to produce their shells or skeletons. Fish and shellfish will also be negatively impacted.  Other consequences are depression of metabolic rates in jumbo squid,[7] depression of immune responses of blue mussels,[8] and coral bleaching. On the basis of our present understandings, the potential for environmental and economic risks is high (IPCC AR5: Cooley et al., 2009).  Ocean acidification may also generate genome-wide changes in purple sea urchins. When tested in culture under different CO2 levels, genetic changes occurred in genes for biomineralization, lipid metabolism, and ion homeostasis, gene classes that build skeletons and interact in pH regulation[Ref] . 8
  • 9. Coral rifs  The majority of coral rifs is located in ocean zones where pH values are lowest and thus they suffer the most. The Figure shows changes in decadal mean pH at the sea surface centered around the years 1875 (top) and 1995 (bottom), as modelled with CCSM3. The regional distribution of deep and shallow-water coral reefs is indicated with magenta dots. Coral bleaching 9 From Feely et al 2009 and IPCC AR5
  • 10. Life in the Arctic  Arctic mammals, such as polar bears, seals and walruses depend on sea ice for habitat, feeding and breeding. They are seriously threatened by sea ice decline. 10
  • 11. Biodiversity  Terrestrial biodiversity tends to be highest near the equator,[2] which seems to be the result of the warm climate and high primary productivity (growth of their biomass ).[3] Marine biodiversity tends to be highest along coasts in the Western Pacific, where sea surface temperature is highest and in the mid-latitudinal band in all oceans.[4 Not the climate itself but rapid climate change has been associated in the past with biodiversity loss. At least 5 large and several smaller mass extinctions have occurred during the last 500 million years, but biodiversity over long time periods has steadily expanded despite these massive losses. Only 1%-3% of the species that have existed on Earth still exist today.[12]  At present, biodiversity is declining again but this is already going on from the beginning of the Holocene, more than 10,000 years ago. It is thought to be caused primarily by human impacts, particularly by habitat destruction from human-induced land use change. Thus, biodiversity loss in not an Industial Era event alone, but there are indications that climate change may accelerate loss of biodiversity. However, other factors that are human-related play an even more important role, such as pollution.  From 1950 to 2011, human world population increased from 2.5 billion to >7 billion and is predicted to reach a plateau of more than 9 billion during the 21st century.[162] It has been claimed that the massive growth in the human population through the 20th century has had more impact on biodiversity than any other single factor.[163][164] Whatever the causes, biodiversity loss means loss of ‘ecosystem services’ to humans.  Biodiversity is a broad subject on its own, it is not further dealt with here but read more here 11
  • 12. Human health Many deleterious effects of anthropogenic climate change have been reported, such as:  Heat-related morbidity and mortality The 2003 summer caused ~15,000 deaths in France. Belgium, the Czech Republic, Germany, Italy, Portugal, Spain, Switzerland, the Netherlands, and the UK all reported excess mortality during the same period, with total deaths in the range of 35,000. In France, deaths were massively reported for people aged 75 and over (60%). Heat waves were also reported in 2003 in Andhra Pradesh, India, and caused the deaths of 3,000 people In July 1995, a heat wave killed more than 700 people in the Chicago area alone. Read more here.  Injuries and death from storms and floods  Changes in infectious disease vectors in some areas in Europe (e.g. the tiger mosquito)  Allergenic pollen in the Northern Hemisphere at high and mid-latitudes  Disturbed water and food supply leading to malnutrition 12
  • 13. Exposure and vulnerability  According to the 2011 Global Assessment Report, the average population exposed to flooding every year more than doubled globally between 1970 and 2010, a period in which the world’s population increased by 87 %. The number of people exposed to severe storms almost tripled in cyclone-prone areas in the same period. Read more  Trends in human development along coasts amplify vulnerability, even if climate does not change. For example, in China 100 million people moved from inland to the coast in the last 20 years for reasons of benefits to the national economy, but this population redistribution generated an increased risk from floods and storms. Sea- level rise also adversely affects development in coastal areas, most seriously in developing countries, in part due to their lower adaptive capacity. (IPCC AR5).  Coastal areas already experiencing adverse effects of temperature rise are Coral reefs, Arctic coasts (USA, Canada, Russia) and Antarctic Peninsula  Another example of increased vulnerability is the ‘urban heat island effect’. In cities plants are replaced with road and building surfaces, that trap heat while the cooling by evaporating water of plants disappears.The temperature can be up to 7 °C higher than in the surrounding rural areas. Since more and more people inhabit cities and cities rapidly expand worldwide, global warming will affect an increasing number of people more than average temperature trends indicate. 13
  • 14.  The picture is a satellite thermal infrared photo, taken by LANDSAT 7, of New York City area temperature and vegetation distribution. Notice that in areas with plants, it is considerably cooler. Source 14
  • 15. Unequal geographical distribution of climate disasters 15
  • 16. Economical impacts  Climate change is slowing down world economic output by 1.6 % a year and will lead to a doubling of damage costs in the next two decades. Read more here.  Global loss rose from a few billions in the 1980’ to above 200 billions per year (in 2010 US$). (from IPCC “Managing the Risks of Extreme Events and Disasters to Advance Climate Change Adaptation (SREX)” Economic losses in percentage of Gross Domestic Product (GDP) (2001- 2006) are:  - 0.3% in low-income countries.  - 1% in middle income countries,  - 0.1% in developped countries,  - 1% in Small Island Developing States (up to 8 % in extreme case).  Most of the increase is due to increase in exposure (high confidence), but a role of climate change has not been excluded.  During the exceptionally hot 2003 summer in France some nuclear power reactors had to be temporarily shut down due to lack of cooling water.[Ref] Russia referred an annual crop failure of ~25%, more than 1 million ha of burned areas, and ~$15 billion (~1% GDP) of total economic loss. 16
  • 17. Season creep  Observations indicate earlier arrival of spring-like temperatures and later arrival of winter-like temperatures (season creep), although evidence is not robust enough to distinguish the change from natural variability with high confidence. In Europe, arrival of spring appears to have moved up by approximately one week in a recent 30 year period.[9][10] Studies of plant phenology found advancement in spring in the range of 2– 3 days per decade, and 0.3–1.6 days per decade delay in autumn, over the past 30– 80 years.[11] Studies have suggested that changes in the season-determined synchrony of biological events is disturbed by climate chang, as different species have changed their seasonal timing to different degrees. For example, woodland birds feed moth larvae to their young and produce the greatest number of chicks when caterpillar number peaks. In warm years caterpillar are now most numerous before the nestlings have hatched, which can result in starvation and decrease in population size. A large phenological examination on 542 plant species in 21 European countries from 1971– 2000 showed that 78% of all leafing, flowering, and fruiting records advanced while only 3% were significantly delayed.[10][30] However, more needs to be studied before the overall impact of seasonal change on ecosystems can be estimated with high confidence. Efforts are now being made to gather more data and implement them in models[Ref]. 17
  • 18. View other slide shows on climate change and biosphere 18