SlideShare a Scribd company logo
Energy production & consumption
Data collection and presentation by Carl Denef
Energy is the physical entity indispensable for performing work. It comes in
different forms: mechanical, kinetic, thermal, radiative, electric, magnetic,
chemical, nuclear, gravitational and others. Energy can be transformed to different
forms at various efficiencies. An energy source can also be called a fuel.
All natural energy on earth comes from the radiative energy of the sun, heat in the
earth’s mantle (geothermal energy), and gravity.
About 0.01% of solar energy is converted to plants. Over millions of years residues
of living matter have been transformed under the soil and the sea to fossil
hydrocarbon energy in the form of coal, oil and natural gas. These energy
sources are limited and not renewable. Potential energy in it is transformed to
usable power by burning. The rest products are greenhouse gasses, causing global
warming and climate change.
Energy can also be converted directly from solar radiation, gravity, the Earth crust
and living plants by human technology (wind, solar, hydroelectric, geothermal
and biomass power). These energy forms are renewable.
In addition, the Earth crust contains uranium and thorium isotopes, that release
high amounts of heat energy upon nuclear fission.
Human-made hydrogen can also become a sustainable source of energy in the
future.
© picture: WWF-Canon / Edward Parker
2
2
© picture: WWF-Canon / Edward Parker
One of the units of measurement of energy is the Joule (J). It is a measure of the capacity
or power to generate work, such as locomotive work in a combustion motor of a car, light
generation by electric power, electricity generation in a turbine by wind power etc.
Another unit, called Watt (W), is the power which in one second of time gives rise to 1
joule of energy
1 W = 1 J/sec
1 kilowatt (kW) = 1000 J/sec
1 megawatt (MW) = 106 J/sec
1 gigawatt (GW) = 109 J/sec
1 terawatt (TW) = 1012 J/sec
Amounts of energy can also be expressed in terms of its flow over time during power
conversion, with as unit the Watt.sec
1 W.sec = 1 J
1 kW.hour (kWh) is the energy flow with a power of 1 kW sustained during 1 hour
1 kWh = 1000 x 3600 = 3.6 x 10⁶ J = 3.6 MJ
1 kWyear (1kWy) = 1000 x 3600 x 24 x 365 = 31 536 000 000 J
or 1 J = 31.71 x 10⁻¹² kWy = 31.71 x 10⁻²¹ TWy
In the slides that follow energy capacity is usually expressed in GWy or TWy, shortened in
the figures as GW and TW. In some slides energy consumption is expressed in kWh, MWh
or TWh
3
3
Fuel
kWh per
kilogram*
Deuterium–tritium 92 400 000
Uranium-235 23 279 200[3]
Hydrogen (compressed
at 70 MPa)
34
Natural gas 15.5
Gasoline (petrol) /
Diesel
~13
Propane (including LPG) 13
Biodiesel 12
Ethanol 8.4
Coal 6.7
Wood 5
Car battery (lead-acid) 0.7
Li-ion battery 0.24
Alkaline battery 0.67
Nickel-metal hydride
battery
0.288
106
Fuel kWh per m3
Liquid hydrogen 2389
Hydrogen, at 690
bar and 15°C
1260
Hydrogen, gas[ 2.8
Natural gas 10.2
Gasoline (petrol) /
Diesel 9600
Electricity generation Efficiency
Gas turbine up to 40%
Gas turbine plus steam turbine
(combined cycle)
up to 60%
Hydropower turbine up to 90%
Wind turbine up to 59% (theoretical limit)
Solar cell 6–40% (technology dependent)
Hydrogen Fuel cell up to 85%
Geothermal power 10–23%
Engine/Motor
Combustion engine 10–50%[2]
Electric motors
70–99.99% (above 200W);
50–90% (between 10–200W);
Electrolysis of water 50–70%
Appliances
Incandescent light bulb 0.7–5 %
Electric heater 100 %
Natural process
Photosynthesis up to 6% [3]
Muscle 14–27%
Energy conversion efficiency is
the ratio between the useful
output of an energy conversion
machine and the input, in
energy terms. The useful
output may be electric power,
mechanical work, or heat.
103
• Energy returned on energy invested (EROEI); or
energy return on investment (EROI), is the ratio of
the amount of usable energy acquired from a
particular energy resource to the amount of energy
expended to obtain that energy. Determining the
EROEI is often complex, resulting in wide variations in
the data. In the asesment the whole life cycle should
be envisaged.
• The more difficult to extract energy from a source, the
more energy is to be invested to extract it, lowering
the EROEI and increasing the price. For example, when
oil was originally discovered, it took on average one
barrel of oil to find, extract, and process about 100
barrels of oil. That ratio has declined steadily over the
last century to about three barrels gained for one
barrel used up in the U.S.
• If an energy source can flow to different tracks, its
EROEI will increase. For example in Europe rapeseed is
used to produce biodiesel. The EROEI is around 1.5
but a side product, pure plant oil, is used as a protein-
rich animal food, with an EROEI of 16.
105
Energy source ERoEI[1]
Crude oil (per
2007)
10
Oil sands (per
2007)
2 - 4
Natural gas 5 – 10
Coal 1 – 10
Nuclear 2,7 - 4
Hydroelectric 10
Wind 3 – 10
Solar panels 1 – 10
Biofuels
Soy biodiedel 5.5
Sugar cane ethanol 4 - 8
Rapeseed biodiesel 1,5
Corn ethanol 0,8 - 1,5
Maize ethanol 1,1
Biomass 0,8
Hydrogen 0,5
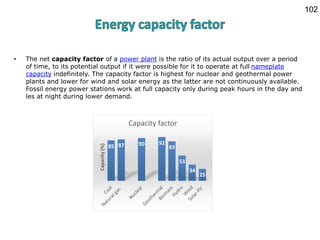
• The net capacity factor of a power plant is the ratio of its actual output over a period
of time, to its potential output if it were possible for it to operate at full nameplate
capacity indefinitely. The capacity factor is highest for nuclear and geothermal power
plants and lower for wind and solar energy as the latter are not continuously available.
Fossil energy power stations work at full capacity only during peak hours in the day and
les at night during lower demand.
102
85 87 90 92
83
53
34
25
Capacity(%)
Capacity factor
The figure shows the huge differences between energy types, solar and wind facilities
occupying much smaller land area than bio- and fossil fuel facilities. Both low and high
estimates (depending on the study) are given.
3 9 16
1000
900
0
200
400
600
800
1000
1200
Globalhectares/MW
Low
High
110
Total
• Total use in billion m3 (bcm)(in 2010 and prospected). Water withdrawal is water that is
taken from the natural environment and after use redistributed in nature, for example to
feed an electric turbine in the form of steam, to cool the reactor in a nuclear power plant
or to irrigate biomass crop land. Often that water is warm and polluted. Consumption is
water that is consumed during energy production, for example water taken up by
biomass crops.
From IEA
111
Per energy unit
• Withdrawal and consumption of water in gallons (Gal) per MWh (1
gallon=3.8 liter)
112
Total and by energy type
• World total energy consumption in 2010 was 17.8 terrawatt (TW). Most
is extracted from conventional fossil (coal, oil, natural gas) and nuclear
(uranium) reserves. Renewable energy (wind, solar, hydroelectric,
geothermal and biomass) is growing rapidly in recent years, now reaching
12 % of the world total energy consumption, which is more than double of
nuclear energy consumption (5.3 %).
4.9
5.9
3.9
0.95
2.17
0
1
2
3
4
5
6
7
TW
World energy consumption 2010
coal
28%
oil
33%
gas
22%
nuclear
5%
renewable
12%
4
Consumption by energy type and country
5
Coal
19%
Oil
35%
Gas
24%
Nuclear
14%
Renew
ables
8%
EU
Coal
21%
Oil
37%
Gas
25%
Nuclear
9%
Renew
ables
8%
USA 2010 (EIA)
Coal
23%
Oil
43%
Gas
18%
Nuclear
13%
Renew
ables
4%
Japan 2010 (EIA)
Coal
70%
Oil
19%
Gas
4%
Nuclear
1%
Hydro
electric
6%
China 2009 (EIA)
Coal
41%
Oil
23%
Gas
8%
Nuclear
5%
Waste
&
Renew
ables
28%
India 2011 (EIA)
Oil
13% Gas
4%
Hydro
electric
1%
Tradi-
tional
biomass
& waste
82%
Nigeria 2010 (EIA)
Coal
2%
Oil
47%
Gas
28%
Hydro
electric
23%
Venezuela 2010 (EIA)
Coal
3%
Oil &
bioethanol
39%
Gas
7%
Nuclear
1%
Hydro
electric
29%
Biomass
21%
Brazil 2010 (EIA)
• Energy consumption per capita is highly variable in different areas of the world,
developing countries consuming much less. Values range between 0.2 kW/person
(Eritrea) and 22 kW/person (Iceland) sustained for 1 year. In Belgium it is 7.4 kW,
ranking 7th highest.
• There are also striking differences between cities in the same country, for example in
electricity consumption in U.S. cities.
6
Per capita electricity use in kWh/capita
• The striking differences between developed and developing countries is also reflected
in the number of people (> 1.6 billion) without access to electricity in 2002
and predicted to have only slightly improved in 2030. This is due in part to the strong
population growth in this part of the world. It clearly shows that dealing with energy
issues cannot be disconnected from the inequality problem between people.
7
In India 2009
• Energy consumption grew spectacularly, both in total and per capita, since the industrial
revolution, as a consequence of the population explosion (click here to see population
growth animation) and of human scientific and technical development. Since then we have
already consumed about 800 TW of fossil energy. Fossil fuels are still dominant in the global
energy mix, supported by $ 523 billion subsidies in 2011, up almost 30% in 2010 and six
times more than subsidies to the renewable energy sector[4 ., an alarming situation,
considering that the fact that fossil energy combustion is the cause of global warming and
climate change .
8
• The dominant energy source changed over time from wood to coal to oil.
At present there is a transition in motion to a renewable energy age,
named by Greenpeace the ‘Energy Revolution’.
9
(1 Quad.Btu (british thermal units) = 33.45 × 10
- 3 TW)
• Energy supplies are used for >50 % in industry, for > 25 % in
transportation, and for 22 % in residential and commercial facilities. The
type of energy differs widely among these sectors. Oil is used for 96 % in
transportation, while coal and nuclear energy feed electricity generation.
10
Industry
52%
Transpo
rtation
26%
Residen
tial
14%
Commer
cial
8%
World 2012 (EIA)
0
20
40
60
80
100
120
Percent
Sector energy consumption by energy type
Coal
Oil
Gas
Nuclear
Renewable
World total electricity
production = 2.3 TW
(~20 000 TWh)
• Energy type used by sector differs widely among countries
Industry
77%
Transportati
on…
Residenti
al 11%
Commerc
ial 4%
China 2009 (EIA)
Industry
31%
Transpor
tation
28%
Residenti
al
22%
Commercia
l…
U.S. 2008
10b
113
The table underneath shows the number of people killed by electricity generation systems
worldwide per year, as collated by the IEA from different studies (lowest and highest numbers
are given). Coal is responsible for a much higher number of deaths than other energy
sources, while nuclear fatalities are lowest. In the Chernobyl disaster there were 56 direct
deaths and 4000 people died from cancer. Recent estimates on the hazards caused by the
Fukushima nuclear accident predict a total of 130 cancer deaths over lifespan.[22] Some 230
000 people were killed in a dam failure of a hydroelectric power station in China in 1975.
However, it is astonishing to note that the number of people killed in road accidents
worldwide was 1,230,000[2] in 2007.
It is even more astonishing that the annual death toll due to fossil energy-related
climate change is 400 000 and that this will increase to 700 000 by 2030 if a drastic
change in our fossil energy economy is not implemented.
Average number of people killed/year due to
electricity generation
Low estimates High estimates
Coal 2296 26814
Hydroelectric 320 512
Natural gas 126 672
Nuclear 52 312

More Related Content

What's hot

Renewable energy Sources, Efficiency, Uses and latest Research
Renewable energy Sources, Efficiency, Uses and latest Research Renewable energy Sources, Efficiency, Uses and latest Research
Renewable energy Sources, Efficiency, Uses and latest Research
Zohaib HUSSAIN
 
Presentation renewable energy resources
Presentation renewable energy resourcesPresentation renewable energy resources
Presentation renewable energy resources
Hemant yadav
 
Conventional sources of energy
Conventional sources of energyConventional sources of energy
Conventional sources of energy
Snehal Bhargava
 
Renewable sources of energy
Renewable sources of energyRenewable sources of energy
Renewable sources of energy
ajay jakhar
 
Energy resources
Energy resources Energy resources
Energy resources
Priti Thakkar
 
Non renewable-energy
Non renewable-energyNon renewable-energy
Non renewable-energy
Akhil Lal
 
Geothermal energy
Geothermal energyGeothermal energy
Geothermal energy
Umashankar Mali
 
Main Form of Renewable Energy Resources
Main Form of Renewable Energy ResourcesMain Form of Renewable Energy Resources
Main Form of Renewable Energy Resources
David Stoffel
 
Wave Energy
Wave Energy Wave Energy
Wave Energy
esatoglu
 
Introduction to Energy sources
Introduction to Energy sources Introduction to Energy sources
Introduction to Energy sources
Ambika Thakur
 
Geothermal Power
Geothermal PowerGeothermal Power
Geothermal Power
Seminar Links
 
Sources of energy
Sources of energySources of energy
Sources of energy
Robin Dabur
 
Sources of Energy
Sources of EnergySources of Energy
Sources of Energyitutor
 
Geothermal energy
Geothermal energyGeothermal energy
Geothermal energy
Ashwith bs
 
Nuclear Energy
Nuclear Energy Nuclear Energy
Nuclear Energy
Omkar Rane
 
Energy conservation
Energy conservationEnergy conservation
Energy conservation
SAMEER VISHWAKARMA
 
Renewable energy & its furure prospects in india
Renewable energy & its furure prospects in indiaRenewable energy & its furure prospects in india
Renewable energy & its furure prospects in indiaSurabhi Pal
 
wave power & wave energy
wave power & wave energywave power & wave energy
wave power & wave energy
saqibsaqi123
 
Energy conservation ppt
Energy conservation ppt  Energy conservation ppt
Energy conservation ppt
Dixit Sethi
 
Renewable source-of-energy
Renewable source-of-energyRenewable source-of-energy
Renewable source-of-energy
H Janardan Prabhu
 

What's hot (20)

Renewable energy Sources, Efficiency, Uses and latest Research
Renewable energy Sources, Efficiency, Uses and latest Research Renewable energy Sources, Efficiency, Uses and latest Research
Renewable energy Sources, Efficiency, Uses and latest Research
 
Presentation renewable energy resources
Presentation renewable energy resourcesPresentation renewable energy resources
Presentation renewable energy resources
 
Conventional sources of energy
Conventional sources of energyConventional sources of energy
Conventional sources of energy
 
Renewable sources of energy
Renewable sources of energyRenewable sources of energy
Renewable sources of energy
 
Energy resources
Energy resources Energy resources
Energy resources
 
Non renewable-energy
Non renewable-energyNon renewable-energy
Non renewable-energy
 
Geothermal energy
Geothermal energyGeothermal energy
Geothermal energy
 
Main Form of Renewable Energy Resources
Main Form of Renewable Energy ResourcesMain Form of Renewable Energy Resources
Main Form of Renewable Energy Resources
 
Wave Energy
Wave Energy Wave Energy
Wave Energy
 
Introduction to Energy sources
Introduction to Energy sources Introduction to Energy sources
Introduction to Energy sources
 
Geothermal Power
Geothermal PowerGeothermal Power
Geothermal Power
 
Sources of energy
Sources of energySources of energy
Sources of energy
 
Sources of Energy
Sources of EnergySources of Energy
Sources of Energy
 
Geothermal energy
Geothermal energyGeothermal energy
Geothermal energy
 
Nuclear Energy
Nuclear Energy Nuclear Energy
Nuclear Energy
 
Energy conservation
Energy conservationEnergy conservation
Energy conservation
 
Renewable energy & its furure prospects in india
Renewable energy & its furure prospects in indiaRenewable energy & its furure prospects in india
Renewable energy & its furure prospects in india
 
wave power & wave energy
wave power & wave energywave power & wave energy
wave power & wave energy
 
Energy conservation ppt
Energy conservation ppt  Energy conservation ppt
Energy conservation ppt
 
Renewable source-of-energy
Renewable source-of-energyRenewable source-of-energy
Renewable source-of-energy
 

Similar to Energy production & consumption

Non conventional energy resources
Non conventional energy resourcesNon conventional energy resources
Non conventional energy resources
Ayush Chandra
 
N.E.G Micon
N.E.G MiconN.E.G Micon
N.E.G MiconPixel
 
The Sustainable Energy Challenge
The Sustainable Energy ChallengeThe Sustainable Energy Challenge
The Sustainable Energy Challenge
Toni Menninger
 
FINAL SUBMITTED PAPER-TRENDS IN RENEWABLE ENERGY RESOURES AND THEIR APPLICATIONS
FINAL SUBMITTED PAPER-TRENDS IN RENEWABLE ENERGY RESOURES AND THEIR APPLICATIONSFINAL SUBMITTED PAPER-TRENDS IN RENEWABLE ENERGY RESOURES AND THEIR APPLICATIONS
FINAL SUBMITTED PAPER-TRENDS IN RENEWABLE ENERGY RESOURES AND THEIR APPLICATIONSNavneet Agarwal
 
Energy Resources
Energy ResourcesEnergy Resources
Energy Resources
Nisarg Amin
 
VERTICAL AXIS WIND TURBINE
VERTICAL AXIS WIND TURBINEVERTICAL AXIS WIND TURBINE
VERTICAL AXIS WIND TURBINE
Suchit Moon
 
renewable energy and livestock for bioenergy
renewable energy and livestock for bioenergy renewable energy and livestock for bioenergy
renewable energy and livestock for bioenergy ๋JIRAPHORN LUBSUNGNOEN
 
Climate change and mitigation
Climate change and mitigationClimate change and mitigation
Climate change and mitigation
Dr. Heera Lal IAS
 
a seminar report on geothermal energy
a seminar report on geothermal energya seminar report on geothermal energy
a seminar report on geothermal energyanil kumar
 
Renewable Energy Report
Renewable Energy ReportRenewable Energy Report
Renewable Energy ReportArchie Cable
 
1. OVERVIEW OF RENEWABLE ENERGY SOURCES.ppt
1. OVERVIEW OF RENEWABLE ENERGY SOURCES.ppt1. OVERVIEW OF RENEWABLE ENERGY SOURCES.ppt
1. OVERVIEW OF RENEWABLE ENERGY SOURCES.ppt
Akash486765
 
Energy Efficiency Implementation in Japan
Energy Efficiency Implementation  in JapanEnergy Efficiency Implementation  in Japan
Energy Efficiency Implementation in Japan
ZAINI ABDUL WAHAB
 
OCH 752 ENERGY TECHNOLOGY - Unit 1
OCH 752   ENERGY TECHNOLOGY - Unit 1OCH 752   ENERGY TECHNOLOGY - Unit 1
OCH 752 ENERGY TECHNOLOGY - Unit 1
Dr. Pradeep Kumar A R
 
ECEg - 4242 - Chapter - two.pdf
ECEg - 4242 - Chapter - two.pdfECEg - 4242 - Chapter - two.pdf
ECEg - 4242 - Chapter - two.pdf
salemMola
 
Climate change and mitigation measures for sustainability.
Climate change and mitigation measures  for sustainability.Climate change and mitigation measures  for sustainability.
Climate change and mitigation measures for sustainability.
ReenaRanaGCET
 
power generation
power generationpower generation
power generation
Abdullah A.Shehata
 
Energy resources
Energy resourcesEnergy resources
Energy resources
ajay_483
 
Energy conservation
Energy conservationEnergy conservation
Energy conservation
bhavana kanisetty
 
World energy outlook 2015 presentation
World energy outlook 2015 presentationWorld energy outlook 2015 presentation
World energy outlook 2015 presentation
omerfarukgurses
 

Similar to Energy production & consumption (20)

Non conventional energy resources
Non conventional energy resourcesNon conventional energy resources
Non conventional energy resources
 
N.E.G Micon
N.E.G MiconN.E.G Micon
N.E.G Micon
 
The Sustainable Energy Challenge
The Sustainable Energy ChallengeThe Sustainable Energy Challenge
The Sustainable Energy Challenge
 
FINAL SUBMITTED PAPER-TRENDS IN RENEWABLE ENERGY RESOURES AND THEIR APPLICATIONS
FINAL SUBMITTED PAPER-TRENDS IN RENEWABLE ENERGY RESOURES AND THEIR APPLICATIONSFINAL SUBMITTED PAPER-TRENDS IN RENEWABLE ENERGY RESOURES AND THEIR APPLICATIONS
FINAL SUBMITTED PAPER-TRENDS IN RENEWABLE ENERGY RESOURES AND THEIR APPLICATIONS
 
Energy Resources
Energy ResourcesEnergy Resources
Energy Resources
 
VERTICAL AXIS WIND TURBINE
VERTICAL AXIS WIND TURBINEVERTICAL AXIS WIND TURBINE
VERTICAL AXIS WIND TURBINE
 
renewable energy and livestock for bioenergy
renewable energy and livestock for bioenergy renewable energy and livestock for bioenergy
renewable energy and livestock for bioenergy
 
Climate change and mitigation
Climate change and mitigationClimate change and mitigation
Climate change and mitigation
 
a seminar report on geothermal energy
a seminar report on geothermal energya seminar report on geothermal energy
a seminar report on geothermal energy
 
Renewable Energy Report
Renewable Energy ReportRenewable Energy Report
Renewable Energy Report
 
1. OVERVIEW OF RENEWABLE ENERGY SOURCES.ppt
1. OVERVIEW OF RENEWABLE ENERGY SOURCES.ppt1. OVERVIEW OF RENEWABLE ENERGY SOURCES.ppt
1. OVERVIEW OF RENEWABLE ENERGY SOURCES.ppt
 
Energy Efficiency Implementation in Japan
Energy Efficiency Implementation  in JapanEnergy Efficiency Implementation  in Japan
Energy Efficiency Implementation in Japan
 
A World of Energy
A World of EnergyA World of Energy
A World of Energy
 
OCH 752 ENERGY TECHNOLOGY - Unit 1
OCH 752   ENERGY TECHNOLOGY - Unit 1OCH 752   ENERGY TECHNOLOGY - Unit 1
OCH 752 ENERGY TECHNOLOGY - Unit 1
 
ECEg - 4242 - Chapter - two.pdf
ECEg - 4242 - Chapter - two.pdfECEg - 4242 - Chapter - two.pdf
ECEg - 4242 - Chapter - two.pdf
 
Climate change and mitigation measures for sustainability.
Climate change and mitigation measures  for sustainability.Climate change and mitigation measures  for sustainability.
Climate change and mitigation measures for sustainability.
 
power generation
power generationpower generation
power generation
 
Energy resources
Energy resourcesEnergy resources
Energy resources
 
Energy conservation
Energy conservationEnergy conservation
Energy conservation
 
World energy outlook 2015 presentation
World energy outlook 2015 presentationWorld energy outlook 2015 presentation
World energy outlook 2015 presentation
 

More from cdenef

Renewable energy
Renewable energyRenewable energy
Renewable energy
cdenef
 
climate change in the past: Palaeoclimate
climate change in the past: Palaeoclimateclimate change in the past: Palaeoclimate
climate change in the past: Palaeoclimate
cdenef
 
Nuclear energy
Nuclear energyNuclear energy
Nuclear energy
cdenef
 
Fossil energy
Fossil energyFossil energy
Fossil energy
cdenef
 
Fixing climate change
Fixing climate changeFixing climate change
Fixing climate change
cdenef
 
Climate change: Extreme weather events
Climate change: Extreme weather eventsClimate change: Extreme weather events
Climate change: Extreme weather events
cdenef
 
Energy costs
Energy costsEnergy costs
Energy costs
cdenef
 
Climate change prediction
Climate change predictionClimate change prediction
Climate change prediction
cdenef
 
Climate change: changes in the cryosphere
Climate change: changes in the cryosphereClimate change: changes in the cryosphere
Climate change: changes in the cryosphere
cdenef
 
Climate change: Changes in the hydrosphere
Climate change: Changes in the hydrosphereClimate change: Changes in the hydrosphere
Climate change: Changes in the hydrosphere
cdenef
 
Climate change: Changes in the biosphere
Climate change: Changes in the biosphereClimate change: Changes in the biosphere
Climate change: Changes in the biosphere
cdenef
 
Climate change: Changes in the atmosphere
Climate change: Changes in the atmosphereClimate change: Changes in the atmosphere
Climate change: Changes in the atmospherecdenef
 
Changes in the atmosphere
Changes in the atmosphereChanges in the atmosphere
Changes in the atmospherecdenef
 
Key concepts in Climate Science
Key concepts in Climate  ScienceKey concepts in Climate  Science
Key concepts in Climate Sciencecdenef
 
Climate change summary and conclusions
Climate change summary and conclusionsClimate change summary and conclusions
Climate change summary and conclusionscdenef
 
Energy in everyday life
Energy in everyday lifeEnergy in everyday life
Energy in everyday life
cdenef
 

More from cdenef (16)

Renewable energy
Renewable energyRenewable energy
Renewable energy
 
climate change in the past: Palaeoclimate
climate change in the past: Palaeoclimateclimate change in the past: Palaeoclimate
climate change in the past: Palaeoclimate
 
Nuclear energy
Nuclear energyNuclear energy
Nuclear energy
 
Fossil energy
Fossil energyFossil energy
Fossil energy
 
Fixing climate change
Fixing climate changeFixing climate change
Fixing climate change
 
Climate change: Extreme weather events
Climate change: Extreme weather eventsClimate change: Extreme weather events
Climate change: Extreme weather events
 
Energy costs
Energy costsEnergy costs
Energy costs
 
Climate change prediction
Climate change predictionClimate change prediction
Climate change prediction
 
Climate change: changes in the cryosphere
Climate change: changes in the cryosphereClimate change: changes in the cryosphere
Climate change: changes in the cryosphere
 
Climate change: Changes in the hydrosphere
Climate change: Changes in the hydrosphereClimate change: Changes in the hydrosphere
Climate change: Changes in the hydrosphere
 
Climate change: Changes in the biosphere
Climate change: Changes in the biosphereClimate change: Changes in the biosphere
Climate change: Changes in the biosphere
 
Climate change: Changes in the atmosphere
Climate change: Changes in the atmosphereClimate change: Changes in the atmosphere
Climate change: Changes in the atmosphere
 
Changes in the atmosphere
Changes in the atmosphereChanges in the atmosphere
Changes in the atmosphere
 
Key concepts in Climate Science
Key concepts in Climate  ScienceKey concepts in Climate  Science
Key concepts in Climate Science
 
Climate change summary and conclusions
Climate change summary and conclusionsClimate change summary and conclusions
Climate change summary and conclusions
 
Energy in everyday life
Energy in everyday lifeEnergy in everyday life
Energy in everyday life
 

Recently uploaded

Language Across the Curriculm LAC B.Ed.
Language Across the  Curriculm LAC B.Ed.Language Across the  Curriculm LAC B.Ed.
Language Across the Curriculm LAC B.Ed.
Atul Kumar Singh
 
Unit 8 - Information and Communication Technology (Paper I).pdf
Unit 8 - Information and Communication Technology (Paper I).pdfUnit 8 - Information and Communication Technology (Paper I).pdf
Unit 8 - Information and Communication Technology (Paper I).pdf
Thiyagu K
 
Adversarial Attention Modeling for Multi-dimensional Emotion Regression.pdf
Adversarial Attention Modeling for Multi-dimensional Emotion Regression.pdfAdversarial Attention Modeling for Multi-dimensional Emotion Regression.pdf
Adversarial Attention Modeling for Multi-dimensional Emotion Regression.pdf
Po-Chuan Chen
 
TESDA TM1 REVIEWER FOR NATIONAL ASSESSMENT WRITTEN AND ORAL QUESTIONS WITH A...
TESDA TM1 REVIEWER  FOR NATIONAL ASSESSMENT WRITTEN AND ORAL QUESTIONS WITH A...TESDA TM1 REVIEWER  FOR NATIONAL ASSESSMENT WRITTEN AND ORAL QUESTIONS WITH A...
TESDA TM1 REVIEWER FOR NATIONAL ASSESSMENT WRITTEN AND ORAL QUESTIONS WITH A...
EugeneSaldivar
 
June 3, 2024 Anti-Semitism Letter Sent to MIT President Kornbluth and MIT Cor...
June 3, 2024 Anti-Semitism Letter Sent to MIT President Kornbluth and MIT Cor...June 3, 2024 Anti-Semitism Letter Sent to MIT President Kornbluth and MIT Cor...
June 3, 2024 Anti-Semitism Letter Sent to MIT President Kornbluth and MIT Cor...
Levi Shapiro
 
Phrasal Verbs.XXXXXXXXXXXXXXXXXXXXXXXXXX
Phrasal Verbs.XXXXXXXXXXXXXXXXXXXXXXXXXXPhrasal Verbs.XXXXXXXXXXXXXXXXXXXXXXXXXX
Phrasal Verbs.XXXXXXXXXXXXXXXXXXXXXXXXXX
MIRIAMSALINAS13
 
2024.06.01 Introducing a competency framework for languag learning materials ...
2024.06.01 Introducing a competency framework for languag learning materials ...2024.06.01 Introducing a competency framework for languag learning materials ...
2024.06.01 Introducing a competency framework for languag learning materials ...
Sandy Millin
 
Lapbook sobre os Regimes Totalitários.pdf
Lapbook sobre os Regimes Totalitários.pdfLapbook sobre os Regimes Totalitários.pdf
Lapbook sobre os Regimes Totalitários.pdf
Jean Carlos Nunes Paixão
 
How to Make a Field invisible in Odoo 17
How to Make a Field invisible in Odoo 17How to Make a Field invisible in Odoo 17
How to Make a Field invisible in Odoo 17
Celine George
 
Thesis Statement for students diagnonsed withADHD.ppt
Thesis Statement for students diagnonsed withADHD.pptThesis Statement for students diagnonsed withADHD.ppt
Thesis Statement for students diagnonsed withADHD.ppt
EverAndrsGuerraGuerr
 
Supporting (UKRI) OA monographs at Salford.pptx
Supporting (UKRI) OA monographs at Salford.pptxSupporting (UKRI) OA monographs at Salford.pptx
Supporting (UKRI) OA monographs at Salford.pptx
Jisc
 
1.4 modern child centered education - mahatma gandhi-2.pptx
1.4 modern child centered education - mahatma gandhi-2.pptx1.4 modern child centered education - mahatma gandhi-2.pptx
1.4 modern child centered education - mahatma gandhi-2.pptx
JosvitaDsouza2
 
CACJapan - GROUP Presentation 1- Wk 4.pdf
CACJapan - GROUP Presentation 1- Wk 4.pdfCACJapan - GROUP Presentation 1- Wk 4.pdf
CACJapan - GROUP Presentation 1- Wk 4.pdf
camakaiclarkmusic
 
Introduction to AI for Nonprofits with Tapp Network
Introduction to AI for Nonprofits with Tapp NetworkIntroduction to AI for Nonprofits with Tapp Network
Introduction to AI for Nonprofits with Tapp Network
TechSoup
 
Digital Tools and AI for Teaching Learning and Research
Digital Tools and AI for Teaching Learning and ResearchDigital Tools and AI for Teaching Learning and Research
Digital Tools and AI for Teaching Learning and Research
Vikramjit Singh
 
Home assignment II on Spectroscopy 2024 Answers.pdf
Home assignment II on Spectroscopy 2024 Answers.pdfHome assignment II on Spectroscopy 2024 Answers.pdf
Home assignment II on Spectroscopy 2024 Answers.pdf
Tamralipta Mahavidyalaya
 
CLASS 11 CBSE B.St Project AIDS TO TRADE - INSURANCE
CLASS 11 CBSE B.St Project AIDS TO TRADE - INSURANCECLASS 11 CBSE B.St Project AIDS TO TRADE - INSURANCE
CLASS 11 CBSE B.St Project AIDS TO TRADE - INSURANCE
BhavyaRajput3
 
Synthetic Fiber Construction in lab .pptx
Synthetic Fiber Construction in lab .pptxSynthetic Fiber Construction in lab .pptx
Synthetic Fiber Construction in lab .pptx
Pavel ( NSTU)
 
Operation Blue Star - Saka Neela Tara
Operation Blue Star   -  Saka Neela TaraOperation Blue Star   -  Saka Neela Tara
Operation Blue Star - Saka Neela Tara
Balvir Singh
 
The Challenger.pdf DNHS Official Publication
The Challenger.pdf DNHS Official PublicationThe Challenger.pdf DNHS Official Publication
The Challenger.pdf DNHS Official Publication
Delapenabediema
 

Recently uploaded (20)

Language Across the Curriculm LAC B.Ed.
Language Across the  Curriculm LAC B.Ed.Language Across the  Curriculm LAC B.Ed.
Language Across the Curriculm LAC B.Ed.
 
Unit 8 - Information and Communication Technology (Paper I).pdf
Unit 8 - Information and Communication Technology (Paper I).pdfUnit 8 - Information and Communication Technology (Paper I).pdf
Unit 8 - Information and Communication Technology (Paper I).pdf
 
Adversarial Attention Modeling for Multi-dimensional Emotion Regression.pdf
Adversarial Attention Modeling for Multi-dimensional Emotion Regression.pdfAdversarial Attention Modeling for Multi-dimensional Emotion Regression.pdf
Adversarial Attention Modeling for Multi-dimensional Emotion Regression.pdf
 
TESDA TM1 REVIEWER FOR NATIONAL ASSESSMENT WRITTEN AND ORAL QUESTIONS WITH A...
TESDA TM1 REVIEWER  FOR NATIONAL ASSESSMENT WRITTEN AND ORAL QUESTIONS WITH A...TESDA TM1 REVIEWER  FOR NATIONAL ASSESSMENT WRITTEN AND ORAL QUESTIONS WITH A...
TESDA TM1 REVIEWER FOR NATIONAL ASSESSMENT WRITTEN AND ORAL QUESTIONS WITH A...
 
June 3, 2024 Anti-Semitism Letter Sent to MIT President Kornbluth and MIT Cor...
June 3, 2024 Anti-Semitism Letter Sent to MIT President Kornbluth and MIT Cor...June 3, 2024 Anti-Semitism Letter Sent to MIT President Kornbluth and MIT Cor...
June 3, 2024 Anti-Semitism Letter Sent to MIT President Kornbluth and MIT Cor...
 
Phrasal Verbs.XXXXXXXXXXXXXXXXXXXXXXXXXX
Phrasal Verbs.XXXXXXXXXXXXXXXXXXXXXXXXXXPhrasal Verbs.XXXXXXXXXXXXXXXXXXXXXXXXXX
Phrasal Verbs.XXXXXXXXXXXXXXXXXXXXXXXXXX
 
2024.06.01 Introducing a competency framework for languag learning materials ...
2024.06.01 Introducing a competency framework for languag learning materials ...2024.06.01 Introducing a competency framework for languag learning materials ...
2024.06.01 Introducing a competency framework for languag learning materials ...
 
Lapbook sobre os Regimes Totalitários.pdf
Lapbook sobre os Regimes Totalitários.pdfLapbook sobre os Regimes Totalitários.pdf
Lapbook sobre os Regimes Totalitários.pdf
 
How to Make a Field invisible in Odoo 17
How to Make a Field invisible in Odoo 17How to Make a Field invisible in Odoo 17
How to Make a Field invisible in Odoo 17
 
Thesis Statement for students diagnonsed withADHD.ppt
Thesis Statement for students diagnonsed withADHD.pptThesis Statement for students diagnonsed withADHD.ppt
Thesis Statement for students diagnonsed withADHD.ppt
 
Supporting (UKRI) OA monographs at Salford.pptx
Supporting (UKRI) OA monographs at Salford.pptxSupporting (UKRI) OA monographs at Salford.pptx
Supporting (UKRI) OA monographs at Salford.pptx
 
1.4 modern child centered education - mahatma gandhi-2.pptx
1.4 modern child centered education - mahatma gandhi-2.pptx1.4 modern child centered education - mahatma gandhi-2.pptx
1.4 modern child centered education - mahatma gandhi-2.pptx
 
CACJapan - GROUP Presentation 1- Wk 4.pdf
CACJapan - GROUP Presentation 1- Wk 4.pdfCACJapan - GROUP Presentation 1- Wk 4.pdf
CACJapan - GROUP Presentation 1- Wk 4.pdf
 
Introduction to AI for Nonprofits with Tapp Network
Introduction to AI for Nonprofits with Tapp NetworkIntroduction to AI for Nonprofits with Tapp Network
Introduction to AI for Nonprofits with Tapp Network
 
Digital Tools and AI for Teaching Learning and Research
Digital Tools and AI for Teaching Learning and ResearchDigital Tools and AI for Teaching Learning and Research
Digital Tools and AI for Teaching Learning and Research
 
Home assignment II on Spectroscopy 2024 Answers.pdf
Home assignment II on Spectroscopy 2024 Answers.pdfHome assignment II on Spectroscopy 2024 Answers.pdf
Home assignment II on Spectroscopy 2024 Answers.pdf
 
CLASS 11 CBSE B.St Project AIDS TO TRADE - INSURANCE
CLASS 11 CBSE B.St Project AIDS TO TRADE - INSURANCECLASS 11 CBSE B.St Project AIDS TO TRADE - INSURANCE
CLASS 11 CBSE B.St Project AIDS TO TRADE - INSURANCE
 
Synthetic Fiber Construction in lab .pptx
Synthetic Fiber Construction in lab .pptxSynthetic Fiber Construction in lab .pptx
Synthetic Fiber Construction in lab .pptx
 
Operation Blue Star - Saka Neela Tara
Operation Blue Star   -  Saka Neela TaraOperation Blue Star   -  Saka Neela Tara
Operation Blue Star - Saka Neela Tara
 
The Challenger.pdf DNHS Official Publication
The Challenger.pdf DNHS Official PublicationThe Challenger.pdf DNHS Official Publication
The Challenger.pdf DNHS Official Publication
 

Energy production & consumption

  • 1. Energy production & consumption Data collection and presentation by Carl Denef
  • 2. Energy is the physical entity indispensable for performing work. It comes in different forms: mechanical, kinetic, thermal, radiative, electric, magnetic, chemical, nuclear, gravitational and others. Energy can be transformed to different forms at various efficiencies. An energy source can also be called a fuel. All natural energy on earth comes from the radiative energy of the sun, heat in the earth’s mantle (geothermal energy), and gravity. About 0.01% of solar energy is converted to plants. Over millions of years residues of living matter have been transformed under the soil and the sea to fossil hydrocarbon energy in the form of coal, oil and natural gas. These energy sources are limited and not renewable. Potential energy in it is transformed to usable power by burning. The rest products are greenhouse gasses, causing global warming and climate change. Energy can also be converted directly from solar radiation, gravity, the Earth crust and living plants by human technology (wind, solar, hydroelectric, geothermal and biomass power). These energy forms are renewable. In addition, the Earth crust contains uranium and thorium isotopes, that release high amounts of heat energy upon nuclear fission. Human-made hydrogen can also become a sustainable source of energy in the future. © picture: WWF-Canon / Edward Parker 2 2
  • 3. © picture: WWF-Canon / Edward Parker One of the units of measurement of energy is the Joule (J). It is a measure of the capacity or power to generate work, such as locomotive work in a combustion motor of a car, light generation by electric power, electricity generation in a turbine by wind power etc. Another unit, called Watt (W), is the power which in one second of time gives rise to 1 joule of energy 1 W = 1 J/sec 1 kilowatt (kW) = 1000 J/sec 1 megawatt (MW) = 106 J/sec 1 gigawatt (GW) = 109 J/sec 1 terawatt (TW) = 1012 J/sec Amounts of energy can also be expressed in terms of its flow over time during power conversion, with as unit the Watt.sec 1 W.sec = 1 J 1 kW.hour (kWh) is the energy flow with a power of 1 kW sustained during 1 hour 1 kWh = 1000 x 3600 = 3.6 x 10⁶ J = 3.6 MJ 1 kWyear (1kWy) = 1000 x 3600 x 24 x 365 = 31 536 000 000 J or 1 J = 31.71 x 10⁻¹² kWy = 31.71 x 10⁻²¹ TWy In the slides that follow energy capacity is usually expressed in GWy or TWy, shortened in the figures as GW and TW. In some slides energy consumption is expressed in kWh, MWh or TWh 3 3
  • 4. Fuel kWh per kilogram* Deuterium–tritium 92 400 000 Uranium-235 23 279 200[3] Hydrogen (compressed at 70 MPa) 34 Natural gas 15.5 Gasoline (petrol) / Diesel ~13 Propane (including LPG) 13 Biodiesel 12 Ethanol 8.4 Coal 6.7 Wood 5 Car battery (lead-acid) 0.7 Li-ion battery 0.24 Alkaline battery 0.67 Nickel-metal hydride battery 0.288 106 Fuel kWh per m3 Liquid hydrogen 2389 Hydrogen, at 690 bar and 15°C 1260 Hydrogen, gas[ 2.8 Natural gas 10.2 Gasoline (petrol) / Diesel 9600
  • 5. Electricity generation Efficiency Gas turbine up to 40% Gas turbine plus steam turbine (combined cycle) up to 60% Hydropower turbine up to 90% Wind turbine up to 59% (theoretical limit) Solar cell 6–40% (technology dependent) Hydrogen Fuel cell up to 85% Geothermal power 10–23% Engine/Motor Combustion engine 10–50%[2] Electric motors 70–99.99% (above 200W); 50–90% (between 10–200W); Electrolysis of water 50–70% Appliances Incandescent light bulb 0.7–5 % Electric heater 100 % Natural process Photosynthesis up to 6% [3] Muscle 14–27% Energy conversion efficiency is the ratio between the useful output of an energy conversion machine and the input, in energy terms. The useful output may be electric power, mechanical work, or heat. 103
  • 6. • Energy returned on energy invested (EROEI); or energy return on investment (EROI), is the ratio of the amount of usable energy acquired from a particular energy resource to the amount of energy expended to obtain that energy. Determining the EROEI is often complex, resulting in wide variations in the data. In the asesment the whole life cycle should be envisaged. • The more difficult to extract energy from a source, the more energy is to be invested to extract it, lowering the EROEI and increasing the price. For example, when oil was originally discovered, it took on average one barrel of oil to find, extract, and process about 100 barrels of oil. That ratio has declined steadily over the last century to about three barrels gained for one barrel used up in the U.S. • If an energy source can flow to different tracks, its EROEI will increase. For example in Europe rapeseed is used to produce biodiesel. The EROEI is around 1.5 but a side product, pure plant oil, is used as a protein- rich animal food, with an EROEI of 16. 105 Energy source ERoEI[1] Crude oil (per 2007) 10 Oil sands (per 2007) 2 - 4 Natural gas 5 – 10 Coal 1 – 10 Nuclear 2,7 - 4 Hydroelectric 10 Wind 3 – 10 Solar panels 1 – 10 Biofuels Soy biodiedel 5.5 Sugar cane ethanol 4 - 8 Rapeseed biodiesel 1,5 Corn ethanol 0,8 - 1,5 Maize ethanol 1,1 Biomass 0,8 Hydrogen 0,5
  • 7. • The net capacity factor of a power plant is the ratio of its actual output over a period of time, to its potential output if it were possible for it to operate at full nameplate capacity indefinitely. The capacity factor is highest for nuclear and geothermal power plants and lower for wind and solar energy as the latter are not continuously available. Fossil energy power stations work at full capacity only during peak hours in the day and les at night during lower demand. 102 85 87 90 92 83 53 34 25 Capacity(%) Capacity factor
  • 8. The figure shows the huge differences between energy types, solar and wind facilities occupying much smaller land area than bio- and fossil fuel facilities. Both low and high estimates (depending on the study) are given. 3 9 16 1000 900 0 200 400 600 800 1000 1200 Globalhectares/MW Low High 110
  • 9. Total • Total use in billion m3 (bcm)(in 2010 and prospected). Water withdrawal is water that is taken from the natural environment and after use redistributed in nature, for example to feed an electric turbine in the form of steam, to cool the reactor in a nuclear power plant or to irrigate biomass crop land. Often that water is warm and polluted. Consumption is water that is consumed during energy production, for example water taken up by biomass crops. From IEA 111
  • 10. Per energy unit • Withdrawal and consumption of water in gallons (Gal) per MWh (1 gallon=3.8 liter) 112
  • 11. Total and by energy type • World total energy consumption in 2010 was 17.8 terrawatt (TW). Most is extracted from conventional fossil (coal, oil, natural gas) and nuclear (uranium) reserves. Renewable energy (wind, solar, hydroelectric, geothermal and biomass) is growing rapidly in recent years, now reaching 12 % of the world total energy consumption, which is more than double of nuclear energy consumption (5.3 %). 4.9 5.9 3.9 0.95 2.17 0 1 2 3 4 5 6 7 TW World energy consumption 2010 coal 28% oil 33% gas 22% nuclear 5% renewable 12% 4
  • 12. Consumption by energy type and country 5 Coal 19% Oil 35% Gas 24% Nuclear 14% Renew ables 8% EU Coal 21% Oil 37% Gas 25% Nuclear 9% Renew ables 8% USA 2010 (EIA) Coal 23% Oil 43% Gas 18% Nuclear 13% Renew ables 4% Japan 2010 (EIA) Coal 70% Oil 19% Gas 4% Nuclear 1% Hydro electric 6% China 2009 (EIA) Coal 41% Oil 23% Gas 8% Nuclear 5% Waste & Renew ables 28% India 2011 (EIA) Oil 13% Gas 4% Hydro electric 1% Tradi- tional biomass & waste 82% Nigeria 2010 (EIA) Coal 2% Oil 47% Gas 28% Hydro electric 23% Venezuela 2010 (EIA) Coal 3% Oil & bioethanol 39% Gas 7% Nuclear 1% Hydro electric 29% Biomass 21% Brazil 2010 (EIA)
  • 13. • Energy consumption per capita is highly variable in different areas of the world, developing countries consuming much less. Values range between 0.2 kW/person (Eritrea) and 22 kW/person (Iceland) sustained for 1 year. In Belgium it is 7.4 kW, ranking 7th highest. • There are also striking differences between cities in the same country, for example in electricity consumption in U.S. cities. 6 Per capita electricity use in kWh/capita
  • 14. • The striking differences between developed and developing countries is also reflected in the number of people (> 1.6 billion) without access to electricity in 2002 and predicted to have only slightly improved in 2030. This is due in part to the strong population growth in this part of the world. It clearly shows that dealing with energy issues cannot be disconnected from the inequality problem between people. 7 In India 2009
  • 15. • Energy consumption grew spectacularly, both in total and per capita, since the industrial revolution, as a consequence of the population explosion (click here to see population growth animation) and of human scientific and technical development. Since then we have already consumed about 800 TW of fossil energy. Fossil fuels are still dominant in the global energy mix, supported by $ 523 billion subsidies in 2011, up almost 30% in 2010 and six times more than subsidies to the renewable energy sector[4 ., an alarming situation, considering that the fact that fossil energy combustion is the cause of global warming and climate change . 8
  • 16. • The dominant energy source changed over time from wood to coal to oil. At present there is a transition in motion to a renewable energy age, named by Greenpeace the ‘Energy Revolution’. 9 (1 Quad.Btu (british thermal units) = 33.45 × 10 - 3 TW)
  • 17. • Energy supplies are used for >50 % in industry, for > 25 % in transportation, and for 22 % in residential and commercial facilities. The type of energy differs widely among these sectors. Oil is used for 96 % in transportation, while coal and nuclear energy feed electricity generation. 10 Industry 52% Transpo rtation 26% Residen tial 14% Commer cial 8% World 2012 (EIA) 0 20 40 60 80 100 120 Percent Sector energy consumption by energy type Coal Oil Gas Nuclear Renewable World total electricity production = 2.3 TW (~20 000 TWh)
  • 18. • Energy type used by sector differs widely among countries Industry 77% Transportati on… Residenti al 11% Commerc ial 4% China 2009 (EIA) Industry 31% Transpor tation 28% Residenti al 22% Commercia l… U.S. 2008 10b
  • 19. 113 The table underneath shows the number of people killed by electricity generation systems worldwide per year, as collated by the IEA from different studies (lowest and highest numbers are given). Coal is responsible for a much higher number of deaths than other energy sources, while nuclear fatalities are lowest. In the Chernobyl disaster there were 56 direct deaths and 4000 people died from cancer. Recent estimates on the hazards caused by the Fukushima nuclear accident predict a total of 130 cancer deaths over lifespan.[22] Some 230 000 people were killed in a dam failure of a hydroelectric power station in China in 1975. However, it is astonishing to note that the number of people killed in road accidents worldwide was 1,230,000[2] in 2007. It is even more astonishing that the annual death toll due to fossil energy-related climate change is 400 000 and that this will increase to 700 000 by 2030 if a drastic change in our fossil energy economy is not implemented. Average number of people killed/year due to electricity generation Low estimates High estimates Coal 2296 26814 Hydroelectric 320 512 Natural gas 126 672 Nuclear 52 312