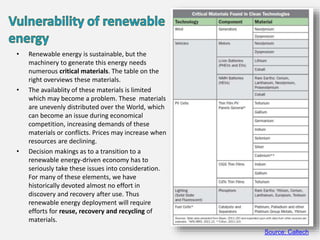
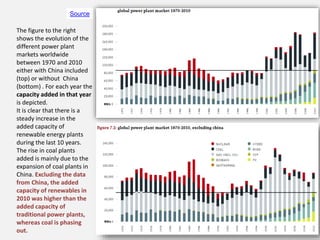
The document discusses the massive potential for renewable energy sources on Earth, including wind, solar, hydroelectric, geothermal, and ocean power. The theoretical potential exceeds 4 million terawatts, while the technical potential is around 240 terawatts, over 10 times current worldwide energy consumption annually. Some key renewable energy sources are then discussed in more detail, along with their geographical potential and some considerations regarding their deployment.
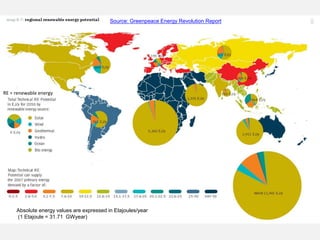
![It has been calculated that massive amounts of renewable energy are available on Earth. The
theoretical potential is > 4 million TW .
The technical potential totals around 240 TW, which is > 10 times the energy we consume in one year
today worldwide. Read more. This number aggrees well with calculations by Greenpeace report
Energy [R]evolution (379 TW)
In addition to tidal and ocean wave energy there is ocean thermal energy, which is at least 2 orders of
magnitude larger than tidal and wave energy.
190 235
4.75
92
124000
4439400
1
10
100
1000
10000
100000
1000000
10000000
TW
Theoretical potential
19
4.5
1.6
8
51
159
1
10
100
1000
TW
Technical potential](https://image.slidesharecdn.com/renewableenergy-140804081227-phpapp01/85/Renewable-energy-2-320.jpg)
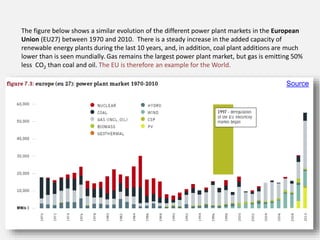
![Worldwide ~2 TW renewable energy was
available in 2011, which is >10% of total
energy consumption and 20% of electricity
generation. If traditional biomass energy is
included sharing of renewables is 16%.
CSP = concentrating solar power; PV = photovoltaic
panels
Belgium has a 5.7 GW capacity for 2011,
which is 6.3% of its total (90 GW)[1, 2].
Belgium ranks 4th in solar photovoltaic (PV)
panels per capita and is within the world top
15 countries to make biofuel. Energy safety
of Belgium is, however, vulnerable as it
imports 80 % of its energy as fossil energy,
despite it has 2 nuclear power plants (7
reactors).
0
500
1000
1500
2000
2500
GW
Renewable energy capacity
in 2011 - World
Biofuels
Biomass
Wind power
Solar hot
water
Solar CSP
Solar PV
Ocean power
Hydropower
Geothermal
0
1
2
3
4
5
6
GW
Renewable energy capacity
in 2011 - Belgium
Biofuel
Biomass
Wind
Solar PV
Hydropowe
r](https://image.slidesharecdn.com/renewableenergy-140804081227-phpapp01/85/Renewable-energy-5-320.jpg)
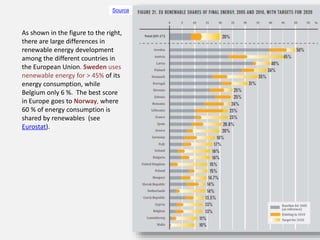
![Solar hot water collectors
are used to heat water. It can provide 60 to
70% of the domestic hot water use with
temperatures up to 60 oC.[55] As of 2010, the
total installed world capacity of solar hot
water systems was approximately 196 GW
(Wiki). China is the world leader with 118 GW
installed as of 2010 and a long term goal of
210 GW by 2020.[58
Photovoltaic cells
A photovoltaic cell (PV), is a device that converts
light into electric current using the
photoelectric effect. Germany is the world's
top PV installer, with a solar PV capacity of
more than 32 GW in 2012. World capacity is
212 GW.
Solar energy types
19 MW solar park in Germany](https://image.slidesharecdn.com/renewableenergy-140804081227-phpapp01/85/Renewable-energy-9-320.jpg)
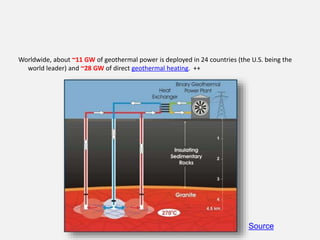
![Earth's geothermal energy originates from radioactive decay of minerals in the Earth's mantle .
It can be used
either as a non-renewable source i.e. the heat in the first 3000 m of the Earth's mantle which contains
enough heat to theoretically supply all of the world's energy for 100,000 years, although only a
small percentage of that is technically extractable
or as a renewable source i.e. the heat used not more than that replenished each year. The latter can
be tapped from deeper Earth layers and would be sustainable for about 2 billion years at the
consumption rate of our present energy use.[124][125] .
Shallow ground heat energy is mainly of solar energy. Below a depth of 6 m temperature is equal to the
mean local surface temperature.
Geothermal energy is used for home thermoregulation by heat pumps extracting ground heat in the
winter (for heating) and transfering heat back into the ground in the summer (for cooling), for district
heating and for generating electricity in power plants.
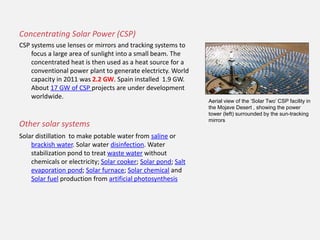
A power plant needs the higher temperatures of deep Earth resources.[10]. To tap the heat, holes are
drilled deep in the Earth, water is punped in and, after exchanging the heat (150-270 oC), transports
the heat to a turbine (see Figure in next slide). Depths are usually 4-5 km but drilling as deep as 12 km
is feasible (Read more). To increase heat conductance the procedure of Enhanced Geothermal
Systems is adopted today. Even though geothermal power is renewable, extraction must be monitored
to avoid local depletion. Over the course of decades, individual wells may draw down local
temperatures, but if extraction rates are then decreased the local temperature rises again.
Geothermal energy](https://image.slidesharecdn.com/renewableenergy-140804081227-phpapp01/85/Renewable-energy-12-320.jpg)
![Wind power is the conversion of wind energy into a
useful form of energy, such as by wind turbines to
make electrical power, windmills for mechanical
power, or wind pumps for water pumping or
drainage. Wind power is proportional to the third
power of the wind speed.
Wind turbine power worldwide in 2012 was 282 GW,
China being number 1 (75 GW) before the U.S. (60
GW). In addition to large turbines, the World Wind
Energy Association (WWEA) reported more than
650,000 small wind turbines globally in 2010.
Wind power depends on the location of the turbines and
has significant variation over short time scales.
Power management techniques can greatly mitigate
these problems, such as installing excess capacity
storage, geographically distributed turbines,
dispatchable backing sources, exporting and
importing power to neighboring areas or reducing
demand when wind production is low.[7] Weather
forecasting permits the electricity network to be
readied for variations in production.[8][9]
Wind power
Since wind speed is not constant, a wind
farm's annual energy production is never
maximum of the installed capacity (name
plate). The ratio of actual productivity to the
theoretical maximum is 15–50%[65][66][nb](https://image.slidesharecdn.com/renewableenergy-140804081227-phpapp01/85/Renewable-energy-15-320.jpg)
![Since solar energy is absent during the night and since wind is not always blowing, it is important that
the captured energy can be stored and later be used if power supply is absent.
See :
• Deployment of solar power to energy grids
• Thermal mass applications
• Seasonal thermal energy storage
• Grid energy storage
• Vehicle-to-grid systems
Left: The 150 MW Andasol solar power station is a commercial parabolic trough
solar thermal power plant, located in Spain. The Andasol plant uses tanks of
molten salt to store solar energy so that it can continue generating electricity even
when the sun isn't shining.[102]
Wind power complements very well with hydroelectricity power. When the wind is blowing strongly, nearby
hydroelectric plants can temporarily hold back their water, and when the wind drops they can rapidly increase
production again giving a very even power supply.
Pumped-storage hydroelectricity or other forms of grid energy storage can store energy developed by high-
wind periods and release it when needed [100].Belgium is planning to build a Pumped-storage hydroelectricity
in the North Sea.
Solar and wind energy storage](https://image.slidesharecdn.com/renewableenergy-140804081227-phpapp01/85/Renewable-energy-17-320.jpg)
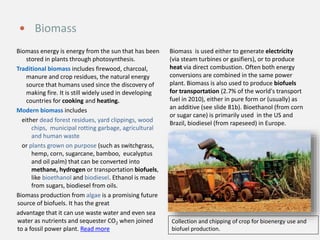
![Traditional biomass capacity worldwide
was ~1 TW in 2010. Its share in
residential energy use is high in
developing countries.
Modern biomass capacity was ~0.35 TW
[x]](https://image.slidesharecdn.com/renewableenergy-140804081227-phpapp01/85/Renewable-energy-19-320.jpg)
![• Little or no impact on health and environmental except biomass
• Little or no greenhouse gas emissions - except for biomass - once the energy device is
constructed and therefore a convincing mitigation method for climate change.
• Minimal land and freshwater requirements. Geothermal and wind power use 3.5 km2 and
12 km2 per GW electric energy produced, respectively vs 32 km2 for coal.[10] Geothermal
plants use 20 l of water per MWh vs over 1,000 l per MWh for nuclear, coal, or oil.[10]
• Supply safety provided there is back-up installation (e.g. in case of no wind), local energy
security and reduced import dependency
• Short construction periods compared to conventional energy generation
• Relatively low operational complexity compared to other energy generation. Onshore wind
and solar PV projects have well established operational track records.
• Predictable cash flows as it is not subject to fuel price volatility because the primary energy
resource is generally freely available.
• Job creation: According to the Renewables 2012 global status report, renewable energy
investments created 5 million jobs worldwide, of which more than 1 million in the European
Union, 1.6 million in China and almost a million in Brazil.
• Biofuels may attenuate the increase of oil price and delay ‘peak oil’](https://image.slidesharecdn.com/renewableenergy-140804081227-phpapp01/85/Renewable-energy-20-320.jpg)
![• Wind and solar power
Wind and solar devices may have land, visual and noice impacts.
• Geothermal power plants
Like nuclear power plants, geothermal plants are heat pollutants as they add heat energy
to the biosphere that would not otherwise be released. This is not the case for wind, solar,
tidal and hydroelectric power generation.
Fluids drawn from the deep Earth carry a mixture of greenhouse gases (CO2, hydrogen
sulfide, methane and ammonia), but it is 8 times less than a coal power plant [6]. If pumps
are driven by conventional power plant electricity, considerable greenhouse gas is emitted.
Plant construction can adversely affect land stability.
Enhanced geothermal systems can trigger earthquakes as part of hydraulic fracturing. The
project in Basel, Switzerland was suspended because more than 10,000 seismic events
measuring up to 3.4 on the Richter Scale occurred over the first 6 days of water injection.[49]
• Hydropower stations
Since they often generate electricity for large areas, power failures can cause serious
discomfort. Moreover, there are quite numerous examples of hydropower station failures and of
dam failures, that caused large damage to humans and land. Very large hydropower installations
have also been criticized for having forced people to move and damage ecosystems.](https://image.slidesharecdn.com/renewableenergy-140804081227-phpapp01/85/Renewable-energy-22-320.jpg)
![o The table below shows greenhouse gas (GHG) fluxes from biofuels in megagrams
(kilotonnes) per hectare per year, showing the inconsistency between studies:
o Negative values indicate a net uptake of GHG by the crops (i.e. removal from the
atmosphere) and positive values indicating a net emission of GHG (i.e. added to
atmospheric concentrations)
o In a number of countries (e.g. European Union) planting of biomass crops is mandated by
law, which resulted in large quantities of biomass being transported from Africa, Asia,
Canada, USA, Brazil and other regions).[37] The GHG emitted by these continuous
transportations is substantial and is counterproductive in terms of GHG mitigation strategies.
o In addition to GHG biomass as a fuel produces air pollution: CO, formaldehyde,
acetaldehyde and particulates (in some cases at levels above those from traditional coal).
Read more](https://image.slidesharecdn.com/renewableenergy-140804081227-phpapp01/85/Renewable-energy-24-320.jpg)
![• When alcohols are oxidized, formaldehyde, acetaldehyde and other aldehydes are
produced. When only a 10% mixture of ethanol is added to gasoline (as is common
in American E10 gasohol and elsewhere), aldehyde emissions increase 40%.
• The energy balance (EROEI) (the amount of energy put into the manufacturing of the
fuel compared to the amount of energy released when it is burned in a vehicle)[29] of
biofuel is low (1-2 in most studies) and in some studies negative (<1) when the
industrial processes needed to grow the plants (fertilizers and irrigation), extract, refine
and transport the fuel from the plants is taken into account.](https://image.slidesharecdn.com/renewableenergy-140804081227-phpapp01/85/Renewable-energy-25-320.jpg)
![ In developing countries biomass fuel is used inefficiently for heating and cooking, causing
smoke indoors and possibly fatal intoxication, particularly in children.
Friends of the Earth state that "the current rush to develop biofuels on a large scale is ill-
conceived and will contribute to an already unsustainable trade whilst not solving the
problems of climate change or energy security".[65]](https://image.slidesharecdn.com/renewableenergy-140804081227-phpapp01/85/Renewable-energy-26-320.jpg)
![0
20
40
60
80
100
120
Percent
Sector share of energy consumption by energy
type
Coal
Oil
Gas
Nuclear
Renewable
In the industrial, residential and commercial
sector fossil energy supply can be replaced by
a mix of renewable energy sources by 2030
(see previous slides).
Coal in power plants for electricity generation,
can be replaced by renewable energy and
backed up by nuclear energy generated by fast
breeder reactors
A major challenge for the near future will be
replacement of oil used in transportation. As
of 2011 there were more than one billion cars
in use in the world,[2][3]and these are on the
average only in use for 1 hour/24 with 1.6
people/car. Only around 70 million use
alternative fuel and advanced technology (<
7%). A switch to alternatives will take
time but is actually in progress (read
more). Leading countries are Brazil and
USA](https://image.slidesharecdn.com/renewableenergy-140804081227-phpapp01/85/Renewable-energy-34-320.jpg)
![Alternatives to petroleum-based vehicles are:
– Vehicles that use natural gas (temporarily), bioethanol, flexible-fuel, biodiesel or hydrogen.
– Electric vehicles: battery electric vehicles, plug-in hybrid electric vehicles, hybrid electric
vehicles, and hydrogen fuel cell vehicles.
For large distance and heavy truck traffic or if speed is mandatory, present electric vehicles are not
suited. A switch from road to rail (electric) seems imperative, and is currently developed in
Europe.
Synthetic fuel and biofuels are also alternatives of kerosene as jet fuel, several companies already
flying with this fuel.
Biofuels can replace fossil liquid fuels only for 10-15% due to lack of adequate land and
sustainability constraints.
The most difficult change that will be necessary is our change in behavior. The era of easy point-
to-point transportation, with easily obtainable oil, at high speed, as single driver, at whatever
time, and as often as we like, has ended. We, in developed countries, should realize that people
in developing countries have the same right to drive cars as we. China built > 14 million new cars
in 2011, India 3 million (as many as the U.S.) [Ref]](https://image.slidesharecdn.com/renewableenergy-140804081227-phpapp01/85/Renewable-energy-35-320.jpg)