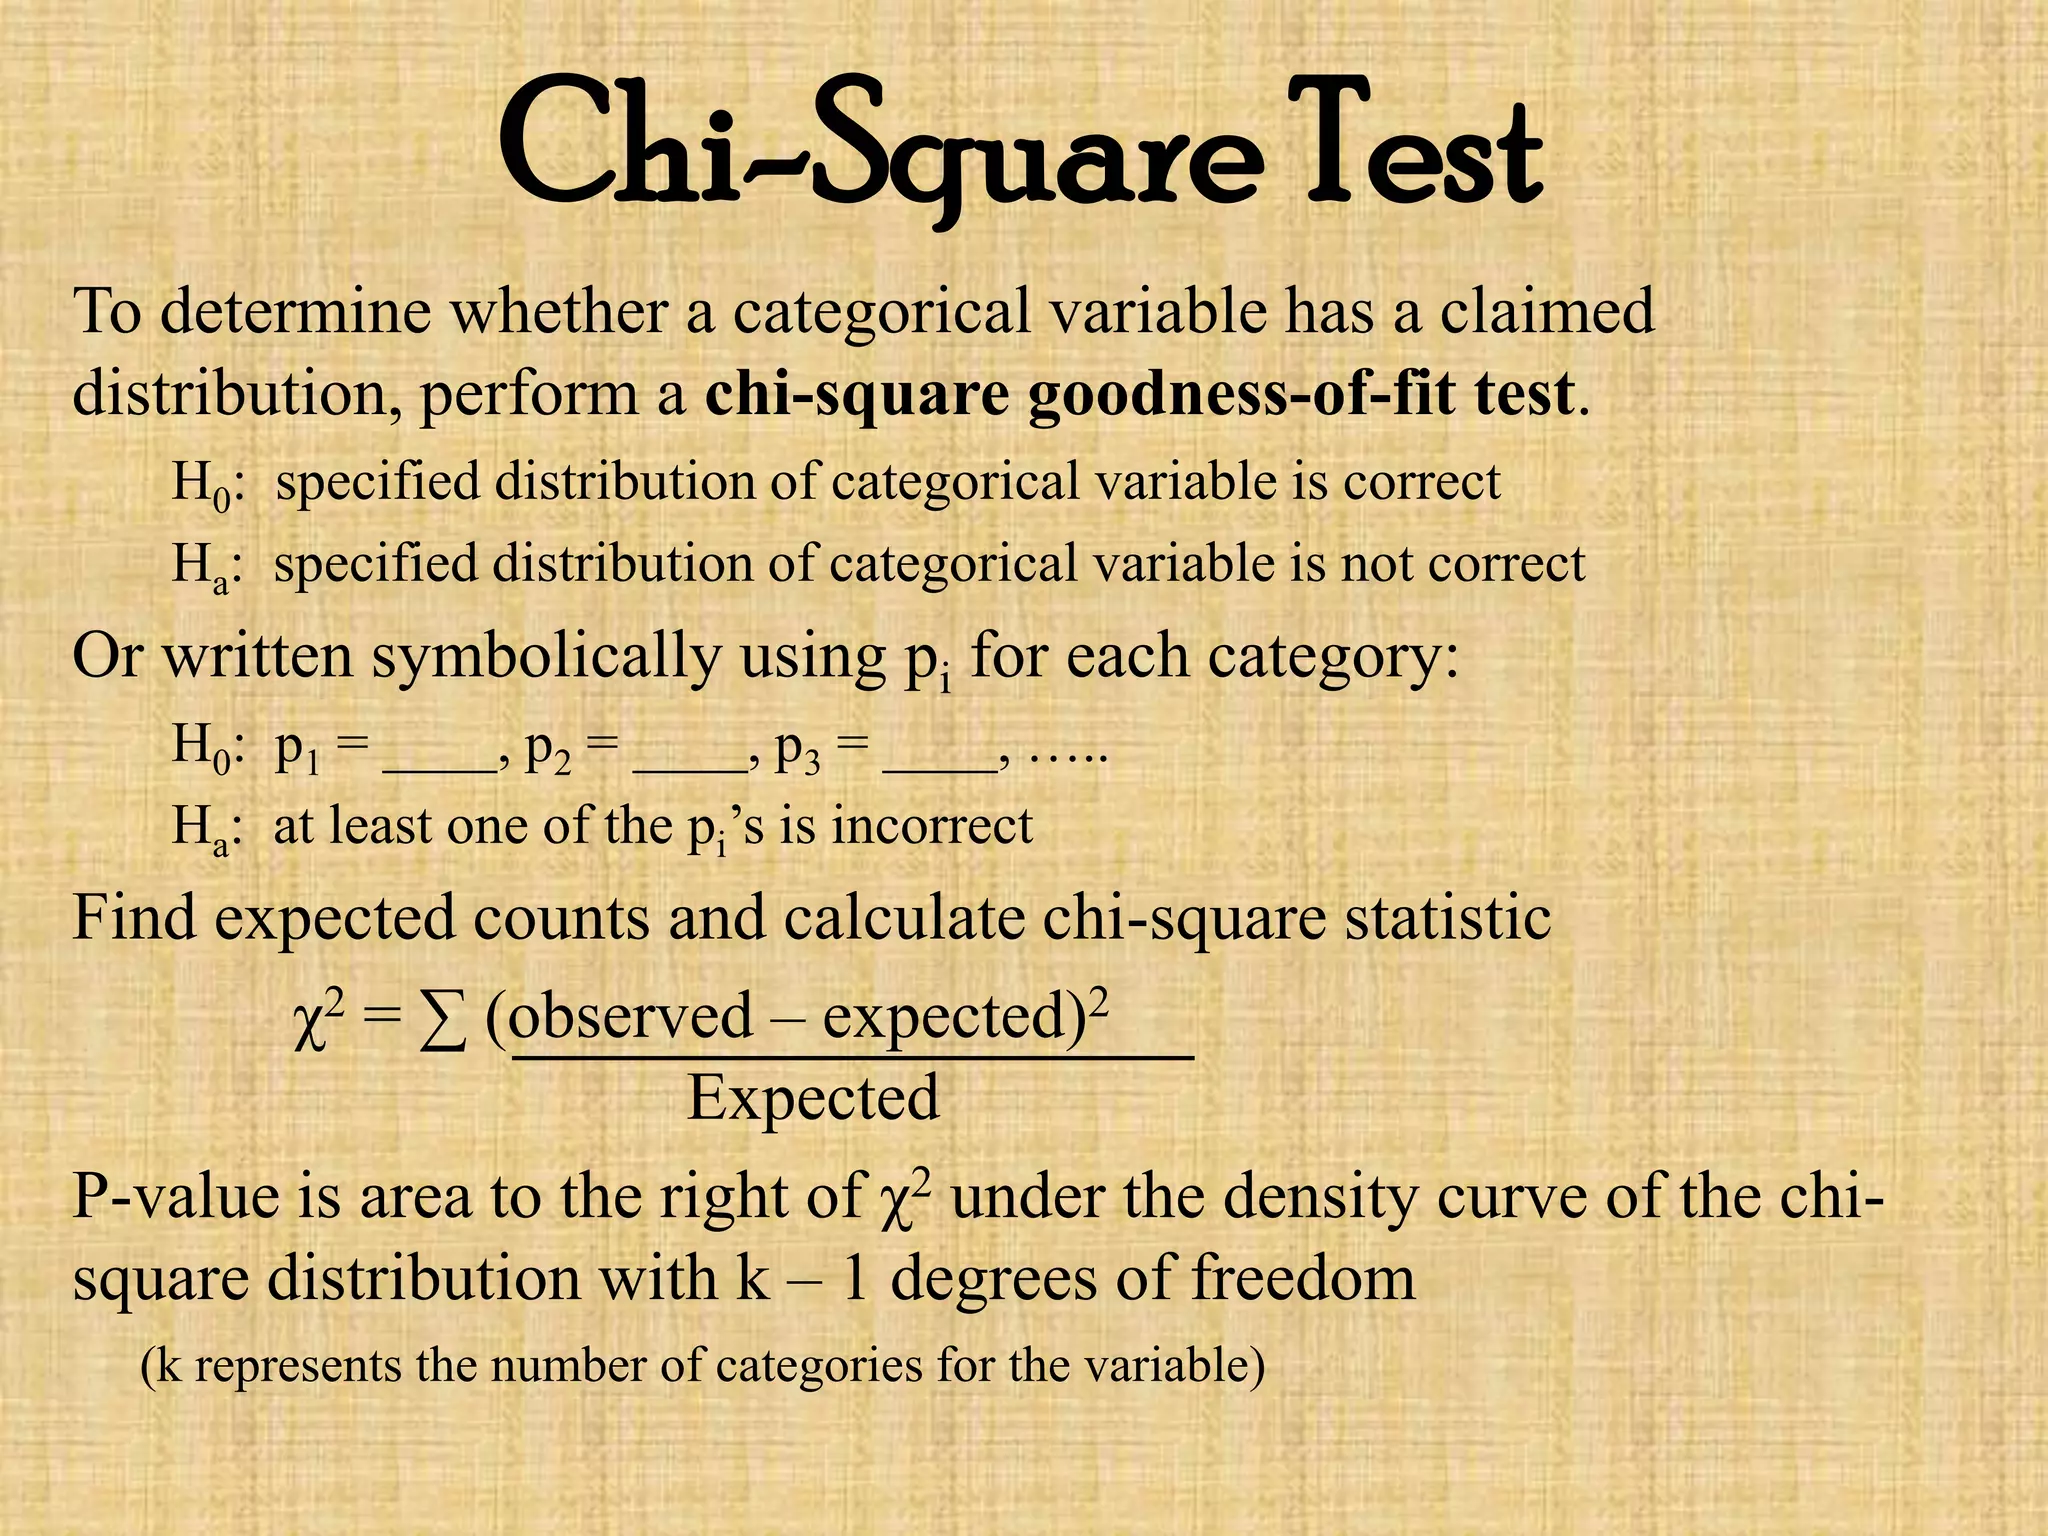
SlideShare a Scribd company logo
Focus FoxA statistically minded toll collector wonders if drivers are equally
likely to choose each of the three lanes at his toll booth. He
selects a random sample from all the cars that approach the booth
when all three lanes are empty, so that the driver’s choice isn’t
influenced by the cars already at the booth.
Which of the following is the appropriate alternative hypothesis for
addressing this question?
a. The observed number of cars choosing each lane is equal.
b. The observed number of cars choosing each lane is different from the expected
number of cars.
c. The proportions of cars choosing each of the three lanes are equal.
d. The proportions of cars choosing at least one of the lanes is different from the
proportion choosing the other two lanes.
e. The proportions of cars choosing each of the three lanes are all different.
Lane Left Center right
Number of drivers 137 159 169
Chi-Square Test
We still have 3 conditions we must meet:
Replacement condition – Large Sample Size condition
- all expected counts must be at least 5
Large Sample Size condition takes the place of the Normal
condition for z & t procedures
Random & Independent must still be met!
Chi-Square Test
To determine whether a categorical variable has a claimed
distribution, perform a chi-square goodness-of-fit test.
H0: specified distribution of categorical variable is correct
Ha: specified distribution of categorical variable is not correct
Or written symbolically using pi for each category:
H0: p1 = ____, p2 = ____, p3 = ____, …..
Ha: at least one of the pi’s is incorrect
Find expected counts and calculate chi-square statistic
χ2 = ∑ (observed – expected)2
Expected
P-value is area to the right of χ2 under the density curve of the chi-
square distribution with k – 1 degrees of freedom
(k represents the number of categories for the variable)
Chi-Square Test
3 Conditions:
Random – data comes from a random sample or a randomized
experiment.
Large Sample Size – all expected counts are at least 5
Independent – individual observations are independent. When
sampling without replacement, the population is at least 10 as large as
the sample (10% condition)
Cautions:
- Make sure you are comparing counts not proportions
- When checking Large Sample Size, make sure to use expected
counts
Chi-Square Test
Are births evenly distributed across the days of the week? The
one-way table below shows the distribution of births across the
days of the week in a random sample of 140 births from local
records in a large city.
Do these data give significant evidence that local births are not
equally likely on all days of the week?
SPDC:
(expected counts in Plan, graph in Do)
Day: Sun. Mon. Tues. Wed. Thurs. Fri. Sat.
Births: 13 23 24 20 27 18 15
Chi-Square Test
Failing to reject does NOT mean H0 is correct
We can use technology to complete the “Do”
- Enter observed counts in L1
- Enter expected counts in L2
- STAT over to TESTS
- Select χ2 GOF-Test
Calculate gives test statistic, df,
& P-value
Draw will provide appropriate distribution with shading
Color Observed Expected
Blue 9 14.4
Orange 8 12
Green 12 9.6
Yellow 15 8.4
Red 10 7.8
Brown 6 7.8
Chi-Square Test
Biologists wish to cross pairs of tobacco plants having genetic
makeup Gg, indicating that each plant has one dominant gene G
and one recessive gene g for color. Each offspring plant will
receive one gene for color from each parent. The Punnett Square
shows the possible combinations of genes received by the
offspring
The Punnett Square suggests
that the expected ratio of green
GG to yellow-green Gg to albino
gg tobacco plants should be 1:2:1. The biologists predict that
25% of the offspring will be green, 50% will be yellow-green,
and 25% will be albino.
G g
G GG Gg
g Gg gg
Parent1
Parent 2
Chi-Square Test
To test their hypothesis about the distribution of offspring, the
biologists mate 84 randomly selected pairs of yellow-green
parent plants. Of 84 offspring, 23 plants were green, 50 were
yellow-green, and 11 were albino. Do these data differ
significantly from what the biologists have predicted? Carry out
an appropriate test at the α = 0.05 level to answer.
SPDC:
(expected counts in plan, graph in Do)
Chi-Square Test
If the sample data lead to a statistically significant result, we can
conclude that our variable has a distribution different from the
specified one.
We need a Follow-Up Analysis (the “why”)
Steps:
- Examine which categories of the variable show large
deviations between the observed and expected counts
- Look at the terms that sum χ2
- These components show which terms contribute most to the
chi-square statistic
Chi-Square Test
Ex. Tobacco Plant Offspring
Biggest contributor??
More or less than expected??
Follow-Up Analysis:
The largest contributor to the chi-square statistic is Albino
offspring. There were 10 fewer Albino plants than we expected.
Offspring Color Observed Expected
Green 23 21
Yellow-green 50 42
Albino 11 21

More Related Content

What's hot

135. Graphic Presentation
135. Graphic Presentation135. Graphic Presentation
135. Graphic Presentation
LAKSHMANAN S
 
One-Sample Hypothesis Tests
One-Sample Hypothesis TestsOne-Sample Hypothesis Tests
One-Sample Hypothesis Tests
Sr Edith Bogue
 
Variance & standard deviation
Variance & standard deviationVariance & standard deviation
Variance & standard deviation
Faisal Hussain
 
Sampling and sampling distributions
Sampling and sampling distributionsSampling and sampling distributions
Sampling and sampling distributions
Stephan Jade Navarro
 
Frequency distribution
Frequency distributionFrequency distribution
Frequency distribution
metnashikiom2011-13
 
9. basic concepts_of_one_way_analysis_of_variance_(anova)
9. basic concepts_of_one_way_analysis_of_variance_(anova)9. basic concepts_of_one_way_analysis_of_variance_(anova)
9. basic concepts_of_one_way_analysis_of_variance_(anova)
Irfan Hussain
 
measure of dispersion
measure of dispersion measure of dispersion
measure of dispersion
som allul
 
Chi square test final
Chi square test finalChi square test final
Chi square test final
Har Jindal
 
Measures Of Central Tendencies
Measures Of Central TendenciesMeasures Of Central Tendencies
Measures Of Central Tendencies
Adams City High School
 
Central tendency
Central tendencyCentral tendency
Central tendency
Andi Koentary
 
The kolmogorov smirnov test
The kolmogorov smirnov testThe kolmogorov smirnov test
The kolmogorov smirnov testSubhradeep Mitra
 
different typesbardiagram and pie diagram
 different typesbardiagram and pie diagram different typesbardiagram and pie diagram
different typesbardiagram and pie diagram
sana sana
 
O-give slide share
O-give slide shareO-give slide share
O-give slide share
SreejayaPV
 
Measures of dispersion
Measures of dispersionMeasures of dispersion
Measures of dispersion
Habibullah Bahar University College
 
Skewness and Kurtosis presentation
Skewness  and Kurtosis  presentationSkewness  and Kurtosis  presentation
Skewness and Kurtosis presentation
Abdullah Moin
 
Chi square test
Chi square testChi square test
Chi square test
AmanRathore54
 
Bivariate data
Bivariate dataBivariate data
Bivariate data
julienorman80065
 
Theory of Association in Statistics
Theory of Association in StatisticsTheory of Association in Statistics
Theory of Association in Statistics
Ojas Maheshwari
 
Measures of central tendency mean
Measures of central tendency meanMeasures of central tendency mean
Measures of central tendency mean
RekhaChoudhary24
 

What's hot (20)

135. Graphic Presentation
135. Graphic Presentation135. Graphic Presentation
135. Graphic Presentation
 
One-Sample Hypothesis Tests
One-Sample Hypothesis TestsOne-Sample Hypothesis Tests
One-Sample Hypothesis Tests
 
Variance & standard deviation
Variance & standard deviationVariance & standard deviation
Variance & standard deviation
 
Sampling and sampling distributions
Sampling and sampling distributionsSampling and sampling distributions
Sampling and sampling distributions
 
Frequency distribution
Frequency distributionFrequency distribution
Frequency distribution
 
9. basic concepts_of_one_way_analysis_of_variance_(anova)
9. basic concepts_of_one_way_analysis_of_variance_(anova)9. basic concepts_of_one_way_analysis_of_variance_(anova)
9. basic concepts_of_one_way_analysis_of_variance_(anova)
 
measure of dispersion
measure of dispersion measure of dispersion
measure of dispersion
 
Chi square test final
Chi square test finalChi square test final
Chi square test final
 
F test
F testF test
F test
 
Measures Of Central Tendencies
Measures Of Central TendenciesMeasures Of Central Tendencies
Measures Of Central Tendencies
 
Central tendency
Central tendencyCentral tendency
Central tendency
 
The kolmogorov smirnov test
The kolmogorov smirnov testThe kolmogorov smirnov test
The kolmogorov smirnov test
 
different typesbardiagram and pie diagram
 different typesbardiagram and pie diagram different typesbardiagram and pie diagram
different typesbardiagram and pie diagram
 
O-give slide share
O-give slide shareO-give slide share
O-give slide share
 
Measures of dispersion
Measures of dispersionMeasures of dispersion
Measures of dispersion
 
Skewness and Kurtosis presentation
Skewness  and Kurtosis  presentationSkewness  and Kurtosis  presentation
Skewness and Kurtosis presentation
 
Chi square test
Chi square testChi square test
Chi square test
 
Bivariate data
Bivariate dataBivariate data
Bivariate data
 
Theory of Association in Statistics
Theory of Association in StatisticsTheory of Association in Statistics
Theory of Association in Statistics
 
Measures of central tendency mean
Measures of central tendency meanMeasures of central tendency mean
Measures of central tendency mean
 

Similar to Chi square goodness of fit test

Stat 230 Summer 2014 – Final Exam Page 1 .docx
Stat 230          Summer 2014 – Final Exam Page 1  .docxStat 230          Summer 2014 – Final Exam Page 1  .docx
Stat 230 Summer 2014 – Final Exam Page 1 .docx
dessiechisomjj4
 
Qnt 275 final exam july 2017 version
Qnt 275 final exam july 2017 versionQnt 275 final exam july 2017 version
Qnt 275 final exam july 2017 version
Adams-ASs
 
Chapter 11
Chapter 11Chapter 11
Chapter 11bmcfad01
 
Chi- Square test.pptx
Chi- Square test.pptxChi- Square test.pptx
Chi- Square test.pptx
MuskanKhan320706
 
Combining ability study
Combining ability study Combining ability study
Combining ability study
Ankit R. Chaudhary
 
Chapter 5 Anova2009
Chapter 5 Anova2009Chapter 5 Anova2009
Chapter 5 Anova2009ghalan
 
Chapter 11
Chapter 11 Chapter 11
Chapter 11
Tuul Tuul
 
Chisquared test.pptx
Chisquared test.pptxChisquared test.pptx
Chisquared test.pptx
Krishna Krish Krish
 
Ch 10-Two populations.pptx
Ch 10-Two populations.pptxCh 10-Two populations.pptx
Ch 10-Two populations.pptx
tharkistani
 
Goodness of Fit Notation
Goodness of Fit NotationGoodness of Fit Notation
Goodness of Fit Notation
Long Beach City College
 
Question 1 1.  Assume that the data has a normal distribution .docx
Question 1 1.  Assume that the data has a normal distribution .docxQuestion 1 1.  Assume that the data has a normal distribution .docx
Question 1 1.  Assume that the data has a normal distribution .docx
IRESH3
 
QNT 561 Final Exam Guide (New)G
QNT 561 Final Exam Guide (New)GQNT 561 Final Exam Guide (New)G
QNT 561 Final Exam Guide (New)G
monsterr14
 
QNT 561 GENIUS Remember Education--qnt561genius.com
QNT 561 GENIUS Remember Education--qnt561genius.comQNT 561 GENIUS Remember Education--qnt561genius.com
QNT 561 GENIUS Remember Education--qnt561genius.com
chrysanthemu34
 
QNT 561 GENIUS Redefined Education--qnt561genius.com
QNT 561 GENIUS Redefined Education--qnt561genius.comQNT 561 GENIUS Redefined Education--qnt561genius.com
QNT 561 GENIUS Redefined Education--qnt561genius.com
agathachristie231
 
QNT 561 GENIUS Inspiring Innovation--qnt561genius.com
QNT 561 GENIUS Inspiring Innovation--qnt561genius.comQNT 561 GENIUS Inspiring Innovation--qnt561genius.com
QNT 561 GENIUS Inspiring Innovation--qnt561genius.com
kopiko115
 
QNT 561 GENIUS Education Planning--qnt561genius.com
QNT 561 GENIUS Education Planning--qnt561genius.comQNT 561 GENIUS Education Planning--qnt561genius.com
QNT 561 GENIUS Education Planning--qnt561genius.com
VTejeswini15
 
QNT 275 Exceptional Education - snaptutorial.com
QNT 275   Exceptional Education - snaptutorial.comQNT 275   Exceptional Education - snaptutorial.com
QNT 275 Exceptional Education - snaptutorial.com
DavisMurphyB22
 
Hypothesis-Testing-to-STATISTICAL-TESTS1-1 (1).docx
Hypothesis-Testing-to-STATISTICAL-TESTS1-1 (1).docxHypothesis-Testing-to-STATISTICAL-TESTS1-1 (1).docx
Hypothesis-Testing-to-STATISTICAL-TESTS1-1 (1).docx
licensedtutor
 

Similar to Chi square goodness of fit test (20)

Stat 230 Summer 2014 – Final Exam Page 1 .docx
Stat 230          Summer 2014 – Final Exam Page 1  .docxStat 230          Summer 2014 – Final Exam Page 1  .docx
Stat 230 Summer 2014 – Final Exam Page 1 .docx
 
Qnt 275 final exam july 2017 version
Qnt 275 final exam july 2017 versionQnt 275 final exam july 2017 version
Qnt 275 final exam july 2017 version
 
Stats chapter 14
Stats chapter 14Stats chapter 14
Stats chapter 14
 
Chapter 11
Chapter 11Chapter 11
Chapter 11
 
Chi- Square test.pptx
Chi- Square test.pptxChi- Square test.pptx
Chi- Square test.pptx
 
Combining ability study
Combining ability study Combining ability study
Combining ability study
 
Chapter 5 Anova2009
Chapter 5 Anova2009Chapter 5 Anova2009
Chapter 5 Anova2009
 
Chapter 5 Anova2009
Chapter 5 Anova2009Chapter 5 Anova2009
Chapter 5 Anova2009
 
Chapter 11
Chapter 11 Chapter 11
Chapter 11
 
Chisquared test.pptx
Chisquared test.pptxChisquared test.pptx
Chisquared test.pptx
 
Ch 10-Two populations.pptx
Ch 10-Two populations.pptxCh 10-Two populations.pptx
Ch 10-Two populations.pptx
 
Goodness of Fit Notation
Goodness of Fit NotationGoodness of Fit Notation
Goodness of Fit Notation
 
Question 1 1.  Assume that the data has a normal distribution .docx
Question 1 1.  Assume that the data has a normal distribution .docxQuestion 1 1.  Assume that the data has a normal distribution .docx
Question 1 1.  Assume that the data has a normal distribution .docx
 
QNT 561 Final Exam Guide (New)G
QNT 561 Final Exam Guide (New)GQNT 561 Final Exam Guide (New)G
QNT 561 Final Exam Guide (New)G
 
QNT 561 GENIUS Remember Education--qnt561genius.com
QNT 561 GENIUS Remember Education--qnt561genius.comQNT 561 GENIUS Remember Education--qnt561genius.com
QNT 561 GENIUS Remember Education--qnt561genius.com
 
QNT 561 GENIUS Redefined Education--qnt561genius.com
QNT 561 GENIUS Redefined Education--qnt561genius.comQNT 561 GENIUS Redefined Education--qnt561genius.com
QNT 561 GENIUS Redefined Education--qnt561genius.com
 
QNT 561 GENIUS Inspiring Innovation--qnt561genius.com
QNT 561 GENIUS Inspiring Innovation--qnt561genius.comQNT 561 GENIUS Inspiring Innovation--qnt561genius.com
QNT 561 GENIUS Inspiring Innovation--qnt561genius.com
 
QNT 561 GENIUS Education Planning--qnt561genius.com
QNT 561 GENIUS Education Planning--qnt561genius.comQNT 561 GENIUS Education Planning--qnt561genius.com
QNT 561 GENIUS Education Planning--qnt561genius.com
 
QNT 275 Exceptional Education - snaptutorial.com
QNT 275   Exceptional Education - snaptutorial.comQNT 275   Exceptional Education - snaptutorial.com
QNT 275 Exceptional Education - snaptutorial.com
 
Hypothesis-Testing-to-STATISTICAL-TESTS1-1 (1).docx
Hypothesis-Testing-to-STATISTICAL-TESTS1-1 (1).docxHypothesis-Testing-to-STATISTICAL-TESTS1-1 (1).docx
Hypothesis-Testing-to-STATISTICAL-TESTS1-1 (1).docx
 

More from amylute

What are the odds notes
What are the odds notesWhat are the odds notes
What are the odds notes
amylute
 
Logarithmic transformations
Logarithmic transformationsLogarithmic transformations
Logarithmic transformations
amylute
 
Transforming data for inference
Transforming data for inferenceTransforming data for inference
Transforming data for inference
amylute
 
Inference in regression line test
Inference  in regression line testInference  in regression line test
Inference in regression line test
amylute
 
Regression inference confidence intervals
Regression inference confidence intervalsRegression inference confidence intervals
Regression inference confidence intervals
amylute
 
Using chi square wisely
Using chi square wiselyUsing chi square wisely
Using chi square wisely
amylute
 
Chi square test for homgeneity
Chi square test for homgeneityChi square test for homgeneity
Chi square test for homgeneity
amylute
 
Relationships across distribution
Relationships across distributionRelationships across distribution
Relationships across distribution
amylute
 
Chi square distribution table c
Chi square distribution table cChi square distribution table c
Chi square distribution table c
amylute
 
Ap statistics chp. 11
Ap statistics chp. 11Ap statistics chp. 11
Ap statistics chp. 11
amylute
 
Dividing polys
Dividing polysDividing polys
Dividing polysamylute
 
Solving triangles pp slides
Solving triangles pp slidesSolving triangles pp slides
Solving triangles pp slidesamylute
 
Conditional prob & independence
Conditional prob & independenceConditional prob & independence
Conditional prob & independence
amylute
 
Two way tables & venn diagrams
Two way tables & venn diagramsTwo way tables & venn diagrams
Two way tables & venn diagrams
amylute
 
Probability models & basic rules
Probability models & basic rulesProbability models & basic rules
Probability models & basic rules
amylute
 
Simulation
SimulationSimulation
Simulation
amylute
 
Mthys of probability
Mthys of probabilityMthys of probability
Mthys of probability
amylute
 
4.3 using studies wisely
4.3 using studies wisely4.3 using studies wisely
4.3 using studies wiselyamylute
 
4.2 blocking
4.2 blocking4.2 blocking
4.2 blockingamylute
 
4.2 placebos & double blind
4.2 placebos & double blind4.2 placebos & double blind
4.2 placebos & double blindamylute
 

More from amylute (20)

What are the odds notes
What are the odds notesWhat are the odds notes
What are the odds notes
 
Logarithmic transformations
Logarithmic transformationsLogarithmic transformations
Logarithmic transformations
 
Transforming data for inference
Transforming data for inferenceTransforming data for inference
Transforming data for inference
 
Inference in regression line test
Inference  in regression line testInference  in regression line test
Inference in regression line test
 
Regression inference confidence intervals
Regression inference confidence intervalsRegression inference confidence intervals
Regression inference confidence intervals
 
Using chi square wisely
Using chi square wiselyUsing chi square wisely
Using chi square wisely
 
Chi square test for homgeneity
Chi square test for homgeneityChi square test for homgeneity
Chi square test for homgeneity
 
Relationships across distribution
Relationships across distributionRelationships across distribution
Relationships across distribution
 
Chi square distribution table c
Chi square distribution table cChi square distribution table c
Chi square distribution table c
 
Ap statistics chp. 11
Ap statistics chp. 11Ap statistics chp. 11
Ap statistics chp. 11
 
Dividing polys
Dividing polysDividing polys
Dividing polys
 
Solving triangles pp slides
Solving triangles pp slidesSolving triangles pp slides
Solving triangles pp slides
 
Conditional prob & independence
Conditional prob & independenceConditional prob & independence
Conditional prob & independence
 
Two way tables & venn diagrams
Two way tables & venn diagramsTwo way tables & venn diagrams
Two way tables & venn diagrams
 
Probability models & basic rules
Probability models & basic rulesProbability models & basic rules
Probability models & basic rules
 
Simulation
SimulationSimulation
Simulation
 
Mthys of probability
Mthys of probabilityMthys of probability
Mthys of probability
 
4.3 using studies wisely
4.3 using studies wisely4.3 using studies wisely
4.3 using studies wisely
 
4.2 blocking
4.2 blocking4.2 blocking
4.2 blocking
 
4.2 placebos & double blind
4.2 placebos & double blind4.2 placebos & double blind
4.2 placebos & double blind
 

Recently uploaded

A Strategic Approach: GenAI in Education
A Strategic Approach: GenAI in EducationA Strategic Approach: GenAI in Education
A Strategic Approach: GenAI in Education
Peter Windle
 
CACJapan - GROUP Presentation 1- Wk 4.pdf
CACJapan - GROUP Presentation 1- Wk 4.pdfCACJapan - GROUP Presentation 1- Wk 4.pdf
CACJapan - GROUP Presentation 1- Wk 4.pdf
camakaiclarkmusic
 
Operation Blue Star - Saka Neela Tara
Operation Blue Star   -  Saka Neela TaraOperation Blue Star   -  Saka Neela Tara
Operation Blue Star - Saka Neela Tara
Balvir Singh
 
Acetabularia Information For Class 9 .docx
Acetabularia Information For Class 9  .docxAcetabularia Information For Class 9  .docx
Acetabularia Information For Class 9 .docx
vaibhavrinwa19
 
Overview on Edible Vaccine: Pros & Cons with Mechanism
Overview on Edible Vaccine: Pros & Cons with MechanismOverview on Edible Vaccine: Pros & Cons with Mechanism
Overview on Edible Vaccine: Pros & Cons with Mechanism
DeeptiGupta154
 
June 3, 2024 Anti-Semitism Letter Sent to MIT President Kornbluth and MIT Cor...
June 3, 2024 Anti-Semitism Letter Sent to MIT President Kornbluth and MIT Cor...June 3, 2024 Anti-Semitism Letter Sent to MIT President Kornbluth and MIT Cor...
June 3, 2024 Anti-Semitism Letter Sent to MIT President Kornbluth and MIT Cor...
Levi Shapiro
 
A Survey of Techniques for Maximizing LLM Performance.pptx
A Survey of Techniques for Maximizing LLM Performance.pptxA Survey of Techniques for Maximizing LLM Performance.pptx
A Survey of Techniques for Maximizing LLM Performance.pptx
thanhdowork
 
Model Attribute Check Company Auto Property
Model Attribute  Check Company Auto PropertyModel Attribute  Check Company Auto Property
Model Attribute Check Company Auto Property
Celine George
 
Honest Reviews of Tim Han LMA Course Program.pptx
Honest Reviews of Tim Han LMA Course Program.pptxHonest Reviews of Tim Han LMA Course Program.pptx
Honest Reviews of Tim Han LMA Course Program.pptx
timhan337
 
Chapter -12, Antibiotics (One Page Notes).pdf
Chapter -12, Antibiotics (One Page Notes).pdfChapter -12, Antibiotics (One Page Notes).pdf
Chapter -12, Antibiotics (One Page Notes).pdf
Kartik Tiwari
 
The basics of sentences session 5pptx.pptx
The basics of sentences session 5pptx.pptxThe basics of sentences session 5pptx.pptx
The basics of sentences session 5pptx.pptx
heathfieldcps1
 
The approach at University of Liverpool.pptx
The approach at University of Liverpool.pptxThe approach at University of Liverpool.pptx
The approach at University of Liverpool.pptx
Jisc
 
BÀI TẬP BỔ TRỢ TIẾNG ANH GLOBAL SUCCESS LỚP 3 - CẢ NĂM (CÓ FILE NGHE VÀ ĐÁP Á...
BÀI TẬP BỔ TRỢ TIẾNG ANH GLOBAL SUCCESS LỚP 3 - CẢ NĂM (CÓ FILE NGHE VÀ ĐÁP Á...BÀI TẬP BỔ TRỢ TIẾNG ANH GLOBAL SUCCESS LỚP 3 - CẢ NĂM (CÓ FILE NGHE VÀ ĐÁP Á...
BÀI TẬP BỔ TRỢ TIẾNG ANH GLOBAL SUCCESS LỚP 3 - CẢ NĂM (CÓ FILE NGHE VÀ ĐÁP Á...
Nguyen Thanh Tu Collection
 
Supporting (UKRI) OA monographs at Salford.pptx
Supporting (UKRI) OA monographs at Salford.pptxSupporting (UKRI) OA monographs at Salford.pptx
Supporting (UKRI) OA monographs at Salford.pptx
Jisc
 
Synthetic Fiber Construction in lab .pptx
Synthetic Fiber Construction in lab .pptxSynthetic Fiber Construction in lab .pptx
Synthetic Fiber Construction in lab .pptx
Pavel ( NSTU)
 
Embracing GenAI - A Strategic Imperative
Embracing GenAI - A Strategic ImperativeEmbracing GenAI - A Strategic Imperative
Embracing GenAI - A Strategic Imperative
Peter Windle
 
The French Revolution Class 9 Study Material pdf free download
The French Revolution Class 9 Study Material pdf free downloadThe French Revolution Class 9 Study Material pdf free download
The French Revolution Class 9 Study Material pdf free download
Vivekanand Anglo Vedic Academy
 
1.4 modern child centered education - mahatma gandhi-2.pptx
1.4 modern child centered education - mahatma gandhi-2.pptx1.4 modern child centered education - mahatma gandhi-2.pptx
1.4 modern child centered education - mahatma gandhi-2.pptx
JosvitaDsouza2
 
Home assignment II on Spectroscopy 2024 Answers.pdf
Home assignment II on Spectroscopy 2024 Answers.pdfHome assignment II on Spectroscopy 2024 Answers.pdf
Home assignment II on Spectroscopy 2024 Answers.pdf
Tamralipta Mahavidyalaya
 
Language Across the Curriculm LAC B.Ed.
Language Across the  Curriculm LAC B.Ed.Language Across the  Curriculm LAC B.Ed.
Language Across the Curriculm LAC B.Ed.
Atul Kumar Singh
 

Recently uploaded (20)

A Strategic Approach: GenAI in Education
A Strategic Approach: GenAI in EducationA Strategic Approach: GenAI in Education
A Strategic Approach: GenAI in Education
 
CACJapan - GROUP Presentation 1- Wk 4.pdf
CACJapan - GROUP Presentation 1- Wk 4.pdfCACJapan - GROUP Presentation 1- Wk 4.pdf
CACJapan - GROUP Presentation 1- Wk 4.pdf
 
Operation Blue Star - Saka Neela Tara
Operation Blue Star   -  Saka Neela TaraOperation Blue Star   -  Saka Neela Tara
Operation Blue Star - Saka Neela Tara
 
Acetabularia Information For Class 9 .docx
Acetabularia Information For Class 9  .docxAcetabularia Information For Class 9  .docx
Acetabularia Information For Class 9 .docx
 
Overview on Edible Vaccine: Pros & Cons with Mechanism
Overview on Edible Vaccine: Pros & Cons with MechanismOverview on Edible Vaccine: Pros & Cons with Mechanism
Overview on Edible Vaccine: Pros & Cons with Mechanism
 
June 3, 2024 Anti-Semitism Letter Sent to MIT President Kornbluth and MIT Cor...
June 3, 2024 Anti-Semitism Letter Sent to MIT President Kornbluth and MIT Cor...June 3, 2024 Anti-Semitism Letter Sent to MIT President Kornbluth and MIT Cor...
June 3, 2024 Anti-Semitism Letter Sent to MIT President Kornbluth and MIT Cor...
 
A Survey of Techniques for Maximizing LLM Performance.pptx
A Survey of Techniques for Maximizing LLM Performance.pptxA Survey of Techniques for Maximizing LLM Performance.pptx
A Survey of Techniques for Maximizing LLM Performance.pptx
 
Model Attribute Check Company Auto Property
Model Attribute  Check Company Auto PropertyModel Attribute  Check Company Auto Property
Model Attribute Check Company Auto Property
 
Honest Reviews of Tim Han LMA Course Program.pptx
Honest Reviews of Tim Han LMA Course Program.pptxHonest Reviews of Tim Han LMA Course Program.pptx
Honest Reviews of Tim Han LMA Course Program.pptx
 
Chapter -12, Antibiotics (One Page Notes).pdf
Chapter -12, Antibiotics (One Page Notes).pdfChapter -12, Antibiotics (One Page Notes).pdf
Chapter -12, Antibiotics (One Page Notes).pdf
 
The basics of sentences session 5pptx.pptx
The basics of sentences session 5pptx.pptxThe basics of sentences session 5pptx.pptx
The basics of sentences session 5pptx.pptx
 
The approach at University of Liverpool.pptx
The approach at University of Liverpool.pptxThe approach at University of Liverpool.pptx
The approach at University of Liverpool.pptx
 
BÀI TẬP BỔ TRỢ TIẾNG ANH GLOBAL SUCCESS LỚP 3 - CẢ NĂM (CÓ FILE NGHE VÀ ĐÁP Á...
BÀI TẬP BỔ TRỢ TIẾNG ANH GLOBAL SUCCESS LỚP 3 - CẢ NĂM (CÓ FILE NGHE VÀ ĐÁP Á...BÀI TẬP BỔ TRỢ TIẾNG ANH GLOBAL SUCCESS LỚP 3 - CẢ NĂM (CÓ FILE NGHE VÀ ĐÁP Á...
BÀI TẬP BỔ TRỢ TIẾNG ANH GLOBAL SUCCESS LỚP 3 - CẢ NĂM (CÓ FILE NGHE VÀ ĐÁP Á...
 
Supporting (UKRI) OA monographs at Salford.pptx
Supporting (UKRI) OA monographs at Salford.pptxSupporting (UKRI) OA monographs at Salford.pptx
Supporting (UKRI) OA monographs at Salford.pptx
 
Synthetic Fiber Construction in lab .pptx
Synthetic Fiber Construction in lab .pptxSynthetic Fiber Construction in lab .pptx
Synthetic Fiber Construction in lab .pptx
 
Embracing GenAI - A Strategic Imperative
Embracing GenAI - A Strategic ImperativeEmbracing GenAI - A Strategic Imperative
Embracing GenAI - A Strategic Imperative
 
The French Revolution Class 9 Study Material pdf free download
The French Revolution Class 9 Study Material pdf free downloadThe French Revolution Class 9 Study Material pdf free download
The French Revolution Class 9 Study Material pdf free download
 
1.4 modern child centered education - mahatma gandhi-2.pptx
1.4 modern child centered education - mahatma gandhi-2.pptx1.4 modern child centered education - mahatma gandhi-2.pptx
1.4 modern child centered education - mahatma gandhi-2.pptx
 
Home assignment II on Spectroscopy 2024 Answers.pdf
Home assignment II on Spectroscopy 2024 Answers.pdfHome assignment II on Spectroscopy 2024 Answers.pdf
Home assignment II on Spectroscopy 2024 Answers.pdf
 
Language Across the Curriculm LAC B.Ed.
Language Across the  Curriculm LAC B.Ed.Language Across the  Curriculm LAC B.Ed.
Language Across the Curriculm LAC B.Ed.
 

Chi square goodness of fit test

  • 1. Focus FoxA statistically minded toll collector wonders if drivers are equally likely to choose each of the three lanes at his toll booth. He selects a random sample from all the cars that approach the booth when all three lanes are empty, so that the driver’s choice isn’t influenced by the cars already at the booth. Which of the following is the appropriate alternative hypothesis for addressing this question? a. The observed number of cars choosing each lane is equal. b. The observed number of cars choosing each lane is different from the expected number of cars. c. The proportions of cars choosing each of the three lanes are equal. d. The proportions of cars choosing at least one of the lanes is different from the proportion choosing the other two lanes. e. The proportions of cars choosing each of the three lanes are all different. Lane Left Center right Number of drivers 137 159 169
  • 2. Chi-Square Test We still have 3 conditions we must meet: Replacement condition – Large Sample Size condition - all expected counts must be at least 5 Large Sample Size condition takes the place of the Normal condition for z & t procedures Random & Independent must still be met!
  • 3. Chi-Square Test To determine whether a categorical variable has a claimed distribution, perform a chi-square goodness-of-fit test. H0: specified distribution of categorical variable is correct Ha: specified distribution of categorical variable is not correct Or written symbolically using pi for each category: H0: p1 = ____, p2 = ____, p3 = ____, ….. Ha: at least one of the pi’s is incorrect Find expected counts and calculate chi-square statistic χ2 = ∑ (observed – expected)2 Expected P-value is area to the right of χ2 under the density curve of the chi- square distribution with k – 1 degrees of freedom (k represents the number of categories for the variable)
  • 4. Chi-Square Test 3 Conditions: Random – data comes from a random sample or a randomized experiment. Large Sample Size – all expected counts are at least 5 Independent – individual observations are independent. When sampling without replacement, the population is at least 10 as large as the sample (10% condition) Cautions: - Make sure you are comparing counts not proportions - When checking Large Sample Size, make sure to use expected counts
  • 5. Chi-Square Test Are births evenly distributed across the days of the week? The one-way table below shows the distribution of births across the days of the week in a random sample of 140 births from local records in a large city. Do these data give significant evidence that local births are not equally likely on all days of the week? SPDC: (expected counts in Plan, graph in Do) Day: Sun. Mon. Tues. Wed. Thurs. Fri. Sat. Births: 13 23 24 20 27 18 15
  • 6. Chi-Square Test Failing to reject does NOT mean H0 is correct We can use technology to complete the “Do” - Enter observed counts in L1 - Enter expected counts in L2 - STAT over to TESTS - Select χ2 GOF-Test Calculate gives test statistic, df, & P-value Draw will provide appropriate distribution with shading Color Observed Expected Blue 9 14.4 Orange 8 12 Green 12 9.6 Yellow 15 8.4 Red 10 7.8 Brown 6 7.8
  • 7. Chi-Square Test Biologists wish to cross pairs of tobacco plants having genetic makeup Gg, indicating that each plant has one dominant gene G and one recessive gene g for color. Each offspring plant will receive one gene for color from each parent. The Punnett Square shows the possible combinations of genes received by the offspring The Punnett Square suggests that the expected ratio of green GG to yellow-green Gg to albino gg tobacco plants should be 1:2:1. The biologists predict that 25% of the offspring will be green, 50% will be yellow-green, and 25% will be albino. G g G GG Gg g Gg gg Parent1 Parent 2
  • 8. Chi-Square Test To test their hypothesis about the distribution of offspring, the biologists mate 84 randomly selected pairs of yellow-green parent plants. Of 84 offspring, 23 plants were green, 50 were yellow-green, and 11 were albino. Do these data differ significantly from what the biologists have predicted? Carry out an appropriate test at the α = 0.05 level to answer. SPDC: (expected counts in plan, graph in Do)
  • 9. Chi-Square Test If the sample data lead to a statistically significant result, we can conclude that our variable has a distribution different from the specified one. We need a Follow-Up Analysis (the “why”) Steps: - Examine which categories of the variable show large deviations between the observed and expected counts - Look at the terms that sum χ2 - These components show which terms contribute most to the chi-square statistic
  • 10. Chi-Square Test Ex. Tobacco Plant Offspring Biggest contributor?? More or less than expected?? Follow-Up Analysis: The largest contributor to the chi-square statistic is Albino offspring. There were 10 fewer Albino plants than we expected. Offspring Color Observed Expected Green 23 21 Yellow-green 50 42 Albino 11 21