Chi square distribution table c
•Download as PPTX, PDF•
0 likes•432 views
This document discusses using the chi-square statistic to test whether observed sample results differ significantly from expected results. It provides the formula for calculating chi-square and explains that larger chi-square values provide stronger evidence against the null hypothesis. It then works through an example using data on M&M colors to calculate chi-square and determine the P-value to assess significance. The key steps are outlined as calculating chi-square, determining the degrees of freedom, using a chi-square table to find the P-value based on the chi-square value and degrees of freedom, and comparing the P-value to the significance level to determine whether to reject or fail to reject the null hypothesis.
Report
Share
Report
Share

Recommended
Math pi random sequence
1) The document examines whether the digits of pi have a random sequence by counting the occurrences of numbers 0-9 in the first 1,000 decimal places of pi and performing a chi-square test.
2) The results of the chi-square test show that the null hypothesis that each number 0-9 appears with equal probability can be rejected at the 10% significance level, indicating the sequence of digits in pi is not truly random.
3) Therefore, pi is not considered a good source of random numbers that could be used for encryption or other applications requiring a random sequence. Some regularity may exist in the digits of pi.
Correlation
Correlation describes the relationship between two variables that vary together. Positive correlation means both variables increase or decrease together, while negative correlation means one increases as the other decreases. Correlation is useful for comparing relationships precisely, testing if correlations are statistically significant rather than due to chance, and summarizing the strength and direction of relationships with a correlation coefficient. However, correlation does not prove that one variable causes changes in the other.
statsforusab
The document discusses statistics for analyzing goods with zero non-conforming test results to determine the maximum possible fraction of non-conforming items in the lot. It explains how to calculate the upper limit of non-conforming items using the binomial distribution for different sample sizes and confidence levels. Tables 1 and 2 show the maximum fraction of non-conforming items and required sample size respectively for various confidence levels when zero non-conforming items are found.
Unit 4 lesson 2
This document discusses the single sample t-test, which is used to determine if the mean of a sample is statistically significantly different from the population mean. It explains how to calculate the t-statistic and compare it to the critical t-value based on the confidence level and degrees of freedom. Examples are provided to demonstrate comparing sample means to population means and determining whether to reject or fail to reject the null hypothesis that the means are equal. Factors that influence the t-calculation are also outlined.
Double slit interference
This document discusses the math behind the double slit interference simulation on the PhET website. It begins by explaining how the simulation allows users to manipulate different factors and visualize their effects. However, it notes that a deeper understanding requires analyzing the equations.
It then presents three example questions working through the calculations for double slit interference with different wavelengths of light and slit separations. The calculations show that increasing the wavelength or decreasing the slit separation decreases the number of observable fringes by increasing the angular spacing between them. Working through the math provides a more thorough understanding of how to apply double slit concepts.
Mcqs (probability distribution)
The document contains 24 multiple choice questions related to probability distributions such as binomial, Poisson, and normal distributions. The questions test knowledge of key concepts like probability, mean, variance, skewness, and the relationships between different probability distributions. Correct answers are provided at the end.
SUBTRACTION WITH REGROUPING
The document discusses subtraction with regrouping for 4-5 digit numbers. It explains that subtraction with regrouping involves writing the minuend and subtrahend in columns and then subtracting the ones place, tens place, hundreds place and so on while regrouping the digits as needed. It provides an example of subtracting 43,657 - 34,691 step-by-step to demonstrate the process. The steps are to write the numbers in columns, subtract place values from right to left regrouping when needed, and then check the answer by adding the difference and subtrahend.
Logarithmic transformations
1. The document discusses logarithmic transformations, which can be used to transform non-linear data into a linear format to better model exponential relationships.
2. There are two options for logarithmic transformations: taking the log of just the response variable y, or taking the log of both the explanatory variable x and the response variable y.
3. Graphing the transformed data allows one to determine which option produces a more linear relationship and thus the better transformation to use.
Hypothesis testing - II.pptx
trdhgjhgfgcvbvhhgjghbntewghbnmbnbnbjhguyghjbnuyyuyfgbnbjhbhgbbhuiyti7rjfhgvhgrrtfgfugiuyuyjuiyyjhyt76yttyyupiuiojoioii0909ooeoreferfergergferfewfwefwef2d33rf34
Estimating a Population Standard Deviation or Variance
This document discusses estimating parameters and determining sample sizes from populations. It covers estimating population proportions, means, standard deviations, and variances. For each parameter, it describes how to construct confidence intervals and determine the necessary sample size. Formulas are provided for margin of error, t-scores, z-scores and the chi-square distribution, which is used for estimating variances and standard deviations. Examples show how to apply the concepts to find confidence intervals and critical values for specific population problems.
Descriptive statistics
This document discusses measures of central tendency and dispersion used in descriptive statistics. It defines the mode, median, and mean as measures of central tendency and how to calculate each for both raw and grouped data. It also discusses properties of each measure. For measures of dispersion, it defines the range, interquartile range, variance and standard deviation, providing formulas and examples of calculating each for a set of test score data. It concludes with notes on rounding rules and homework questions.
Lect w7 t_test_amp_chi_test
This document provides information about the t-test and chi-square test. It defines the t-test as a test used to compare the means of two samples when the population standard deviation is unknown. It lists the assumptions of the t-test and provides the formula. An example t-test problem and solution is given. Chi-square is introduced as a test used with categorical and numerical data to test for independence and goodness of fit. The chi-square test statistic, degrees of freedom, and hypothesis testing process are outlined. An example chi-square goodness of fit problem and solution is also provided.
Statisticsforbiologists colstons
This document provides an overview of various statistical methods for summarizing and analyzing biological data, including:
- Calculating the mean, median, and mode to summarize sample data
- Using distribution curves like histograms to visualize patterns in data and identify if the distribution is normal or skewed
- Calculating standard deviation to quantify the variation of data from the mean
- Using t-tests to compare two normally distributed samples and determine if differences are statistically significant
- Using non-parametric tests like the Mann-Whitney U test for small or skewed sample comparisons
- Applying the chi-squared test to analyze relationships between categorical variables
- Using the Spearman rank correlation coefficient to identify monotonic relationships between two variable sets
Estimating a Population Standard Deviation or Variance
Please Subscribe to this Channel for more solutions and lectures
http://www.youtube.com/onlineteaching
Chapter 7: Estimating Parameters and Determining Sample Sizes
7.3: Estimating a Population Standard Deviation or Variance
Estimating a Population Standard Deviation or Variance
Please Subscribe to this Channel for more solutions and lectures
http://www.youtube.com/onlineteaching
Chapter 7: Estimating Parameters and Determining Sample Sizes
7.3: Estimating a Population Standard Deviation or Variance
test & measuement
This document provides an overview of various statistical measures and methods of analysis. It discusses measures of central tendency including mean, median, and mode. It also covers measures of variability such as range, standard deviation, and correlation. Statistical analysis helps teachers summarize and compare student performance. The steps involved are collecting and organizing data, selecting an appropriate statistical technique, applying the method of analysis, and interpreting the results. Various graphical representations of data are also presented such as histograms, frequency polygons, and ogives.
C2 st lecture 10 basic statistics and the z test handout
This document provides an overview of basic statistics concepts including averages, measures of dispersion, hypothesis testing, and the z-test. It defines the mode, median, mean, interquartile range, standard deviation, and absolute deviation. It explains how to perform a z-test including writing the null and alternative hypotheses, looking up the critical value, calculating the test statistic, and making a decision. Two examples of z-tests are provided to demonstrate the process.
marketing research & applications on SPSS
The document discusses various statistical techniques used in marketing research to analyze survey data, including frequency distributions, measures of central tendency and variability, hypothesis testing, and cross-tabulation. Frequency distributions are used to determine the mean, mode, median and answer questions about single variables. Hypothesis testing involves forming hypotheses, selecting a test, determining significance levels, collecting data, and making statistical decisions. Cross-tabulation examines relationships between two or more variables using techniques like chi-square tests. Both parametric and non-parametric tests are used depending on variable scales.
Multivariate1
This document discusses using R to perform multivariate analysis, including one sample and two sample Hotelling's T-square tests and a two-way MANOVA. It analyzes pulmonary response data using a one sample test and rating data from two teachers using two sample tests with different hypothesized mean vectors. It also analyzes triathlon performance data using a two-way MANOVA to examine the effects of gender, age category, and their interaction on swim, bike, and run times. Key results include no significant change in pulmonary function, no difference in teacher ratings, and significant effects of both gender and age category on triathlon performance times.
Chapter11
The document discusses hypothesis testing methods for comparing two population or treatment means. It covers notation, sampling distributions, large sample hypothesis testing, confidence intervals, and paired t-tests. An example compares the mean fill volumes of two beer can filling machines and constructs a 98% confidence interval for the difference in tensile strengths of two thread types.
QT1 - 03 - Measures of Central Tendency
This document discusses measures of central tendency and dispersion used to analyze and summarize data. It defines key terms like mean, median, mode, range, variance, and standard deviation. It explains how to calculate these measures both mathematically and using grouped or sample data, and the importance of understanding the central tendency and dispersion of data distributions.
QT1 - 03 - Measures of Central Tendency
This document discusses measures of central tendency and dispersion used to analyze and summarize data. It defines key terms like mean, median, mode, range, variance, and standard deviation. It explains how to calculate these measures both mathematically and using grouped or sample data, and the importance of understanding the distribution, central tendency and dispersion of data.
Measures of dispersion or variation
This document discusses various measures of dispersion used to describe how varied or spread out a set of data values are from the average. It describes range, interquartile range, mean deviation, standard deviation, and the Lorenz curve. Standard deviation is highlighted as the most important measure, being easy to calculate, taking all data points into account equally, and indicating how far values typically are from the average in a normal distribution. The document provides formulas and explains properties and limitations of each measure.
Application of Statistical and mathematical equations in Chemistry Part 2
Application of Statistical and mathematical equations in Chemistry
Part 2
Accuracy
Precision
Propagation of Error
Confidence Limits
F-Test Values
Student’s t-test
Paired Sample t-test
Q test
Least Squares Method
correlation coefficient
Small Sampling Theory Presentation1
Small sample theory deals with statistical inference when sample sizes are small (n ≤ 30). It involves t and F distributions which are defined in terms of degrees of freedom. The t-distribution was developed by William Gosset and is used when sample sizes are small. It has a bell shape but is more spread out than the normal distribution. The F-distribution is used to test if two variances are equal and is defined as the ratio of two chi-square variables. Both distributions depend on degrees of freedom.
hypothesis testing-tests of proportions and variances in six sigma
The document provides information about various statistical hypothesis tests that can be used to analyze data and test if process improvements have resulted in significant changes. It discusses one proportion tests, two proportions tests, one-variance tests, two-variances tests, and how to determine which test to use based on the type of data and questions being asked. Examples are also provided of applying these tests using Minitab software to analyze sample data and test hypotheses about changes between before and after process improvement situations. The document aims to help determine the appropriate statistical tests for validating improvements in processes.
Statistical ppt
This document discusses statistical analysis techniques including measures of central tendency, variance, standard deviation, t-tests, and levels of significance. It provides an example of using these techniques to analyze plant height data from a fertilizer experiment and determine if differences in heights between treated and untreated plants are statistically significant. The document introduces the concepts and calculations involved in describing and analyzing quantitative data using common statistical methods.
What are the odds notes
This document discusses the odds of a successful outcome of an event. It defines odds as the ratio of the probability of success to the probability of failure. It also notes that probability is a ratio of the desired outcome to the total possible outcomes. The document directs the reader to additional examples on specific pages to further illustrate the concept of odds and probability.
Transforming data for inference
Transforming data involves changing the scale of measurement used to collect data in order to better model relationships between variables. For example, when modeling the relationship between length and weight of fish, a power model using length cubed better fits the data than a linear model, since weight is related to the cube of length. The marine lab provided reference data that was used to find the least-squares regression line equation to predict fish weights based on their lengths.
More Related Content
Similar to Chi square distribution table c
Hypothesis testing - II.pptx
trdhgjhgfgcvbvhhgjghbntewghbnmbnbnbjhguyghjbnuyyuyfgbnbjhbhgbbhuiyti7rjfhgvhgrrtfgfugiuyuyjuiyyjhyt76yttyyupiuiojoioii0909ooeoreferfergergferfewfwefwef2d33rf34
Estimating a Population Standard Deviation or Variance
This document discusses estimating parameters and determining sample sizes from populations. It covers estimating population proportions, means, standard deviations, and variances. For each parameter, it describes how to construct confidence intervals and determine the necessary sample size. Formulas are provided for margin of error, t-scores, z-scores and the chi-square distribution, which is used for estimating variances and standard deviations. Examples show how to apply the concepts to find confidence intervals and critical values for specific population problems.
Descriptive statistics
This document discusses measures of central tendency and dispersion used in descriptive statistics. It defines the mode, median, and mean as measures of central tendency and how to calculate each for both raw and grouped data. It also discusses properties of each measure. For measures of dispersion, it defines the range, interquartile range, variance and standard deviation, providing formulas and examples of calculating each for a set of test score data. It concludes with notes on rounding rules and homework questions.
Lect w7 t_test_amp_chi_test
This document provides information about the t-test and chi-square test. It defines the t-test as a test used to compare the means of two samples when the population standard deviation is unknown. It lists the assumptions of the t-test and provides the formula. An example t-test problem and solution is given. Chi-square is introduced as a test used with categorical and numerical data to test for independence and goodness of fit. The chi-square test statistic, degrees of freedom, and hypothesis testing process are outlined. An example chi-square goodness of fit problem and solution is also provided.
Statisticsforbiologists colstons
This document provides an overview of various statistical methods for summarizing and analyzing biological data, including:
- Calculating the mean, median, and mode to summarize sample data
- Using distribution curves like histograms to visualize patterns in data and identify if the distribution is normal or skewed
- Calculating standard deviation to quantify the variation of data from the mean
- Using t-tests to compare two normally distributed samples and determine if differences are statistically significant
- Using non-parametric tests like the Mann-Whitney U test for small or skewed sample comparisons
- Applying the chi-squared test to analyze relationships between categorical variables
- Using the Spearman rank correlation coefficient to identify monotonic relationships between two variable sets
Estimating a Population Standard Deviation or Variance
Please Subscribe to this Channel for more solutions and lectures
http://www.youtube.com/onlineteaching
Chapter 7: Estimating Parameters and Determining Sample Sizes
7.3: Estimating a Population Standard Deviation or Variance
Estimating a Population Standard Deviation or Variance
Please Subscribe to this Channel for more solutions and lectures
http://www.youtube.com/onlineteaching
Chapter 7: Estimating Parameters and Determining Sample Sizes
7.3: Estimating a Population Standard Deviation or Variance
test & measuement
This document provides an overview of various statistical measures and methods of analysis. It discusses measures of central tendency including mean, median, and mode. It also covers measures of variability such as range, standard deviation, and correlation. Statistical analysis helps teachers summarize and compare student performance. The steps involved are collecting and organizing data, selecting an appropriate statistical technique, applying the method of analysis, and interpreting the results. Various graphical representations of data are also presented such as histograms, frequency polygons, and ogives.
C2 st lecture 10 basic statistics and the z test handout
This document provides an overview of basic statistics concepts including averages, measures of dispersion, hypothesis testing, and the z-test. It defines the mode, median, mean, interquartile range, standard deviation, and absolute deviation. It explains how to perform a z-test including writing the null and alternative hypotheses, looking up the critical value, calculating the test statistic, and making a decision. Two examples of z-tests are provided to demonstrate the process.
marketing research & applications on SPSS
The document discusses various statistical techniques used in marketing research to analyze survey data, including frequency distributions, measures of central tendency and variability, hypothesis testing, and cross-tabulation. Frequency distributions are used to determine the mean, mode, median and answer questions about single variables. Hypothesis testing involves forming hypotheses, selecting a test, determining significance levels, collecting data, and making statistical decisions. Cross-tabulation examines relationships between two or more variables using techniques like chi-square tests. Both parametric and non-parametric tests are used depending on variable scales.
Multivariate1
This document discusses using R to perform multivariate analysis, including one sample and two sample Hotelling's T-square tests and a two-way MANOVA. It analyzes pulmonary response data using a one sample test and rating data from two teachers using two sample tests with different hypothesized mean vectors. It also analyzes triathlon performance data using a two-way MANOVA to examine the effects of gender, age category, and their interaction on swim, bike, and run times. Key results include no significant change in pulmonary function, no difference in teacher ratings, and significant effects of both gender and age category on triathlon performance times.
Chapter11
The document discusses hypothesis testing methods for comparing two population or treatment means. It covers notation, sampling distributions, large sample hypothesis testing, confidence intervals, and paired t-tests. An example compares the mean fill volumes of two beer can filling machines and constructs a 98% confidence interval for the difference in tensile strengths of two thread types.
QT1 - 03 - Measures of Central Tendency
This document discusses measures of central tendency and dispersion used to analyze and summarize data. It defines key terms like mean, median, mode, range, variance, and standard deviation. It explains how to calculate these measures both mathematically and using grouped or sample data, and the importance of understanding the central tendency and dispersion of data distributions.
QT1 - 03 - Measures of Central Tendency
This document discusses measures of central tendency and dispersion used to analyze and summarize data. It defines key terms like mean, median, mode, range, variance, and standard deviation. It explains how to calculate these measures both mathematically and using grouped or sample data, and the importance of understanding the distribution, central tendency and dispersion of data.
Measures of dispersion or variation
This document discusses various measures of dispersion used to describe how varied or spread out a set of data values are from the average. It describes range, interquartile range, mean deviation, standard deviation, and the Lorenz curve. Standard deviation is highlighted as the most important measure, being easy to calculate, taking all data points into account equally, and indicating how far values typically are from the average in a normal distribution. The document provides formulas and explains properties and limitations of each measure.
Application of Statistical and mathematical equations in Chemistry Part 2
Application of Statistical and mathematical equations in Chemistry
Part 2
Accuracy
Precision
Propagation of Error
Confidence Limits
F-Test Values
Student’s t-test
Paired Sample t-test
Q test
Least Squares Method
correlation coefficient
Small Sampling Theory Presentation1
Small sample theory deals with statistical inference when sample sizes are small (n ≤ 30). It involves t and F distributions which are defined in terms of degrees of freedom. The t-distribution was developed by William Gosset and is used when sample sizes are small. It has a bell shape but is more spread out than the normal distribution. The F-distribution is used to test if two variances are equal and is defined as the ratio of two chi-square variables. Both distributions depend on degrees of freedom.
hypothesis testing-tests of proportions and variances in six sigma
The document provides information about various statistical hypothesis tests that can be used to analyze data and test if process improvements have resulted in significant changes. It discusses one proportion tests, two proportions tests, one-variance tests, two-variances tests, and how to determine which test to use based on the type of data and questions being asked. Examples are also provided of applying these tests using Minitab software to analyze sample data and test hypotheses about changes between before and after process improvement situations. The document aims to help determine the appropriate statistical tests for validating improvements in processes.
Statistical ppt
This document discusses statistical analysis techniques including measures of central tendency, variance, standard deviation, t-tests, and levels of significance. It provides an example of using these techniques to analyze plant height data from a fertilizer experiment and determine if differences in heights between treated and untreated plants are statistically significant. The document introduces the concepts and calculations involved in describing and analyzing quantitative data using common statistical methods.
Similar to Chi square distribution table c (20)
Estimating a Population Standard Deviation or Variance
Estimating a Population Standard Deviation or Variance
Estimating a Population Standard Deviation or Variance
Estimating a Population Standard Deviation or Variance
Estimating a Population Standard Deviation or Variance
Estimating a Population Standard Deviation or Variance
C2 st lecture 10 basic statistics and the z test handout
C2 st lecture 10 basic statistics and the z test handout
Application of Statistical and mathematical equations in Chemistry Part 2
Application of Statistical and mathematical equations in Chemistry Part 2
hypothesis testing-tests of proportions and variances in six sigma
hypothesis testing-tests of proportions and variances in six sigma
More from amylute
What are the odds notes
This document discusses the odds of a successful outcome of an event. It defines odds as the ratio of the probability of success to the probability of failure. It also notes that probability is a ratio of the desired outcome to the total possible outcomes. The document directs the reader to additional examples on specific pages to further illustrate the concept of odds and probability.
Transforming data for inference
Transforming data involves changing the scale of measurement used to collect data in order to better model relationships between variables. For example, when modeling the relationship between length and weight of fish, a power model using length cubed better fits the data than a linear model, since weight is related to the cube of length. The marine lab provided reference data that was used to find the least-squares regression line equation to predict fish weights based on their lengths.
Inference in regression line test
This document discusses regression inference and significance testing for the slope parameter in a simple linear regression model. It provides details on conducting a t-test for the slope of the population regression line to test if the slope is equal to some hypothesized value (the null hypothesis) versus an alternative hypothesis where the slope is greater than, less than, or not equal to the hypothesized value. Examples are given on interpreting test statistics and p-values and drawing conclusions about the evidence for or against a linear relationship between two variables based on the regression analysis and test results.
Regression inference confidence intervals
This document discusses regression analysis and the conditions needed to perform statistical inference on regression models. It summarizes key concepts like the population regression line, sample regression line, residuals, and sampling distributions. It then describes 5 conditions for regression inference: linearity, independence, normality, equal variance, and randomness. An example is provided of students collecting data by dropping helicopters from various heights and analyzing the results. Steps are outlined to check if the conditions are met and interpret results from the computer output and confidence interval.
Using chi square wisely
The document discusses using chi-square tests to analyze categorical data. It explains that a chi-square test for homogeneity determines if variables are distributed the same across groups, while a chi-square test for association determines if variables are associated. The key is to select the right test based on whether data came from independent samples or a single sample classified on two variables. An example analyzes data on gender and fear from scary movies using a chi-square test for association.
Chi square test for homgeneity
This document discusses conditions for performing a chi-square goodness-of-fit test and chi-square test for homogeneity. The chi-square goodness-of-fit test requires that all expected counts be greater than 5. The chi-square test for homogeneity can be used to compare distributions across multiple groups, requires random sampling and independence of observations, and that expected counts be at least 5. The document provides an example comparing wine purchases with different music, calculates the chi-square statistic, and interprets the p-value to determine if distributions differ.
Relationships across distribution
The document describes a study conducted in a supermarket to examine the effect of background music on wine purchases. Customers were randomly assigned to one of three conditions: no music, French accordion music, or Italian string music. The number of bottles of French, Italian, and other wines purchased under each condition were recorded. A chi-square test is proposed to determine if the distribution of wine purchases differs across the three music treatments.
Chi square goodness of fit test
The document describes using a chi-square test to determine if the number of cars choosing each of three toll booth lanes is equal. An toll collector randomly sampled cars and recorded the lane chosen. The appropriate hypothesis is that the proportions of cars choosing each lane are equal (option c). The document then provides an example chi-square test on birth data to see if births are evenly distributed by day of week. It describes the chi-square test steps and conditions.
Ap statistics chp. 11
This document discusses using a chi-square goodness-of-fit test to determine if the observed color distribution of M&M's in a sample package matches the expected distribution claimed by the company. Students are instructed to calculate expected counts for each color based on the company's proportions, observe counts in their package, and calculate a chi-square statistic by summing the squared differences between observed and expected counts divided by the expected counts. A large chi-square value provides evidence against the null hypothesis that the company's claimed color distribution is correct.
Dividing polys
This document provides instructions for long hand polynomial division. It explains that polynomial division involves splitting up the dividend polynomial and dividing it by the divisor polynomial. It demonstrates the step-by-step process of long hand division with an example of (m^2 - 7m - 11) / (m - 8). The key steps are multiplying the divisor by terms of the dividend and subtracting to cancel out terms until a remainder is reached.
Solving triangles pp slides
This document contains two triangle problems. The first asks to find angle E given that f = 17 and d = 32. The second asks to find angle H given that g = 28 and h = 21.
Conditional prob & independence
1) The document discusses conditional probability and independence using examples of students with pierced ears and their gender.
2) Conditional probability is defined as P(B|A), the probability of event B occurring given that event A has already occurred.
3) The example shows that the probability of a student being male given they have pierced ears is different than the probability of being male in general, indicating the events are dependent.
Two way tables & venn diagrams
Students in a college statistics class collected data on 178 students' gender and whether their ears were pierced. They recorded this information in a two-way table to calculate probabilities. The two-way table showed that of the 90 male students, 19 had pierced ears. Of the 88 female students, 84 had pierced ears. The probabilities of being male with pierced ears, having pierced ears, or being male or having pierced ears can be determined from this two-way table.
Probability models & basic rules
This document provides an overview of key concepts in probability models, including:
1. A probability model consists of a sample space (the set of all possible outcomes) and probabilities assigned to each outcome. Common examples are coin tosses and dice rolls.
2. Events are subsets of outcomes from the sample space. The probability of an event, written P(A), is the chance it occurs.
3. For mutually exclusive events like getting a sum of 5 or 6 on dice, the total probability is the sum of the individual probabilities. Basic rules of probability include that all probabilities must sum to 1 and the probability of an event's complement is 1 minus the original probability.
Simulation
The document discusses simulations and provides examples. It describes simulating a parking lottery at a high school to determine if it was plausibly fair after two students from the same statistics class won spots. It outlines planning the simulation by numbering all 95 eligible students, those in statistics 1-28 and others 29-95, then randomly selecting two numbers using a random number table to simulate drawing winning tickets. The document also discusses simulating collecting NASCAR trading cards from cereal boxes to determine if a fan should be surprised it took 23 boxes to collect all 5 cards.
Mthys of probability
This document discusses key concepts in probability, including examples using dice, coin tosses, and the law of large numbers. It explains that the proportion of specific outcomes approaches a single probability value as the number of repetitions increases. Probability is defined as a value between 0 and 1 describing the long-run frequency of an outcome. Myths about probability, like short-run predictability and the law of averages, are also addressed.
4.3 using studies wisely
The document discusses different types of studies and the inferences that can be drawn from them. Random selection of individuals allows inferences about a population, while random assignment to groups allows inferences about causation. Observational studies using non-randomly assigned groups can infer characteristics of populations but not causation. Only randomized experiments and observational studies using random selection can potentially establish causal relationships.
4.2 blocking
Researchers want to test if a new detergent works better in warm or cold water for hand-washing clothes. To do this, they will use a randomized block design where they block, or separate, the clothes into categories based on expected differences in how they respond to temperature (e.g. cotton vs. wool). They will then randomly assign the detergent and water temperatures within each block to get more precise conclusions about how the detergent performs in each temperature for each type of fabric.
4.2 placebos & double blind
This document describes an experiment conducted by an electric company to test two approaches to encouraging energy conservation among customers: 1) providing small digital displays in households to show current electricity use and estimated monthly cost, and 2) giving customers a chart and information to monitor electricity use from their outside meter. The company will conduct an experiment comparing these two approaches to a control group that only receives general energy consumption information. The summary describes how the experiment would use a randomized design involving 60 households willing to participate, with the households randomly assigned to the three groups to compare the approaches.
More from amylute (20)
Recently uploaded
Walmart Business+ and Spark Good for Nonprofits.pdf
"Learn about all the ways Walmart supports nonprofit organizations.
You will hear from Liz Willett, the Head of Nonprofits, and hear about what Walmart is doing to help nonprofits, including Walmart Business and Spark Good. Walmart Business+ is a new offer for nonprofits that offers discounts and also streamlines nonprofits order and expense tracking, saving time and money.
The webinar may also give some examples on how nonprofits can best leverage Walmart Business+.
The event will cover the following::
Walmart Business + (https://business.walmart.com/plus) is a new shopping experience for nonprofits, schools, and local business customers that connects an exclusive online shopping experience to stores. Benefits include free delivery and shipping, a 'Spend Analytics” feature, special discounts, deals and tax-exempt shopping.
Special TechSoup offer for a free 180 days membership, and up to $150 in discounts on eligible orders.
Spark Good (walmart.com/sparkgood) is a charitable platform that enables nonprofits to receive donations directly from customers and associates.
Answers about how you can do more with Walmart!"
Wound healing PPT
This document provides an overview of wound healing, its functions, stages, mechanisms, factors affecting it, and complications.
A wound is a break in the integrity of the skin or tissues, which may be associated with disruption of the structure and function.
Healing is the body’s response to injury in an attempt to restore normal structure and functions.
Healing can occur in two ways: Regeneration and Repair
There are 4 phases of wound healing: hemostasis, inflammation, proliferation, and remodeling. This document also describes the mechanism of wound healing. Factors that affect healing include infection, uncontrolled diabetes, poor nutrition, age, anemia, the presence of foreign bodies, etc.
Complications of wound healing like infection, hyperpigmentation of scar, contractures, and keloid formation.
Constructing Your Course Container for Effective Communication
Communicating effectively and consistently with students can help them feel at ease during their learning experience and provide the instructor with a communication trail to track the course's progress. This workshop will take you through constructing an engaging course container to facilitate effective communication.
BÀI TẬP DẠY THÊM TIẾNG ANH LỚP 7 CẢ NĂM FRIENDS PLUS SÁCH CHÂN TRỜI SÁNG TẠO ...
BÀI TẬP DẠY THÊM TIẾNG ANH LỚP 7 CẢ NĂM FRIENDS PLUS SÁCH CHÂN TRỜI SÁNG TẠO ...Nguyen Thanh Tu Collection
https://app.box.com/s/qhtvq32h4ybf9t49ku85x0n3xl4jhr15LAND USE LAND COVER AND NDVI OF MIRZAPUR DISTRICT, UP
This Dissertation explores the particular circumstances of Mirzapur, a region located in the
core of India. Mirzapur, with its varied terrains and abundant biodiversity, offers an optimal
environment for investigating the changes in vegetation cover dynamics. Our study utilizes
advanced technologies such as GIS (Geographic Information Systems) and Remote sensing to
analyze the transformations that have taken place over the course of a decade.
The complex relationship between human activities and the environment has been the focus
of extensive research and worry. As the global community grapples with swift urbanization,
population expansion, and economic progress, the effects on natural ecosystems are becoming
more evident. A crucial element of this impact is the alteration of vegetation cover, which plays a
significant role in maintaining the ecological equilibrium of our planet.Land serves as the foundation for all human activities and provides the necessary materials for
these activities. As the most crucial natural resource, its utilization by humans results in different
'Land uses,' which are determined by both human activities and the physical characteristics of the
land.
The utilization of land is impacted by human needs and environmental factors. In countries
like India, rapid population growth and the emphasis on extensive resource exploitation can lead
to significant land degradation, adversely affecting the region's land cover.
Therefore, human intervention has significantly influenced land use patterns over many
centuries, evolving its structure over time and space. In the present era, these changes have
accelerated due to factors such as agriculture and urbanization. Information regarding land use and
cover is essential for various planning and management tasks related to the Earth's surface,
providing crucial environmental data for scientific, resource management, policy purposes, and
diverse human activities.
Accurate understanding of land use and cover is imperative for the development planning
of any area. Consequently, a wide range of professionals, including earth system scientists, land
and water managers, and urban planners, are interested in obtaining data on land use and cover
changes, conversion trends, and other related patterns. The spatial dimensions of land use and
cover support policymakers and scientists in making well-informed decisions, as alterations in
these patterns indicate shifts in economic and social conditions. Monitoring such changes with the
help of Advanced technologies like Remote Sensing and Geographic Information Systems is
crucial for coordinated efforts across different administrative levels. Advanced technologies like
Remote Sensing and Geographic Information Systems
9
Changes in vegetation cover refer to variations in the distribution, composition, and overall
structure of plant communities across different temporal and spatial scales. These changes can
occur natural.
How to Make a Field Mandatory in Odoo 17
In Odoo, making a field required can be done through both Python code and XML views. When you set the required attribute to True in Python code, it makes the field required across all views where it's used. Conversely, when you set the required attribute in XML views, it makes the field required only in the context of that particular view.
Temple of Asclepius in Thrace. Excavation results
The temple and the sanctuary around were dedicated to Asklepios Zmidrenus. This name has been known since 1875 when an inscription dedicated to him was discovered in Rome. The inscription is dated in 227 AD and was left by soldiers originating from the city of Philippopolis (modern Plovdiv).
Chapter wise All Notes of First year Basic Civil Engineering.pptx
Chapter wise All Notes of First year Basic Civil Engineering
Syllabus
Chapter-1
Introduction to objective, scope and outcome the subject
Chapter 2
Introduction: Scope and Specialization of Civil Engineering, Role of civil Engineer in Society, Impact of infrastructural development on economy of country.
Chapter 3
Surveying: Object Principles & Types of Surveying; Site Plans, Plans & Maps; Scales & Unit of different Measurements.
Linear Measurements: Instruments used. Linear Measurement by Tape, Ranging out Survey Lines and overcoming Obstructions; Measurements on sloping ground; Tape corrections, conventional symbols. Angular Measurements: Instruments used; Introduction to Compass Surveying, Bearings and Longitude & Latitude of a Line, Introduction to total station.
Levelling: Instrument used Object of levelling, Methods of levelling in brief, and Contour maps.
Chapter 4
Buildings: Selection of site for Buildings, Layout of Building Plan, Types of buildings, Plinth area, carpet area, floor space index, Introduction to building byelaws, concept of sun light & ventilation. Components of Buildings & their functions, Basic concept of R.C.C., Introduction to types of foundation
Chapter 5
Transportation: Introduction to Transportation Engineering; Traffic and Road Safety: Types and Characteristics of Various Modes of Transportation; Various Road Traffic Signs, Causes of Accidents and Road Safety Measures.
Chapter 6
Environmental Engineering: Environmental Pollution, Environmental Acts and Regulations, Functional Concepts of Ecology, Basics of Species, Biodiversity, Ecosystem, Hydrological Cycle; Chemical Cycles: Carbon, Nitrogen & Phosphorus; Energy Flow in Ecosystems.
Water Pollution: Water Quality standards, Introduction to Treatment & Disposal of Waste Water. Reuse and Saving of Water, Rain Water Harvesting. Solid Waste Management: Classification of Solid Waste, Collection, Transportation and Disposal of Solid. Recycling of Solid Waste: Energy Recovery, Sanitary Landfill, On-Site Sanitation. Air & Noise Pollution: Primary and Secondary air pollutants, Harmful effects of Air Pollution, Control of Air Pollution. . Noise Pollution Harmful Effects of noise pollution, control of noise pollution, Global warming & Climate Change, Ozone depletion, Greenhouse effect
Text Books:
1. Palancharmy, Basic Civil Engineering, McGraw Hill publishers.
2. Satheesh Gopi, Basic Civil Engineering, Pearson Publishers.
3. Ketki Rangwala Dalal, Essentials of Civil Engineering, Charotar Publishing House.
4. BCP, Surveying volume 1
Beyond Degrees - Empowering the Workforce in the Context of Skills-First.pptx
Iván Bornacelly, Policy Analyst at the OECD Centre for Skills, OECD, presents at the webinar 'Tackling job market gaps with a skills-first approach' on 12 June 2024
Gender and Mental Health - Counselling and Family Therapy Applications and In...
A proprietary approach developed by bringing together the best of learning theories from Psychology, design principles from the world of visualization, and pedagogical methods from over a decade of training experience, that enables you to: Learn better, faster!
বাংলাদেশ অর্থনৈতিক সমীক্ষা (Economic Review) ২০২৪ UJS App.pdf
বাংলাদেশের অর্থনৈতিক সমীক্ষা ২০২৪ [Bangladesh Economic Review 2024 Bangla.pdf] কম্পিউটার , ট্যাব ও স্মার্ট ফোন ভার্সন সহ সম্পূর্ণ বাংলা ই-বুক বা pdf বই " সুচিপত্র ...বুকমার্ক মেনু 🔖 ও হাইপার লিংক মেনু 📝👆 যুক্ত ..
আমাদের সবার জন্য খুব খুব গুরুত্বপূর্ণ একটি বই ..বিসিএস, ব্যাংক, ইউনিভার্সিটি ভর্তি ও যে কোন প্রতিযোগিতা মূলক পরীক্ষার জন্য এর খুব ইম্পরট্যান্ট একটি বিষয় ...তাছাড়া বাংলাদেশের সাম্প্রতিক যে কোন ডাটা বা তথ্য এই বইতে পাবেন ...
তাই একজন নাগরিক হিসাবে এই তথ্য গুলো আপনার জানা প্রয়োজন ...।
বিসিএস ও ব্যাংক এর লিখিত পরীক্ষা ...+এছাড়া মাধ্যমিক ও উচ্চমাধ্যমিকের স্টুডেন্টদের জন্য অনেক কাজে আসবে ...
clinical examination of hip joint (1).pdf
described clinical examination all orthopeadic conditions .
ISO/IEC 27001, ISO/IEC 42001, and GDPR: Best Practices for Implementation and...
Denis is a dynamic and results-driven Chief Information Officer (CIO) with a distinguished career spanning information systems analysis and technical project management. With a proven track record of spearheading the design and delivery of cutting-edge Information Management solutions, he has consistently elevated business operations, streamlined reporting functions, and maximized process efficiency.
Certified as an ISO/IEC 27001: Information Security Management Systems (ISMS) Lead Implementer, Data Protection Officer, and Cyber Risks Analyst, Denis brings a heightened focus on data security, privacy, and cyber resilience to every endeavor.
His expertise extends across a diverse spectrum of reporting, database, and web development applications, underpinned by an exceptional grasp of data storage and virtualization technologies. His proficiency in application testing, database administration, and data cleansing ensures seamless execution of complex projects.
What sets Denis apart is his comprehensive understanding of Business and Systems Analysis technologies, honed through involvement in all phases of the Software Development Lifecycle (SDLC). From meticulous requirements gathering to precise analysis, innovative design, rigorous development, thorough testing, and successful implementation, he has consistently delivered exceptional results.
Throughout his career, he has taken on multifaceted roles, from leading technical project management teams to owning solutions that drive operational excellence. His conscientious and proactive approach is unwavering, whether he is working independently or collaboratively within a team. His ability to connect with colleagues on a personal level underscores his commitment to fostering a harmonious and productive workplace environment.
Date: May 29, 2024
Tags: Information Security, ISO/IEC 27001, ISO/IEC 42001, Artificial Intelligence, GDPR
-------------------------------------------------------------------------------
Find out more about ISO training and certification services
Training: ISO/IEC 27001 Information Security Management System - EN | PECB
ISO/IEC 42001 Artificial Intelligence Management System - EN | PECB
General Data Protection Regulation (GDPR) - Training Courses - EN | PECB
Webinars: https://pecb.com/webinars
Article: https://pecb.com/article
-------------------------------------------------------------------------------
For more information about PECB:
Website: https://pecb.com/
LinkedIn: https://www.linkedin.com/company/pecb/
Facebook: https://www.facebook.com/PECBInternational/
Slideshare: http://www.slideshare.net/PECBCERTIFICATION
Pengantar Penggunaan Flutter - Dart programming language1.pptx
Pengantar Penggunaan Flutter - Dart programming language1.pptx
Bed Making ( Introduction, Purpose, Types, Articles, Scientific principles, N...
Topic : Bed making
Subject : Nursing Foundation
Recently uploaded (20)
Walmart Business+ and Spark Good for Nonprofits.pdf
Walmart Business+ and Spark Good for Nonprofits.pdf
Constructing Your Course Container for Effective Communication
Constructing Your Course Container for Effective Communication
BÀI TẬP DẠY THÊM TIẾNG ANH LỚP 7 CẢ NĂM FRIENDS PLUS SÁCH CHÂN TRỜI SÁNG TẠO ...
BÀI TẬP DẠY THÊM TIẾNG ANH LỚP 7 CẢ NĂM FRIENDS PLUS SÁCH CHÂN TRỜI SÁNG TẠO ...
LAND USE LAND COVER AND NDVI OF MIRZAPUR DISTRICT, UP
LAND USE LAND COVER AND NDVI OF MIRZAPUR DISTRICT, UP
Chapter wise All Notes of First year Basic Civil Engineering.pptx
Chapter wise All Notes of First year Basic Civil Engineering.pptx
Beyond Degrees - Empowering the Workforce in the Context of Skills-First.pptx
Beyond Degrees - Empowering the Workforce in the Context of Skills-First.pptx
Gender and Mental Health - Counselling and Family Therapy Applications and In...
Gender and Mental Health - Counselling and Family Therapy Applications and In...
বাংলাদেশ অর্থনৈতিক সমীক্ষা (Economic Review) ২০২৪ UJS App.pdf
বাংলাদেশ অর্থনৈতিক সমীক্ষা (Economic Review) ২০২৪ UJS App.pdf
NEWSPAPERS - QUESTION 1 - REVISION POWERPOINT.pptx
NEWSPAPERS - QUESTION 1 - REVISION POWERPOINT.pptx
ISO/IEC 27001, ISO/IEC 42001, and GDPR: Best Practices for Implementation and...
ISO/IEC 27001, ISO/IEC 42001, and GDPR: Best Practices for Implementation and...
Pengantar Penggunaan Flutter - Dart programming language1.pptx
Pengantar Penggunaan Flutter - Dart programming language1.pptx
Bed Making ( Introduction, Purpose, Types, Articles, Scientific principles, N...
Bed Making ( Introduction, Purpose, Types, Articles, Scientific principles, N...
Chi square distribution table c
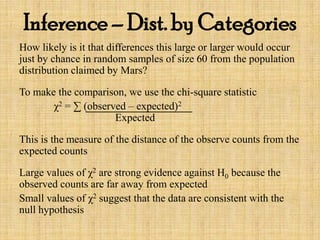
- 1. Inference – Dist. by Categories How likely is it that differences this large or larger would occur just by chance in random samples of size 60 from the population distribution claimed by Mars? To make the comparison, we use the chi-square statistic χ2 = ∑ (observed – expected)2 Expected This is the measure of the distance of the observe counts from the expected counts Large values of χ2 are strong evidence against H0 because the observed counts are far away from expected Small values of χ2 suggest that the data are consistent with the null hypothesis
- 2. Inference – Dist. by Categories Jerome’s class did the M&M Activity and here are his results: Calculate the chi-square statistic We divide each category by its respective expected value so that the largest relative difference contributes more heavily to the evidence against the null Color Observed Expected Blue 9 14.4 Orange 8 12 Green 12 9.6 Yellow 15 8.4 Red 10 7.8 Brown 6 7.8
- 3. Inference – Dist. by Categories Pg. 682 The chi-square distribution includes only positive and is skewed right. Each chi-square distribution is specified by giving its degrees of freedom. Degrees of freedom for a chi-square goodness-of-fit test = number of categories – 1 As the degrees of freedom increase, the density curves become less skewed, and larger values become more probable The mean of a particular chi-square distribution is equal to its degrees of freedom When degrees of freedom are > 2, the peak of the chi-square density curve is at df – 2
- 4. Inference – Dist. by Categories To find the P-value from a chi-square distribution, we use Table C Use the degree of freedom row on the left of the table Locate the approximate values the χ2 lies between and the P-value lies between the two values at the top of those two columns.
- 5. Inference – Dist. by Categories In the last example, we computed the chi-square statistic for Jerome’s random sample of 60 M&M’s Milk Chocolate Candies: χ2 = 10.180. Now let’s find the P-value. Because all the expected counts are at least 5, the χ2 statistic will follow a chi- square distribution reasonably well when H0 is true. There are 6 color categories for M&M’s Milk Chocolate Candies, so df = 6 -1 = 5. The P-value is the probability of getting a value of χ2 as large as or larger than 10.180 when H0 is true. Pg. 683
- 6. Inference – Dist. by Categories Technology can give us a more precise P-value DISTR – χ2 cdf χ2 cdf ( χ2 , large # (1000), df ) Since our P-value is 0.07 is greater than our significance level α = 0.05, we fail to reject H0. We don’t have sufficient evidence to conclude that the company’s claimed color distribution is incorrect. Pg. 684 Check Your Understanding